CERN-EP-2018-344 2019/09/30
CMS-SMP-17-009
Azimuthal separation in nearly back-to-back jet topologies
in inclusive 2- and 3-jet events in pp collisions at
√
s
=
13 TeV
The CMS Collaboration
∗Abstract
A measurement for inclusive 2- and 3-jet events of the azimuthal correlation be-tween the two jets with the largest transverse momenta, ∆φ12, is presented. The measurement considers events where the two leading jets are nearly collinear (“back-to-back”) in the transverse plane and is performed for several ranges of the leading jet transverse momentum. Proton-proton collision data collected with the CMS ex-periment at a center-of-mass energy of 13 TeV and corresponding to an integrated luminosity of 35.9 fb−1 are used. Predictions based on calculations using matrix el-ements at leading-order and next-to-leading-order accuracy in perturbative quan-tum chromodynamics supplemented with leading-log parton showers and hadron-ization are generally in agreement with the measurements. Discrepancies between the measurement and theoretical predictions are as large as 15%, mainly in the region 177◦ <∆φ12<180◦. The 2- and 3-jet measurements are not simultaneously described by any of models.
”Published in the European Physical Journal C as doi:10.1140/epjc/s10052-019-7276-4.”
c
2019 CERN for the benefit of the CMS Collaboration. CC-BY-4.0 license
∗See Appendix A for the list of collaboration members
1
Introduction
Collimated streams of particles (jets) can be produced in highly energetic parton-parton interac-tions in proton-proton (s ) collisions, and their properties are described by the theory of strong interactions, quantum chromodynamics (QCD). In the lowest order perturbative QCD (pQCD), two jets with high transverse momenta pTare produced “back-to-back” in the transverse plane. Higher order corrections lead to deviations from this configuration. Experimentally, this can be investigated by the measurement of the azimuthal separation,∆φ12= |φjet1−φjet2|, between the two leading pT jets in the transverse plane. Within the framework of pQCD, a final state with three or more partons is required for significant deviations from∆φ12 = 180◦. However, when deviations of∆φ12from 180◦ are small, a pQCD calculation at a fixed order in the strong coupling αS becomes unstable and a resummation of soft parton emissions to all orders in αS has to be performed. This resummation is approximated through the use of parton showers in Monte Carlo (MC) event generators.
Azimuthal correlations in inclusive 2-jet events have been measured previously by the D0 Col-laboration in pp collisions at a center-of-mass energy of√s = 1.96 TeV [1, 2], in pp collisions by the ATLAS Collaboration at√s = 7 TeV [3], and by the CMS Collaboration at √s = 7, 8, and 13 TeV [4–6], but none of the measurements considered in detail the region close to the back configuration. A detailed study of azimuthal correlations close to the back-to-back configuration allows a more precise test of different resummation strategies, and it is a first step towards an improved understanding of the effects of soft initial and final state gluons [7, 8]. The leading- and next-to-leading-logarithm contributions to the dijet azimuthal angular correlation have been investigated in [9–11]. The effects of applying a transverse momentum dependent parton showering to the dijet azimuthal angular correlation were studied in [12]. In this article measurements are reported of the normalized inclusive 2-jet distribution as a function of the azimuthal separation∆φ12between the two leading pTjets (jets 1 and 2),
1 σpmax T dσ d∆φ12 , (1)
in several intervals of the leading jet pT (pmaxT ) within the rapidity range|y| < 2.5. The total dijet cross section σpmax
T is measured within each range of p
max
T integrated over the full range in
∆φ12. The binning of the measurement presented here is much finer than that of Ref. [6]. We
consider∆φ12in the range 170◦ <∆φ12≤180◦.
The inclusive 3-jet distributions, differential in∆φ12and pmax
T , with the pTof third highest pTjet
typically being 1-2 orders of magnitude smaller than pmax
T , are also suitable to test resummation
effects arising from the presence of multiple scales in the interaction. Measurements of the inclusive 3-jet distribution normalized to σpmax
T are also presented, for several ranges of p
max
T ,
and within|y| <2.5.
The measurements are performed using data collected from p p collisions at √s = 13 TeV during 2016 with the CMS experiment at the CERN LHC, corresponding to an integrated lu-minosity of 35.9 fb−1.
2
The CMS Detector
The central feature of the CMS detector is a superconducting solenoid, 13 m in length and 6 m in inner diameter, providing an axial magnetic field of 3.8 T. Within the solenoid volume are a silicon pixel and strip tracker, a lead tungstate crystal electromagnetic calorimeter (ECAL)
and a brass and scintillator hadron calorimeter (HCAL), each composed of a barrel and two endcap sections. Charged-particle trajectories are measured by the tracker with full azimuthal coverage within pseudorapidities|η| < 2.5. The ECAL, which is equipped with a preshower detector in the endcaps, and the HCAL cover the region|η| <3.0. Forward calorimeters extend the pseudorapidity coverage provided by the barrel and endcap detectors to the region 3.0 < |η| <5.2. Finally, muons are measured up to|η| < 2.4 by gas-ionization detectors embedded in the steel flux-return yoke outside the solenoid. A detailed description of the CMS detector together with a definition of the coordinate system used and the relevant kinematic variables can be found in Ref. [13].
3
Theoretical predictions
Simulations from leading-order (LO) and next-to-LO (NLO) MC event generators are inves-tigated. Among the LO event generators, both PYTHIA 8 [14] (version 8.219) and HERWIG++ [15] (version 2.7.1) are used for predictions because they feature different parton showering (PS) algorithms for soft and collinear parton radiation at leading-log accuracy. In PYTHIA 8 the PS emissions cover a region of phase space ordered in x (fraction of the proton momen-tum carried by the parton) and the pTof the emitted parton, whereas inHERWIG++ the parton
emissions are ordered in x and the angle of the radiated parton (angular ordering). The Lund string model [16] is used for hadronization inPYTHIA8 [14], whereas inHERWIG++ the cluster
fragmentation model [17] is applied. Multiparton interactions (MPI) are simulated inPYTHIA
8 (tune CUETP8M1 [18] with the parton distribution function (PDF) set NNPDF2.3LO [19, 20]) and in HERWIG++ (tune CUETHppS1 [18] with the PDF set CTEQ6L1 [21]) with parameters tuned to measurements in p p collisions at the LHC and pp collisions at the Tevatron.
The MADGRAPH5 aMC@NLO [22] version 2.3.3 event generator (labelled as MADGRAPH in
the following) interfaced with PYTHIA 8 with tune CUETP8M1 is also used in the analysis.
Processes with up to 4 final-state partons at LO accuracy are calculated using the NNPDF2.3LO PDF set. The kT-MLM matching procedure [23] is used with a matching scale of 10 GeV. Among the NLO event generators, predictions obtained using thePOWHEG BOXlibrary [24–26] (version 2) with the PDF set NNPDF3.0NLO [27] are considered. The event generatorsPYTHIA
8 (tune CUETP8M1) andHERWIG++ (tune CUETHppS1) are used to simulate PS, hadroniza-tion, and MPI. ThePOWHEGgenerator in dijet mode [28], referred to asPH-2J, provides an NLO
dijet calculation, which is accurate to LO for the azimuthal correlation between the leading jets. ThePOWHEGgenerator in three-jet mode [29] (using the MiNLO scheme [30, 31]), referred to as PH-3J, provides an NLO 2→3 calculation. For thePH-2Jmatrix elements (ME), a minimum pT of 100 GeV is required on the partons in the Born process, while for thePH-3JME the minimum is lowered to 10 GeV to ensure coverage of the full phase space. These thresholds are applied to optimize the generation of events in the phase space of interest. The matching between the
POWHEGmatrix element calculations and thePYTHIA8 underlying event (UE) [18] simulation is performed by using the shower-veto procedure (UserHook option 2 [14]). The matching be-tween the POWHEG matrix element calculations and theHERWIG++ UE [18] is performed by
using a truncated shower [24].
Events generated byPYTHIA8 (tune CUETP8M1),HERWIG++ (tune CUETHppS1), and MAD -GRAPHinterfaced withPYTHIA8 (tune CUETP8M1) are passed through a full detector simula-tion based on GEANT4 [32]. The simulated events events are reconstructed with standard CMS programs.
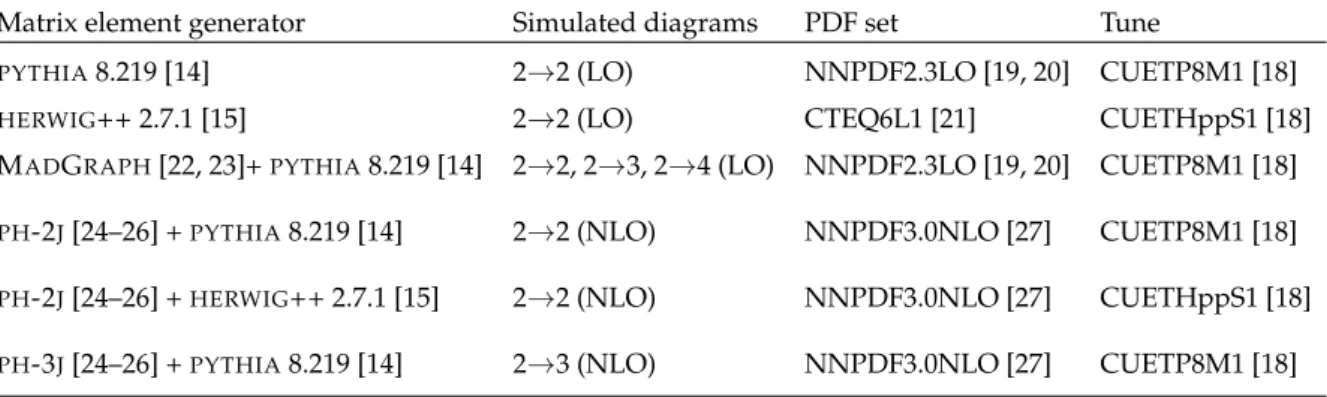
Table 1: Monte Carlo event generators, parton densities, and underlying event tunes used for comparison with measurements.
Matrix element generator Simulated diagrams PDF set Tune
PYTHIA8.219 [14] 2→2 (LO) NNPDF2.3LO [19, 20] CUETP8M1 [18]
HERWIG++ 2.7.1 [15] 2→2 (LO) CTEQ6L1 [21] CUETHppS1 [18]
MADGRAPH[22, 23]+PYTHIA8.219 [14] 2→2, 2→3, 2→4 (LO) NNPDF2.3LO [19, 20] CUETP8M1 [18]
PH-2J[24–26] +PYTHIA8.219 [14] 2→2 (NLO) NNPDF3.0NLO [27] CUETP8M1 [18]
PH-2J[24–26] +HERWIG++ 2.7.1 [15] 2→2 (NLO) NNPDF3.0NLO [27] CUETHppS1 [18]
PH-3J[24–26] +PYTHIA8.219 [14] 2→3 (NLO) NNPDF3.0NLO [27] CUETP8M1 [18]
4
Jet reconstruction and event selection
The measurements are based on data samples collected with single-jet high-level triggers [33, 34]. The five single-jet triggers require at least one jet in the event with pT >140, 200, 320, 400, or 450 GeV within the full rapidity coverage of the CMS calorimetry. Table 2 shows the various pmaxT regions accessed by the various triggers and the integrated luminosity for each trigger in the analysis. Each trigger is fully efficient for jets in the corresponding pTrange in Table 2. Table 2: The integrated luminosity for each trigger sample in the analysis, and trigger used for each pmaxT range.
HLT pTthreshold (GeV) 140 200 320 400 450
L(fb−1) 0.024 0.11 1.77 5.2 36
pmaxT region (GeV) 200–300 300–400 400–500 500–600 >600
Particles are reconstructed and identified using a particle-flow (PF) algorithm [35], which uti-lizes an optimized combination of information from the various elements of the CMS detector. Jets are reconstructed by clustering the four-vectors of the PF candidates with the infrared-and collinear-safe anti-kT clustering algorithm [36] with a distance parameter R = 0.4. The clustering is performed with the FASTJET package [37]. To reduce the contribution to the
re-constructed jets from additional p p interactions within the same bunch crossing (pileup), the charged-hadron subtraction technique [38] is used to remove tracks identified as originating from pileup vertices. The average number of pileup interactions per single bunch crossing ob-served in the data is about 27. The pileup contribution from neutral hadrons is corrected using a jet-area-based correction technique [39].
For this analysis, jets with rapidity|y| < 5.0 are reconstructed. For both the inclusive 2- and 3-jet samples, the events are selected by requiring the two highest pT jets to have |y| < 2.5 and pT > 100 GeV. For the inclusive 3-jet events a third jet with pT > 30 GeV and|y| <2.5 is required. Contributions from pileup are negligible because the pileup removal algorithm has an efficiency of∼99% for jets with 30< pT <50 GeV and|y| <2.5 [40].
5
Measurements of the normalized inclusive 2- and 3-jet
distribu-tions
The normalized inclusive 2- and 3-jet distributions as a function of∆φ12 are corrected for de-tector resolution. We achieve this by unfolding the observables to the level of stable final-state particles. In this way, a direct comparison of these measurements to results from other
exper-iments and to QCD predictions is possible. Particles are considered stable if their mean decay length is larger than 1 cm.
The unfolding procedure is based on the D’Agostini algorithm [41], which is implemented in the ROOUNFOLDpackage [42], by using a response matrix that maps the generated jets onto the jets reconstructed by the CMS detector. The regularization (number of iterations) of the unfolding procedure is chosen by comparing the difference in χ2 between data and MC at detector level to that between data and MC at particle level. The consistency of the unfolding procedure is checked against the alternative TUNFOLD package [43, 44], which uses a least square minimization with Tikhonov regularization. Both methods provide equivalent results. The unfolding is performed in∆φ12. The response matrices are obtained using simulated events from the PYTHIA 8 event generator with the tune CUETP8M1. The difference between the
unfolded distributions and the distributions at detector level range from∼1% for the low pmaxT regions up to∼5% for the high pmaxT regions.
The sources of systematic uncertainties arise primarily from the jet energy scale calibration (JES), the jet energy resolution (JER), the ∆φ12 resolution, and the model dependence of the unfolding matrix. The effect of migrations between pmaxT regions is very small because of the normalization of the cross sections in each pmaxT range and therefore is neglected.
The ∆φ12resolution is ∼0.5◦, as obtained from fully simulated event samples fromPYTHIA 8 and MADGRAPH. A bin size of 1◦ is a compromise between the ability to study the back-to-back region and the impact of the unfolding correction of∼2%. In Ref. [6] the study is focused on a different∆φ12region, and a coarser bin size is chosen to account for the smaller size of the data sample.
Alternative response matrices are obtained by using the∆φ12resolution determined from fully simulated events. This resolution is varied by±10%, an amount that is motivated by the ob-served difference between data and simulation. The resulting uncertainty is estimated to be below 1%.
An additional systematic uncertainty is caused by the dependence of the response matrix on the choice of the MC generator. Alternative response matrices are built using the HERWIG++ and MADGRAPH+PYTHIA8 event generators. Because this analysis uses a finer binning
com-pared with that of Ref. [6], the sensitivity to the uncertainty in the unfolding is increased. The observed effect from bin migration is less than 2%.
The JER and shifts in the JES can cause events to migrate between the pmaxT regions. The JES uncertainties on the energy measurement are estimated to be 1–2% [38]. The resulting JES un-certainties in the normalized inclusive 2-jet distributions due to bin migrations are less than 2%, whereas for the normalized inclusive 3-jet distributions they are less than 3%. The effect of the JER uncertainties [38] is estimated by varying the JER parameters by one standard devi-ation up and down and comparing the results before and after the changes. The JER-induced uncertainties are less than 0.2% for the inclusive 2-jet∆φ12 measurement and below 0.4% for the normalized inclusive 3-jet measurement.
6
Comparison to theoretical predictions
In this section the measurements are compared with different theoretical predictions intro-duced in Section 3. In all figures displaying ratios, the solid band indicates the total exper-imental uncertainty and the error bars represent the statistical uncertainties from the simula-tion. In the figures displaying the normalized distributions, the error bars on the data represent
the total experimental uncertainty and the error bars on the predictions represent the statistical uncertainty of the simulation. The uncertainties are often so small that the bars are not visible.
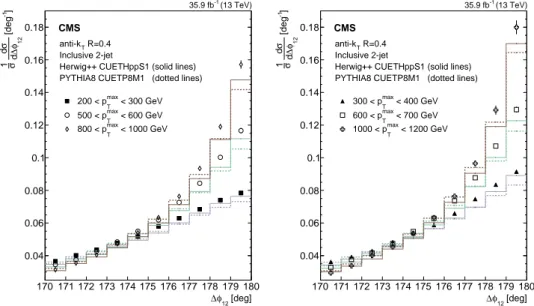
[deg] 12 φ ∆ ] -1 [deg 12 φ∆ d σ d σ 1 0.04 0.06 0.08 0.1 0.12 0.14 0.16 0.18 170 171 172 173 174 175 176 177 178 179 180 CMS (13 TeV) -1 35.9 fb < 300 GeV max T 200 < p < 600 GeV max T 500 < p < 1000 GeV max T 800 < p R=0.4 T anti-k Inclusive 2-jet
Herwig++ CUETHppS1 (solid lines) PYTHIA8 CUETP8M1 (dotted lines)
[deg] 12 φ ∆ ] -1 [deg 12 φ∆ d σ d σ 1 0.04 0.06 0.08 0.1 0.12 0.14 0.16 0.18 170 171 172 173 174 175 176 177 178 179 180 CMS (13 TeV) -1 35.9 fb < 400 GeV max T 300 < p < 700 GeV max T 600 < p < 1200 GeV max T 1000 < p R=0.4 T anti-k Inclusive 2-jet
Herwig++ CUETHppS1 (solid lines) PYTHIA8 CUETP8M1 (dotted lines)
Figure 1: Normalized inclusive 2-jet distributions as a function of the azimuthal separation of the two leading jets∆φ12for different pmaxT regions. The data are represented by the markers and the theory by histograms. Overlaid with the data are predictions from the HERWIG++ event generator (solid lines) andPYTHIA8 (dotted lines). The total experimental uncertainty is depicted as error bars on the measurement.
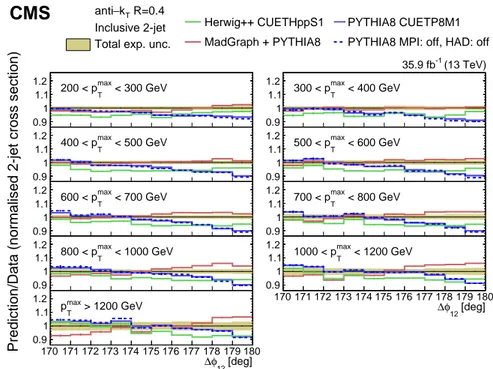
The unfolded normalized inclusive 2-jet distribution as a function of∆φ12 is shown in Fig. 1, and compared with the predictions fromHERWIG++ (solid lines ) andPYTHIA8 (dotted lines) for different pmaxT regions. The distributions are strongly peaked at 180◦ and become steeper with increasing pmaxT . The ratio of the PYTHIA 8, HERWIG++, and MADGRAPH + PYTHIA 8 event generator predictions to data are depicted in Fig. 2 for the inclusive 2-jet distributions in the nine pmaxT ranges. Among the event generators, PYTHIA 8 and HERWIG++ show the
largest deviations from the measurements for the pmax
T <800 GeV regions in the inclusive 2-jet
case, and the MADGRAPH+ PYTHIA8 event generator gives the best description in the same
regions. The three generators show large deviations from the measurements in the pmaxT > 800 GeV regions. The nonperturbative corrections are estimated to be small (below 1.5%) by comparing the predictions fromPYTHIA8 without the simulation of multi-parton interactions and hadronization (dashed blue curve) to the predictions fromPYTHIA8 when these effects are included (solid blue curve). The nonperturbative correction factors are available in HepData. The ratios of the NLO predictions to data for the unfolded normalized inclusive 2-jet distribu-tions for the different pmax
T regions are shown in Fig. 3. The NLO calculations considered are
PH-2J+PYTHIA8, PH-2J+HERWIG++, andPH-3J +PYTHIA8. Among these NLO predictions
PH-3J +PYTHIA8 agrees better with the data. ThePH-2J+HERWIG++ prediction is similar to the one ofPH-3J+PYTHIA8, except for the lowest pmaxT region.
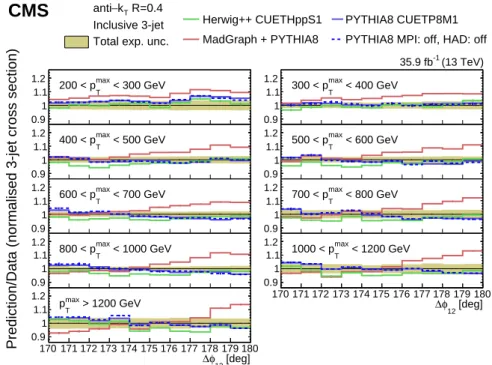
In Fig. 4 the unfolded normalized inclusive 3-jet distribution as a function of∆φ12are compared with the predictions fromHERWIG++ (solid lines) andPYTHIA8 (dotted lines) for different pmaxT
regions. The ratios of the normalized inclusive 3-jet distributions for thePYTHIA8,HERWIG++,
and MADGRAPH + PYTHIA 8 predictions to data are shown in Fig. 5 for the different pmaxT
regions. In contrast to the 2-jet case, MADGRAPH+PYTHIA8 shows the largest deviations from the measurements close to 180◦, whereasPYTHIA8 andHERWIG++ give a good description of the data.
[deg] 12 φ ∆ 0.9 1 1.1 1.2 < 400 GeV max T 300 < p [deg] 12 φ ∆ 0.9 1 1.1 1.2 < 300 GeV max T 200 < p [deg] 12 φ ∆ 0.9 1 1.1 1.2 < 600 GeV max T 500 < p [deg] 12 φ ∆ 0.9 1 1.1 1.2 < 500 GeV max T 400 < p [deg] 12 φ ∆ 0.9 1 1.1 1.2 < 800 GeV max T 700 < p [deg] 12 φ ∆ 0.9 1 1.1 1.2 < 700 GeV max T 600 < p [deg] 12 φ ∆ 0.9 1 1.1 1.2 170 171 172 173 174 175 176 177 178 179 180 < 1200 GeV max T 1000 < p [deg] 12 φ ∆ 0.9 1 1.1 1.2 < 1000 GeV max T 800 < p [deg] 12 φ ∆ 0.9 1 1.1 1.2 170 171 172 173 174 175 176 177 178 179 180 > 1200 GeV max T p R=0.4 T k − anti Inclusive 2-jet Total exp. unc.
Herwig++ CUETHppS1 MadGraph + PYTHIA8
PYTHIA8 CUETP8M1 PYTHIA8 MPI: off, HAD: off
CMS
Prediction/Data (normalised 2-jet cross section)
(13 TeV)
-1
35.9 fb
Figure 2: Ratios of the normalized inclusive 2-jet distributions for thePYTHIA 8, HERWIG++,
and MADGRAPH+PYTHIA8 predictions to data as a function of the azimuthal separation of the two leading jets∆φ12, for all the pmaxT regions. The solid band indicates the total experimental uncertainty and the error bars on the MC points represent the statistical uncertainty of the simulated data.
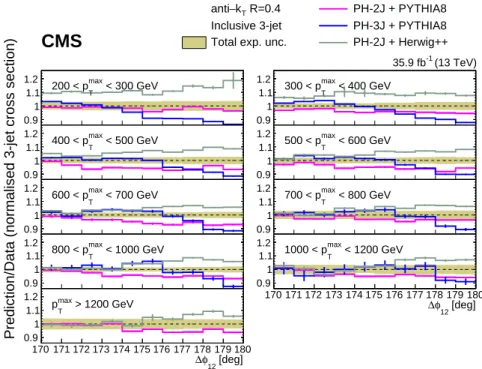
The ratios of the NLO predictions from PH-2J + PYTHIA 8, PH-2J + HERWIG++, andPH-3J + PYTHIA 8 to data for the normalized inclusive 3-jet distributions are shown in Fig. 6. All the
considered NLO+PS predictions fail to describe the measurements close to 180◦. The predic-tions from PH-3J and MADGRAPH(Fig. 5) behave very differently, in contrast to their similar trend in the inclusive 2-jet case.
SincePYTHIA8,PH-2J+PYTHIA8,PH-3J+PYTHIA8, and MADGRAPH+PYTHIA8 use the same parton shower, the observed differences in the predictions can be attributed to the treatment of the additional partons present in thePOWHEGand MADGRAPHME.
In general we observe that the∆φ12region close to 180◦is not well described by the predictions. The predictions agree better with the measurements for increasing pmaxT and moving further away from the back-to-back region in ∆φ12, where the contribution of resummation effects becomes smaller [10]. The fact that none of the generators is able to describe the 2- and 3-jet measurements simultaneously suggests that the observed differences (of the order of 10%) are related to the way soft partons are simulated within the PS. The observed differences between pT and angular ordered PS for the LO generatorsPYTHIA 8 andHERWIG++ are small (Figs. 2
and 5) compared to the MADGRAPH predictions, which can be attributed to the presence of
higher order ME.
The theoretical calculations have an intrinsic uncertainty arising from the freedom of choice of the renormalization and factorization scales (µrand µf), the choice of the PDF and αS(mZ), and the modeling of nonperturbative effects and PS. The total theoretical uncertainty is the quadratic sum of the uncertainties from the scale, PDF, αS, and PS variations. Despite the better agreement of PH-3J, thePH-2J event generator is used instead for the estimation of the
[deg] 12 φ ∆ 0.9 1 1.1 1.2 < 400 GeV max T 300 < p [deg] 12 φ ∆ 0.9 1 1.1 1.2 < 300 GeV max T 200 < p [deg] 12 φ ∆ 0.9 1 1.1 1.2 < 600 GeV max T 500 < p [deg] 12 φ ∆ 0.9 1 1.1 1.2 < 500 GeV max T 400 < p [deg] 12 φ ∆ 0.9 1 1.1 1.2 < 800 GeV max T 700 < p [deg] 12 φ ∆ 0.9 1 1.1 1.2 < 700 GeV max T 600 < p [deg] 12 φ ∆ 0.9 1 1.1 1.2 170 171 172 173 174 175 176 177 178 179 180 < 1200 GeV max T 1000 < p [deg] 12 φ ∆ 0.9 1 1.1 1.2 < 1000 GeV max T 800 < p [deg] 12 φ ∆ 0.9 1 1.1 1.2 170 171 172 173 174 175 176 177 178 179 180 > 1200 GeV max T p R=0.4 T k − anti Inclusive 2-jet Total exp. unc.
PH-2J + PYTHIA8 PH-3J + PYTHIA8 PH-2J + Herwig++
CMS
Prediction/Data (normalised 2-jet cross section)
(13 TeV)
-1
35.9 fb
Figure 3: Ratios of the normalized inclusive 2-jet distributions for thePH-2J+PYTHIA8,PH-3J+ PYTHIA8, andPH-2J+HERWIG++ predictions to data as a function of the azimuthal separation of the two leading jets∆φ12, for all the pmaxT regions. The solid band indicates the total experi-mental uncertainty and the error bars on the MC points represent the statistical uncertainty of the simulated data. The PH-3J prediction is not shown for the highest bin in pmaxT because of the large statistical fluctuations.
scale, PDF, and αSuncertainties, because of the larger event sample. For the estimation of the PS uncertaintyPYTHIA8 is utilized. The following four sources of theoretical uncertainties are analyzed:
• The uncertainties due to the renormalization and factorization scales of the hard pro-cess are evaluated by varying the default choice µr =µf = pTof the underlying Born configuration between pT/2 and 2pT. The envelope of the following seven combina-tions is considered: (µr/pT, µf/pT) = (0.5, 0.5),(0.5, 1), (1, 0.5),(1, 1), (1, 2),(2, 1), and(2, 2).
• The PDF uncertainties are evaluated according to the prescriptions for the NNPDF3.0 NLO PDF set. There are 100 replicas of the NNPDF3.0 NLO PDF set. For each replica the cross section is calculated and the uncertainty is taken as the envelope from all the replicas.
• The uncertainty due to the value of the strong coupling αSis obtained by a variation of αS(mZ)by±0.001, as recommended in Ref. [45].
• The uncertainty due to PS is evaluated with thePYTHIA8 event generator by varying the default renormalization scale choice µr = pT of the branching in initial state (ISR) and final state radiation (FSR) between µr/2 and 2µr. The envelope of the following nine combinations is considered: (ISR µr/pT , FSR µr/pT) = (0.5, 0.5), (0.5, 1),(0.5, 2),(1, 0.5),(1, 1),(1, 2),(2, 0.5),(2, 1), and(2, 2).
The nonperturbative contributions (MPI and hadronization) are included in the calculations above. The uncertainty from these contributions are estimated from the different choices of the
[deg] 12 φ ∆ ] -1 [deg 12 φ∆ d σ d σ 1 0.04 0.06 0.08 0.1 0.12 0.14 0.16 0.18 170 171 172 173 174 175 176 177 178 179 180 CMS (13 TeV) -1 35.9 fb < 300 GeV max T 200 < p < 600 GeV max T 500 < p < 1000 GeV max T 800 < p R=0.4 T anti-k Inclusive 3-jet
Herwig++ CUETHppS1 (solid lines) PYTHIA8 CUETP8M1 (dotted lines)
[deg] 12 φ ∆ ] -1 [deg 12 φ∆ d σ d σ 1 0.04 0.06 0.08 0.1 0.12 0.14 0.16 0.18 170 171 172 173 174 175 176 177 178 179 180 CMS (13 TeV) -1 35.9 fb < 400 GeV max T 300 < p < 700 GeV max T 600 < p < 1200 GeV max T 1000 < p R=0.4 T anti-k Inclusive 3-jet
Herwig++ CUETHppS1 (solid lines) PYTHIA8 CUETP8M1 (dotted lines)
Figure 4: Normalized inclusive 3-jet distributions as a function of the azimuthal separation of the two leading jets∆φ12for different pmaxT regions. The data are represented by the markers and the theory by histograms. Overlaid with the data are predictions from the HERWIG++ event generator (solid lines) andPYTHIA8 (dotted lines). The total experimental uncertainty is depicted as error bars on the measurement.
[deg] 12 φ ∆ 0.9 1 1.1 1.2 < 400 GeV max T 300 < p [deg] 12 φ ∆ 0.9 1 1.1 1.2 < 300 GeV max T 200 < p [deg] 12 φ ∆ 0.9 1 1.1 1.2 < 600 GeV max T 500 < p [deg] 12 φ ∆ 0.9 1 1.1 1.2 < 500 GeV max T 400 < p [deg] 12 φ ∆ 0.9 1 1.1 1.2 < 800 GeV max T 700 < p [deg] 12 φ ∆ 0.9 1 1.1 1.2 < 700 GeV max T 600 < p [deg] 12 φ ∆ 0.9 1 1.1 1.2 170 171 172 173 174 175 176 177 178 179 180 < 1200 GeV max T 1000 < p [deg] 12 φ ∆ 0.9 1 1.1 1.2 < 1000 GeV max T 800 < p [deg] 12 φ ∆ 0.9 1 1.1 1.2 170 171 172 173 174 175 176 177 178 179 180 > 1200 GeV max T p R=0.4 T k − anti Inclusive 3-jet Total exp. unc.
Herwig++ CUETHppS1 MadGraph + PYTHIA8
PYTHIA8 CUETP8M1 PYTHIA8 MPI: off, HAD: off
CMS
Prediction/Data (normalised 3-jet cross section)
(13 TeV)
-1
35.9 fb
Figure 5: Ratios of the normalized inclusive 3-jet distributions for thePYTHIA 8, HERWIG++, and MADGRAPH+PYTHIA8 predictions to data as a function of the azimuthal separation of the two leading jets∆φ12, for all the pmaxT regions. The solid band indicates the total experimental uncertainty and the error bars on the MC points represent the statistical uncertainty of the simulated data.
UE tune and found to be negligible.
[deg] 12 φ ∆ 0.9 1 1.1 1.2 < 400 GeV max T 300 < p [deg] 12 φ ∆ 0.9 1 1.1 1.2 < 300 GeV max T 200 < p [deg] 12 φ ∆ 0.9 1 1.1 1.2 < 600 GeV max T 500 < p [deg] 12 φ ∆ 0.9 1 1.1 1.2 < 500 GeV max T 400 < p [deg] 12 φ ∆ 0.9 1 1.1 1.2 < 800 GeV max T 700 < p [deg] 12 φ ∆ 0.9 1 1.1 1.2 < 700 GeV max T 600 < p [deg] 12 φ ∆ 0.9 1 1.1 1.2 170 171 172 173 174 175 176 177 178 179 180 < 1200 GeV max T 1000 < p [deg] 12 φ ∆ 0.9 1 1.1 1.2 < 1000 GeV max T 800 < p [deg] 12 φ ∆ 0.9 1 1.1 1.2 170 171 172 173 174 175 176 177 178 179 180 > 1200 GeV max T p R=0.4 T k − anti Inclusive 3-jet Total exp. unc.
PH-2J + PYTHIA8 PH-3J + PYTHIA8 PH-2J + Herwig++
CMS
Prediction/Data (normalised 3-jet cross section)
(13 TeV)
-1
35.9 fb
Figure 6: Ratios of the normalized inclusive 3-jet distributions for thePH-2J+PYTHIA8,PH-3J+ PYTHIA8, andPH-2J+HERWIG++ predictions to data as a function of the azimuthal separation of the two leading jets∆φ12, for all pmaxT regions. The solid band indicates the total experimental uncertainty and the error bars on the MC points represent the statistical uncertainty of the simulated data. The PH-3J prediction is not shown for the highest bin in pmaxT because of the large statistical fluctuations.
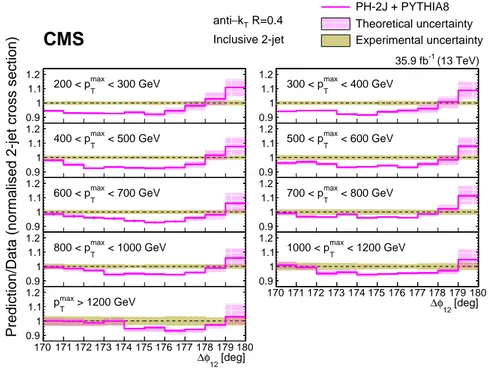
order of magnitude larger than the rest of the sources near∆φ12 = 180◦. On the other hand, for the normalized inclusive 3-jet distributions, the main contributions come from PS and PDF uncertainties. The predictions fromPH-2J+PYTHIA8 andPH-2J+HERWIG++ (Fig. 3) show the differences from using different PS models together with different matching procedures. Figs. 7(8) show the ratios of thePH-2Jpredictions to data for the normalized inclusive 2(3)-jet distributions for the different pmaxT regions. The solid beige band indicates the total experimen-tal uncertainty, and the hatched band represents the toexperimen-tal theoretical uncertainty.
For the inclusive 2-jet distributions, the theoretical uncertainty is larger than the experimental one in the region close to∆φ12 = 180◦ (Fig. 7). This is because the contribution from PS dom-inates in this region, and its uncertainty is large. For the inclusive 3-jet distributions (Fig. 8), the theoretical uncertainty is smaller in the region close to 180◦. In this case, the region close to 180◦ is not filled by the partons from the PS, but by the third parton fromPH-2J, leading to a smaller PS uncertainty.
7
Summary
Measurements of the normalized inclusive 2- and 3-jet distributions as a function of the az-imuthal separation∆φ12 between the two jets with the highest transverse momentum pT, in the collinear back-to-back region, are presented for several pmaxT ranges of the leading jet. The measurements are performed using data collected with the CMS experiment at the LHC, cor-responding to an integrated luminosity of 35.9 fb−1of p p collisions at a center-of-mass energy of 13 TeV.
[deg] 12 φ ∆ 0.9 1 1.1 1.2 < 400 GeV max T 300 < p [deg] 12 φ ∆ 0.9 1 1.1 1.2 < 300 GeV max T 200 < p [deg] 12 φ ∆ 0.9 1 1.1 1.2 < 600 GeV max T 500 < p [deg] 12 φ ∆ 0.9 1 1.1 1.2 < 500 GeV max T 400 < p [deg] 12 φ ∆ 0.9 1 1.1 1.2 < 800 GeV max T 700 < p [deg] 12 φ ∆ 0.9 1 1.1 1.2 < 700 GeV max T 600 < p [deg] 12 φ ∆ 0.9 1 1.1 1.2 170 171 172 173 174 175 176 177 178 179 180 < 1200 GeV max T 1000 < p [deg] 12 φ ∆ 0.9 1 1.1 1.2 < 1000 GeV max T 800 < p [deg] 12 φ ∆ 0.9 1 1.1 1.2 170 171 172 173 174 175 176 177 178 179 180 > 1200 GeV max T p R=0.4 T k − anti Inclusive 2-jet PH-2J + PYTHIA8 Theoretical uncertainty Experimental uncertainty
CMS
Prediction/Data (normalised 2-jet cross section)
(13 TeV)
-1
35.9 fb
Figure 7: Ratios of the normalized inclusive 2-jet distributions for thePH-2J + PYTHIA 8
pre-dictions to data as a function of the azimuthal separation of the two leading jets ∆φ12, for all pmaxT regions. The solid beige band indicates the total experimental uncertainty and the hatched band represents the total theoretical uncertainty.
[deg] 12 φ ∆ 0.9 1 1.1 1.2 < 400 GeV max T 300 < p [deg] 12 φ ∆ 0.9 1 1.1 1.2 < 300 GeV max T 200 < p [deg] 12 φ ∆ 0.9 1 1.1 1.2 < 600 GeV max T 500 < p [deg] 12 φ ∆ 0.9 1 1.1 1.2 < 500 GeV max T 400 < p [deg] 12 φ ∆ 0.9 1 1.1 1.2 < 800 GeV max T 700 < p [deg] 12 φ ∆ 0.9 1 1.1 1.2 < 700 GeV max T 600 < p [deg] 12 φ ∆ 0.9 1 1.1 1.2 170 171 172 173 174 175 176 177 178 179 180 < 1200 GeV max T 1000 < p [deg] 12 φ ∆ 0.9 1 1.1 1.2 < 1000 GeV max T 800 < p [deg] 12 φ ∆ 0.9 1 1.1 1.2 170 171 172 173 174 175 176 177 178 179 180 > 1200 GeV max T p R=0.4 T k − anti Inclusive 3-jet PH-2J + PYTHIA8 Theoretical uncertainty Experimental uncertainty
CMS
Prediction/Data (normalised 3-jet cross section)
(13 TeV)
-1
35.9 fb
Figure 8: Ratios of the normalized inclusive 3-jet distributions for thePH-2J+PYTHIA8 predic-tions to data as a function of the azimuthal separation of the two leading jets∆φ12, for all pmaxT regions. The solid beige band indicates the total experimental uncertainty, the hatched band represents the total theoretical uncertainty.
The measured∆φ12distributions generally agree with predictions fromPYTHIA8,HERWIG++, MADGRAPH + PYTHIA 8, PH-2J + HERWIG++, and POWHEG (PH-2J and PH-3J) matched to
PYTHIA 8. Discrepancies between the measurement and theoretical predictions are as large as
15%, mainly in the region 177◦ < ∆φ12 <180◦. The predictions agree better with the measure-ments for larger pmaxT and smaller∆φ12, where the contribution of resummation effects becomes smaller. The 2- and 3-jet measurements are not simultaneously described by any of models. The tree-level multijet event generator MADGRAPH in combination with PYTHIA 8 for show-ering, hadronization, and multiparton interactions, shows deviations from the measured∆φ12 for the inclusive 2-jet case, and even larger deviations for the 3-jet case. ThePYTHIA8 andHER
-WIG++ predictions show deviations (up to 10%) for the 2-jet inclusive distributions, whereas
their predictions are in reasonable agreement with the inclusive 3-jet distributions.
The next-to-leading-orderPH-2J+PYTHIA8 prediction does not describe the data and a differ-ent trend compared toPYTHIA8 andHERWIG++ towards∆φ12 =180◦ is observed. ThePH-3J
+ PYTHIA 8 predictions agree with the measurements except for the last bin in the low pmaxT intervals. ThePH-2J+HERWIG++ prediction agrees well with the measurement in the highest pmaxT ranges. For the inclusive 3-jet case,PH-2J+PYTHIA8 performs similarly toPYTHIA8 and HERWIG++ in the whole∆φ12range for high pmaxT intervals. MADGRAPH+PYTHIA8, PH-3J+ PYTHIA8, andPH-2J+HERWIG++ show deviations from the measurements of up to 15%.
The measurement of correlations for collinear back–to–back dijet configurations probes the multiple scales involved in the event and, therefore, the differences observed between predic-tions and the measurements illustrate the importance of improving the models of soft parton radiation accompanying the hard process.
Acknowledgments
We congratulate our colleagues in the CERN accelerator departments for the excellent perfor-mance of the LHC and thank the technical and administrative staffs at CERN and at other CMS institutes for their contributions to the success of the CMS effort. In addition, we gratefully acknowledge the computing centers and personnel of the Worldwide LHC Computing Grid for delivering so effectively the computing infrastructure essential to our analyses. Finally, we acknowledge the enduring support for the construction and operation of the LHC and the CMS detector provided by the following funding agencies: BMBWF and FWF (Austria); FNRS and FWO (Belgium); CNPq, CAPES, FAPERJ, FAPERGS, and FAPESP (Brazil); MES (Bulgaria); CERN; CAS, MoST, and NSFC (China); COLCIENCIAS (Colombia); MSES and CSF (Croa-tia); RPF (Cyprus); SENESCYT (Ecuador); MoER, ERC IUT, and ERDF (Estonia); Academy of Finland, MEC, and HIP (Finland); CEA and CNRS/IN2P3 (France); BMBF, DFG, and HGF (Germany); GSRT (Greece); NKFIA (Hungary); DAE and DST (India); IPM (Iran); SFI (Ireland); INFN (Italy); MSIP and NRF (Republic of Korea); MES (Latvia); LAS (Lithuania); MOE and UM (Malaysia); BUAP, CINVESTAV, CONACYT, LNS, SEP, and UASLP-FAI (Mexico); MOS (Mon-tenegro); MBIE (New Zealand); PAEC (Pakistan); MSHE and NSC (Poland); FCT (Portugal); JINR (Dubna); MON, RosAtom, RAS, RFBR, and NRC KI (Russia); MESTD (Serbia); SEIDI, CPAN, PCTI, and FEDER (Spain); MOSTR (Sri Lanka); Swiss Funding Agencies (Switzerland); MST (Taipei); ThEPCenter, IPST, STAR, and NSTDA (Thailand); TUBITAK and TAEK (Turkey); NASU and SFFR (Ukraine); STFC (United Kingdom); DOE and NSF (USA).
Individuals have received support from the Marie-Curie program and the European Research Council and Horizon 2020 Grant, contract No. 675440 (European Union); the Leventis Founda-tion; the A.P. Sloan FoundaFounda-tion; the Alexander von Humboldt FoundaFounda-tion; the Belgian Federal
Science Policy Office; the Fonds pour la Formation `a la Recherche dans l’Industrie et dans l’Agriculture (FRIA-Belgium); the Agentschap voor Innovatie door Wetenschap en Technolo-gie (IWT-Belgium); the F.R.S.-FNRS and FWO (Belgium) under the “Excellence of Science – EOS” – be.h project n. 30820817; the Beijing Municipal Science & Technology Commission, No. Z181100004218003; the Ministry of Education, Youth and Sports (MEYS) of the Czech Republic; the Lend ¨ulet (“Momentum”) Program and the J´anos Bolyai Research Scholarship of the Hun-garian Academy of Sciences, the New National Excellence Program ´UNKP, the NKFIA research grants 123842, 123959, 124845, 124850, and 125105 (Hungary); the Council of Science and In-dustrial Research, India; the HOMING PLUS program of the Foundation for Polish Science, cofinanced from European Union, Regional Development Fund, the Mobility Plus program of the Ministry of Science and Higher Education, the National Science Center (Poland), contracts Harmonia 2014/14/M/ST2/00428, Opus 2014/13/B/ST2/02543, 2014/15/B/ST2/03998, and 2015/19/B/ST2/02861, Sonata-bis 2012/07/E/ST2/01406; the National Priorities Research Program by Qatar National Research Fund; the Programa Estatal de Fomento de la Investi-gaci ´on Cient´ıfica y T´ecnica de Excelencia Mar´ıa de Maeztu, grant MDM-2015-0509 and the Programa Severo Ochoa del Principado de Asturias; the Thalis and Aristeia programmes co-financed by EU-ESF and the Greek NSRF; the Rachadapisek Sompot Fund for Postdoctoral Fellowship, Chulalongkorn University and the Chulalongkorn Academic into Its 2nd Century Project Advancement Project (Thailand); the Welch Foundation, contract C-1845; and the We-ston Havens Foundation (USA).
References
[1] D0 Collaboration, “Measurement of dijet azimuthal decorrelations at central rapidities in pp collisions at√s =1.96 TeV”, Phys. Rev. Lett. 94 (2005) 221801,
doi:10.1103/PhysRevLett.94.221801, arXiv:hep-ex/0409040.
[2] D0 Collaboration, “Measurement of the combined rapidity and pTdependence of dijet azimuthal decorrelations in pp collisions at√s=1.96 TeV”, Phys. Lett. B 721 (2013) 212,
doi:10.1016/j.physletb.2013.03.029, arXiv:1212.1842.
[3] ATLAS Collaboration, “Measurement of dijet azimuthal decorrelations in pp collisions at√ s =7 TeV”, Phys. Rev. Lett. 106 (2011) 172002,
doi:10.1103/PhysRevLett.106.172002, arXiv:1102.2696.
[4] CMS Collaboration, “Dijet azimuthal decorrelations in pp collisions at√s=7 TeV”, Phys. Rev. Lett. 106 (2011) 122003, doi:10.1103/PhysRevLett.106.122003, arXiv:1101.5029.
[5] CMS Collaboration, “Measurement of dijet azimuthal decorrelation in pp collisions at√ s =8 TeV”, Eur. Phys. J. C 76 (2016) 536,
doi:10.1140/epjc/s10052-016-4346-8, arXiv:1602.04384.
[6] CMS Collaboration, “Azimuthal correlations for inclusive 2-jet, 3-jet, and 4-jet events in pp collisions at√s =13 TeV”, Eur. Phys. J. C 78 (2018) 566,
doi:10.1140/epjc/s10052-018-6033-4, arXiv:1712.05471.
[7] S. Catani, M. Grazzini, and H. Sargsyan, “Azimuthal asymmetries in QCD hard scattering: infrared safe but divergent”, JHEP 06 (2017) 017,
doi:10.1007/JHEP06(2017)017, arXiv:1703.08468.
[8] S. Catani, M. Grazzini, and A. Torre, “Transverse-momentum resummation for heavy-quark hadroproduction”, Nucl. Phys. B 890 (2014) 518,
doi:10.1016/j.nuclphysb.2014.11.019, arXiv:1408.4564.
[9] A. Banfi, M. Dasgupta, and Y. Delenda, “Azimuthal decorrelations between QCD jets at all orders”, Phys. Lett. B 665 (2008) 86, doi:10.1016/j.physletb.2008.05.065,
arXiv:0804.3786.
[10] P. Sun, C. P. Yuan, and F. Yuan, “Soft gluon resummations in dijet azimuthal angular correlations in hadronic collisions”, Phys. Rev. Lett. 113 (2014) 232001,
doi:10.1103/PhysRevLett.113.232001, arXiv:1405.1105.
[11] P. Sun, C. P. Yuan, and F. Yuan, “Transverse momentum resummation for dijet correlation in hadronic collisions”, Phys. Rev. D 92 (2015) 094007,
doi:10.1103/PhysRevD.92.094007, arXiv:1506.06170.
[12] F. Hautmann and H. Jung, “Angular correlations in multi-jet final states from k-perpendicular - dependent parton showers”, JHEP 10 (2008) 113,
doi:10.1088/1126-6708/2008/10/113, arXiv:0805.1049.
[13] CMS Collaboration, “The CMS experiment at the CERN LHC”, JINST 03 (2008) S08004,
doi:10.1088/1748-0221/3/08/S08004.
[14] T. Sj ¨ostrand et al., “An introduction to PYTHIA 8.2”, Comput. Phys. Commun. 191 (2015) 159, doi:10.1016/j.cpc.2015.01.024, arXiv:1410.3012.
[15] M. B¨ahr et al., “Herwig++ physics and manual”, Eur. Phys. J. C 58 (2008) 639, doi:10.1140/epjc/s10052-008-0798-9, arXiv:0803.0883.
[16] B. Andersson, “The Lund model”, Camb. Monogr. Part. Phys. Nucl. Phys. Cosmol. 7 (1997) 1, doi:10.1016/0375-9474(87)90510-0.
[17] B. R. Webber, “A QCD model for jet fragmentation including soft gluon interference”, Nucl. Phys. B 238 (1984) 492, doi:10.1016/0550-3213(84)90333-X.
[18] CMS Collaboration, “Event generator tunes obtained from underlying event and multiparton scattering measurements”, Eur. Phys. J. C 76 (2016) 155,
doi:10.1140/epjc/s10052-016-3988-x, arXiv:1512.00815.
[19] NNPDF Collaboration, “Parton distributions with QED corrections”, Nucl. Phys. B 877 (2013) 290, doi:10.1016/j.nuclphysb.2013.10.010, arXiv:1308.0598.
[20] NNPDF Collaboration, “Unbiased global determination of parton distributions and their uncertainties at NNLO and at LO”, Nucl. Phys. B 855 (2012) 153,
doi:10.1016/j.nuclphysb.2011.09.024, arXiv:1107.2652.
[21] J. Pumplin et al., “New generation of parton distributions with uncertainties from global QCD analysis”, JHEP 07 (2002) 012, doi:10.1088/1126-6708/2002/07/012, arXiv:hep-ph/0201195.
[22] J. Alwall et al., “The automated computation of tree-level and next-to-leading order differential cross sections, and their matching to parton shower simulations”, JHEP 07 (2014) 079, doi:10.1007/JHEP07(2014)079, arXiv:1405.0301.
[23] J. Alwall et al., “Comparative study of various algorithms for the merging of parton showers and matrix elements in hadronic collisions”, Eur. Phys. J. C 53 (2008) 473,
doi:10.1140/epjc/s10052-007-0490-5, arXiv:0706.2569.
[24] P. Nason, “A new method for combining NLO QCD with shower Monte Carlo algorithms”, JHEP 11 (2004) 040, doi:10.1088/1126-6708/2004/11/040,
arXiv:hep-ph/0409146.
[25] S. Frixione, P. Nason, and C. Oleari, “Matching NLO QCD computations with parton shower simulations: the POWHEG method”, JHEP 11 (2007) 070,
doi:10.1088/1126-6708/2007/11/070, arXiv:0709.2092.
[26] S. Alioli, P. Nason, C. Oleari, and E. Re, “A general framework for implementing NLO calculations in shower Monte Carlo programs: the POWHEG BOX”, JHEP 06 (2010) 043, doi:10.1007/JHEP06(2010)043, arXiv:1002.2581.
[27] NNPDF Collaboration, “Parton distributions for the LHC Run II”, JHEP 04 (2015) 040, doi:10.1007/JHEP04(2015)040, arXiv:1410.8849.
[28] S. Alioli et al., “Jet pair production in POWHEG”, JHEP 11 (2011) 081, doi:10.1007/JHEP04(2011)081, arXiv:1012.3380.
[29] A. Kardos, P. Nason, and C. Oleari, “Three-jet production in POWHEG”, JHEP 04 (2014) 043, doi:10.1007/JHEP04(2014)043, arXiv:1402.4001.
[30] K. Hamilton, P. Nason, C. Oleari, and G. Zanderighi, “Merging H/W/Z + 0 and 1 jet at NLO with no merging scale: a path to parton shower + NNLO matching”, JHEP 05 (2013) 082, doi:10.1007/JHEP05(2013)082, arXiv:1212.4504.
[31] K. Hamilton, P. Nason, and G. Zanderighi, “MINLO: multi-scale improved NLO”, JHEP
10(2012) 155, doi:10.1007/JHEP10(2012)155, arXiv:1206.3572.
[32] GEANT4 Collaboration, “GEANT4—a simulation toolkit”, Nucl. Instrum. Meth. A 506 (2003) 250, doi:10.1016/S0168-9002(03)01368-8.
[33] CMS Collaboration, “The CMS high level trigger”, Eur. Phys. J. C 46 (2006) 605,
doi:10.1140/epjc/s2006-02495-8, arXiv:hep-ex/0512077.
[34] CMS Collaboration, “The CMS trigger system”, JINST 12 (2017) P01020, doi:10.1088/1748-0221/12/01/P01020, arXiv:1609.02366.
[35] CMS Collaboration, “Particle-flow reconstruction and global event description with the CMS detector”, JINST 12 (2017) P10003, doi:10.1088/1748-0221/12/10/P10003, arXiv:1706.04965.
[36] M. Cacciari, G. P. Salam, and G. Soyez, “The anti-kTjet clustering algorithm”, JHEP 04 (2008) 063, doi:10.1088/1126-6708/2008/04/063, arXiv:0802.1189.
[37] M. Cacciari, G. P. Salam, and G. Soyez, “FastJet user manual”, Eur. Phys. J. C 72 (2012) 1896, doi:10.1140/epjc/s10052-012-1896-2, arXiv:1111.6097.
[38] CMS Collaboration, “Jet energy scale and resolution in the CMS experiment in pp collisions at 8 TeV”, JINST 12 (2017) P02014,
doi:10.1088/1748-0221/12/02/P02014, arXiv:1607.03663.
[39] M. Cacciari and G. P. Salam, “Pileup subtraction using jet areas”, Phys. Lett. B 659 (2008) 119, doi:10.1016/j.physletb.2007.09.077, arXiv:0707.1378.
[40] CMS Collaboration, “Pileup Jet Identification”, CMS Physics Analysis Summary CMS-PAS-JME-13-005, 2013.
[41] G. D’Agostini, “A multidimensional unfolding method based on Bayes’ theorem”, Nucl. Instrum. Meth. A 362 (1995) 487, doi:10.1016/0168-9002(95)00274-X.
[42] T. Adye, “Unfolding algorithms and tests using RooUnfold”, (2011). arXiv:1105.1160. [43] S. Schmitt, “TUnfold: an algorithm for correcting migration effects in high energy
physics”, JINST 7 (2012) T10003, doi:10.1088/1748-0221/7/10/T10003,
arXiv:1205.6201.
[44] S. Schmitt, “Data unfolding methods in high energy physics”, Eur. Phys. J. Web Conf. 137 (2017) 11008, doi:10.1051/epjconf/201713711008, arXiv:1611.01927.
[45] H.-L. Lai et al., “Uncertainty induced by QCD coupling in the CTEQ global analysis of parton distributions”, Phys. Rev. D 82 (2010) 054021,
A
The CMS Collaboration
Yerevan Physics Institute, Yerevan, Armenia A.M. Sirunyan, A. Tumasyan
Institut f ¨ur Hochenergiephysik, Wien, Austria
W. Adam, F. Ambrogi, E. Asilar, T. Bergauer, J. Brandstetter, E. Brondolin, M. Dragicevic, J. Er ¨o, A. Escalante Del Valle, M. Flechl, R. Fr ¨uhwirth1, V.M. Ghete, J. Hrubec, M. Jeitler1, N. Krammer, I. Kr¨atschmer, D. Liko, T. Madlener, I. Mikulec, N. Rad, H. Rohringer, J. Schieck1, R. Sch ¨ofbeck,
M. Spanring, D. Spitzbart, A. Taurok, W. Waltenberger, J. Wittmann, C.-E. Wulz1, M. Zarucki Institute for Nuclear Problems, Minsk, Belarus
V. Chekhovsky, V. Mossolov, J. Suarez Gonzalez Universiteit Antwerpen, Antwerpen, Belgium
E.A. De Wolf, D. Di Croce, X. Janssen, J. Lauwers, M. Pieters, M. Van De Klundert, H. Van Haevermaet, P. Van Mechelen, N. Van Remortel
Vrije Universiteit Brussel, Brussel, Belgium
S. Abu Zeid, F. Blekman, J. D’Hondt, I. De Bruyn, J. De Clercq, K. Deroover, G. Flouris, D. Lontkovskyi, S. Lowette, I. Marchesini, S. Moortgat, L. Moreels, Q. Python, K. Skovpen, S. Tavernier, W. Van Doninck, P. Van Mulders, I. Van Parijs
Universit´e Libre de Bruxelles, Bruxelles, Belgium
D. Beghin, B. Bilin, H. Brun, B. Clerbaux, G. De Lentdecker, H. Delannoy, B. Dorney, G. Fasanella, L. Favart, R. Goldouzian, A. Grebenyuk, A.K. Kalsi, T. Lenzi, J. Luetic, N. Postiau, E. Starling, L. Thomas, C. Vander Velde, P. Vanlaer, D. Vannerom, Q. Wang
Ghent University, Ghent, Belgium
T. Cornelis, D. Dobur, A. Fagot, M. Gul, I. Khvastunov2, D. Poyraz, C. Roskas, D. Trocino, M. Tytgat, W. Verbeke, B. Vermassen, M. Vit, N. Zaganidis
Universit´e Catholique de Louvain, Louvain-la-Neuve, Belgium
H. Bakhshiansohi, O. Bondu, S. Brochet, G. Bruno, P. David, C. Delaere, M. Delcourt, B. Francois, A. Giammanco, G. Krintiras, V. Lemaitre, A. Magitteri, A. Mertens, M. Musich, K. Piotrzkowski, A. Saggio, M. Vidal Marono, S. Wertz, J. Zobec
Centro Brasileiro de Pesquisas Fisicas, Rio de Janeiro, Brazil
F.L. Alves, G.A. Alves, L. Brito, G. Correia Silva, C. Hensel, A. Moraes, M.E. Pol, P. Rebello Teles Universidade do Estado do Rio de Janeiro, Rio de Janeiro, Brazil
E. Belchior Batista Das Chagas, W. Carvalho, J. Chinellato3, E. Coelho, E.M. Da Costa, G.G. Da Silveira4, D. De Jesus Damiao, C. De Oliveira Martins, S. Fonseca De Souza, H. Malbouisson, D. Matos Figueiredo, M. Melo De Almeida, C. Mora Herrera, L. Mundim, H. Nogima, W.L. Prado Da Silva, L.J. Sanchez Rosas, A. Santoro, A. Sznajder, M. Thiel, E.J. Tonelli Manganote3, F. Torres Da Silva De Araujo, A. Vilela Pereira
Universidade Estadual Paulistaa, Universidade Federal do ABCb, S˜ao Paulo, Brazil
S. Ahujaa, C.A. Bernardesa, L. Calligarisa, T.R. Fernandez Perez Tomeia, E.M. Gregoresb, P.G. Mercadanteb, S.F. Novaesa, SandraS. Padulaa, D. Romero Abadb
Institute for Nuclear Research and Nuclear Energy, Bulgarian Academy of Sciences, Sofia, Bulgaria
A. Aleksandrov, R. Hadjiiska, P. Iaydjiev, A. Marinov, M. Misheva, M. Rodozov, M. Shopova, G. Sultanov
University of Sofia, Sofia, Bulgaria A. Dimitrov, L. Litov, B. Pavlov, P. Petkov Beihang University, Beijing, China W. Fang5, X. Gao5, L. Yuan
Institute of High Energy Physics, Beijing, China
M. Ahmad, J.G. Bian, G.M. Chen, H.S. Chen, M. Chen, Y. Chen, C.H. Jiang, D. Leggat, H. Liao, Z. Liu, F. Romeo, S.M. Shaheen, A. Spiezia, J. Tao, C. Wang, Z. Wang, E. Yazgan, H. Zhang, J. Zhao
State Key Laboratory of Nuclear Physics and Technology, Peking University, Beijing, China Y. Ban, G. Chen, A. Levin, J. Li, L. Li, Q. Li, Y. Mao, S.J. Qian, D. Wang, Z. Xu
Tsinghua University, Beijing, China Y. Wang
Universidad de Los Andes, Bogota, Colombia
C. Avila, A. Cabrera, C.A. Carrillo Montoya, L.F. Chaparro Sierra, C. Florez,
C.F. Gonz´alez Hern´andez, M.A. Segura Delgado
University of Split, Faculty of Electrical Engineering, Mechanical Engineering and Naval Architecture, Split, Croatia
B. Courbon, N. Godinovic, D. Lelas, I. Puljak, T. Sculac University of Split, Faculty of Science, Split, Croatia Z. Antunovic, M. Kovac
Institute Rudjer Boskovic, Zagreb, Croatia
V. Brigljevic, D. Ferencek, K. Kadija, B. Mesic, A. Starodumov6, T. Susa University of Cyprus, Nicosia, Cyprus
M.W. Ather, A. Attikis, G. Mavromanolakis, J. Mousa, C. Nicolaou, F. Ptochos, P.A. Razis, H. Rykaczewski
Charles University, Prague, Czech Republic M. Finger7, M. Finger Jr.7
Escuela Politecnica Nacional, Quito, Ecuador E. Ayala
Universidad San Francisco de Quito, Quito, Ecuador E. Carrera Jarrin
Academy of Scientific Research and Technology of the Arab Republic of Egypt, Egyptian Network of High Energy Physics, Cairo, Egypt
A. Ellithi Kamel8, M.A. Mahmoud9,10, E. Salama10,11
National Institute of Chemical Physics and Biophysics, Tallinn, Estonia
A. Carvalho Antunes De Oliveira, R.K. Dewanjee, K. Ehataht, M. Kadastik, M. Raidal, C. Veelken
Department of Physics, University of Helsinki, Helsinki, Finland P. Eerola, H. Kirschenmann, J. Pekkanen, M. Voutilainen
Helsinki Institute of Physics, Helsinki, Finland
J. Havukainen, J.K. Heikkil¨a, T. J¨arvinen, V. Karim¨aki, R. Kinnunen, T. Lamp´en, K. Lassila-Perini, S. Laurila, S. Lehti, T. Lind´en, P. Luukka, T. M¨aenp¨a¨a, H. Siikonen, E. Tuominen, J. Tuominiemi
Lappeenranta University of Technology, Lappeenranta, Finland T. Tuuva
IRFU, CEA, Universit´e Paris-Saclay, Gif-sur-Yvette, France
M. Besancon, F. Couderc, M. Dejardin, D. Denegri, J.L. Faure, F. Ferri, S. Ganjour, A. Givernaud, P. Gras, G. Hamel de Monchenault, P. Jarry, C. Leloup, E. Locci, J. Malcles, G. Negro, J. Rander, A. Rosowsky, M. ¨O. Sahin, M. Titov
Laboratoire Leprince-Ringuet, Ecole polytechnique, CNRS/IN2P3, Universit´e Paris-Saclay, Palaiseau, France
A. Abdulsalam12, C. Amendola, I. Antropov, F. Beaudette, P. Busson, C. Charlot,
R. Granier de Cassagnac, I. Kucher, S. Lisniak, A. Lobanov, J. Martin Blanco, M. Nguyen, C. Ochando, G. Ortona, P. Pigard, R. Salerno, J.B. Sauvan, Y. Sirois, A.G. Stahl Leiton, A. Zabi, A. Zghiche
Universit´e de Strasbourg, CNRS, IPHC UMR 7178, Strasbourg, France
J.-L. Agram13, J. Andrea, D. Bloch, J.-M. Brom, E.C. Chabert, V. Cherepanov, C. Collard, E. Conte13, J.-C. Fontaine13, D. Gel´e, U. Goerlach, M. Jansov´a, A.-C. Le Bihan, N. Tonon, P. Van Hove
Centre de Calcul de l’Institut National de Physique Nucleaire et de Physique des Particules, CNRS/IN2P3, Villeurbanne, France
S. Gadrat
Universit´e de Lyon, Universit´e Claude Bernard Lyon 1, CNRS-IN2P3, Institut de Physique Nucl´eaire de Lyon, Villeurbanne, France
S. Beauceron, C. Bernet, G. Boudoul, N. Chanon, R. Chierici, D. Contardo, P. Depasse, H. El Mamouni, J. Fay, L. Finco, S. Gascon, M. Gouzevitch, G. Grenier, B. Ille, F. Lagarde, I.B. Laktineh, H. Lattaud, M. Lethuillier, L. Mirabito, A.L. Pequegnot, S. Perries, A. Popov14, V. Sordini, M. Vander Donckt, S. Viret, S. Zhang
Georgian Technical University, Tbilisi, Georgia A. Khvedelidze7
Tbilisi State University, Tbilisi, Georgia Z. Tsamalaidze7
RWTH Aachen University, I. Physikalisches Institut, Aachen, Germany
C. Autermann, L. Feld, M.K. Kiesel, K. Klein, M. Lipinski, M. Preuten, M.P. Rauch, C. Schomakers, J. Schulz, M. Teroerde, B. Wittmer, V. Zhukov14
RWTH Aachen University, III. Physikalisches Institut A, Aachen, Germany
A. Albert, D. Duchardt, M. Endres, M. Erdmann, T. Esch, R. Fischer, S. Ghosh, A. G ¨uth, T. Hebbeker, C. Heidemann, K. Hoepfner, H. Keller, S. Knutzen, L. Mastrolorenzo, M. Merschmeyer, A. Meyer, P. Millet, S. Mukherjee, T. Pook, M. Radziej, H. Reithler, M. Rieger, F. Scheuch, A. Schmidt, D. Teyssier
RWTH Aachen University, III. Physikalisches Institut B, Aachen, Germany
G. Fl ¨ugge, O. Hlushchenko, B. Kargoll, T. Kress, A. K ¨unsken, T. M ¨uller, A. Nehrkorn, A. Nowack, C. Pistone, O. Pooth, H. Sert, A. Stahl15
Deutsches Elektronen-Synchrotron, Hamburg, Germany
M. Aldaya Martin, T. Arndt, C. Asawatangtrakuldee, I. Babounikau, K. Beernaert, O. Behnke, U. Behrens, A. Berm ´udez Mart´ınez, D. Bertsche, A.A. Bin Anuar, K. Borras16, V. Botta, A. Campbell, P. Connor, C. Contreras-Campana, F. Costanza, V. Danilov, A. De Wit, M.M. Defranchis, C. Diez Pardos, D. Dom´ınguez Damiani, G. Eckerlin, T. Eichhorn, A. Elwood, E. Eren, E. Gallo17, A. Geiser, J.M. Grados Luyando, A. Grohsjean, P. Gunnellini, M. Guthoff, M. Haranko, A. Harb, J. Hauk, H. Jung, M. Kasemann, J. Keaveney, C. Kleinwort, J. Knolle, D. Kr ¨ucker, W. Lange, A. Lelek, T. Lenz, K. Lipka, W. Lohmann18, R. Mankel, I.-A. Melzer-Pellmann, A.B. Meyer, M. Meyer, M. Missiroli, G. Mittag, J. Mnich, V. Myronenko, S.K. Pflitsch, D. Pitzl, A. Raspereza, M. Savitskyi, P. Saxena, P. Sch ¨utze, C. Schwanenberger, R. Shevchenko, A. Singh, N. Stefaniuk, H. Tholen, A. Vagnerini, G.P. Van Onsem, R. Walsh, Y. Wen, K. Wichmann, C. Wissing, O. Zenaiev
University of Hamburg, Hamburg, Germany
R. Aggleton, S. Bein, L. Benato, A. Benecke, V. Blobel, M. Centis Vignali, T. Dreyer, E. Garutti, D. Gonzalez, J. Haller, A. Hinzmann, A. Karavdina, G. Kasieczka, R. Klanner, R. Kogler, N. Kovalchuk, S. Kurz, V. Kutzner, J. Lange, D. Marconi, J. Multhaup, M. Niedziela, D. Nowatschin, A. Perieanu, A. Reimers, O. Rieger, C. Scharf, P. Schleper, S. Schumann, J. Schwandt, J. Sonneveld, H. Stadie, G. Steinbr ¨uck, F.M. Stober, M. St ¨over, D. Troendle, A. Vanhoefer, B. Vormwald
Karlsruher Institut fuer Technologie, Karlsruhe, Germany
M. Akbiyik, C. Barth, M. Baselga, S. Baur, E. Butz, R. Caspart, T. Chwalek, F. Colombo, W. De Boer, A. Dierlamm, N. Faltermann, B. Freund, M. Giffels, M.A. Harrendorf, F. Hartmann15, S.M. Heindl, U. Husemann, F. Kassel15, I. Katkov14, S. Kudella, H. Mildner, S. Mitra, M.U. Mozer, Th. M ¨uller, M. Plagge, G. Quast, K. Rabbertz, M. Schr ¨oder, I. Shvetsov, G. Sieber, H.J. Simonis, R. Ulrich, S. Wayand, M. Weber, T. Weiler, S. Williamson, C. W ¨ohrmann, R. Wolf
Institute of Nuclear and Particle Physics (INPP), NCSR Demokritos, Aghia Paraskevi, Greece
G. Anagnostou, G. Daskalakis, T. Geralis, A. Kyriakis, D. Loukas, G. Paspalaki, I. Topsis-Giotis National and Kapodistrian University of Athens, Athens, Greece
G. Karathanasis, S. Kesisoglou, P. Kontaxakis, A. Panagiotou, N. Saoulidou, E. Tziaferi, K. Vellidis
National Technical University of Athens, Athens, Greece K. Kousouris, I. Papakrivopoulos, G. Tsipolitis
University of Io´annina, Io´annina, Greece
I. Evangelou, C. Foudas, P. Gianneios, P. Katsoulis, P. Kokkas, S. Mallios, N. Manthos, I. Papadopoulos, E. Paradas, J. Strologas, F.A. Triantis, D. Tsitsonis
MTA-ELTE Lend ¨ulet CMS Particle and Nuclear Physics Group, E ¨otv ¨os Lor´and University, Budapest, Hungary
M. Bart ´ok19, M. Csanad, N. Filipovic, P. Major, M.I. Nagy, G. Pasztor, O. Sur´anyi, G.I. Veres Wigner Research Centre for Physics, Budapest, Hungary
G. Bencze, C. Hajdu, D. Horvath20, ´A. Hunyadi, F. Sikler, T. ´A. V´ami, V. Veszpremi, G. Vesztergombi†
Institute of Nuclear Research ATOMKI, Debrecen, Hungary N. Beni, S. Czellar, J. Karancsi21, A. Makovec, J. Molnar, Z. Szillasi
Institute of Physics, University of Debrecen, Debrecen, Hungary P. Raics, Z.L. Trocsanyi, B. Ujvari
Indian Institute of Science (IISc), Bangalore, India S. Choudhury, J.R. Komaragiri, P.C. Tiwari
National Institute of Science Education and Research, HBNI, Bhubaneswar, India S. Bahinipati22, C. Kar, P. Mal, K. Mandal, A. Nayak23, D.K. Sahoo22, S.K. Swain Panjab University, Chandigarh, India
S. Bansal, S.B. Beri, V. Bhatnagar, S. Chauhan, R. Chawla, N. Dhingra, R. Gupta, A. Kaur, A. Kaur, M. Kaur, S. Kaur, R. Kumar, P. Kumari, M. Lohan, A. Mehta, K. Sandeep, S. Sharma, J.B. Singh, G. Walia
University of Delhi, Delhi, India
A. Bhardwaj, B.C. Choudhary, R.B. Garg, M. Gola, S. Keshri, Ashok Kumar, S. Malhotra, M. Naimuddin, P. Priyanka, K. Ranjan, Aashaq Shah, R. Sharma
Saha Institute of Nuclear Physics, HBNI, Kolkata, India
R. Bhardwaj24, M. Bharti, R. Bhattacharya, S. Bhattacharya, U. Bhawandeep24, D. Bhowmik, S. Dey, S. Dutt24, S. Dutta, S. Ghosh, K. Mondal, S. Nandan, A. Purohit, P.K. Rout, A. Roy, S. Roy Chowdhury, S. Sarkar, M. Sharan, B. Singh, S. Thakur24
Indian Institute of Technology Madras, Madras, India P.K. Behera
Bhabha Atomic Research Centre, Mumbai, India
R. Chudasama, D. Dutta, V. Jha, V. Kumar, P.K. Netrakanti, L.M. Pant, P. Shukla Tata Institute of Fundamental Research-A, Mumbai, India
T. Aziz, M.A. Bhat, S. Dugad, G.B. Mohanty, N. Sur, B. Sutar, RavindraKumar Verma Tata Institute of Fundamental Research-B, Mumbai, India
S. Banerjee, S. Bhattacharya, S. Chatterjee, P. Das, M. Guchait, Sa. Jain, S. Karmakar, S. Kumar, M. Maity25, G. Majumder, K. Mazumdar, N. Sahoo, T. Sarkar25
Indian Institute of Science Education and Research (IISER), Pune, India
S. Chauhan, S. Dube, V. Hegde, A. Kapoor, K. Kothekar, S. Pandey, A. Rane, S. Sharma Institute for Research in Fundamental Sciences (IPM), Tehran, Iran
S. Chenarani26, E. Eskandari Tadavani, S.M. Etesami26, M. Khakzad, M. Mohammadi
Na-jafabadi, M. Naseri, F. Rezaei Hosseinabadi, B. Safarzadeh27, M. Zeinali
University College Dublin, Dublin, Ireland M. Felcini, M. Grunewald
INFN Sezione di Baria, Universit`a di Barib, Politecnico di Baric, Bari, Italy
M. Abbresciaa,b, C. Calabriaa,b, A. Colaleoa, D. Creanzaa,c, L. Cristellaa,b, N. De Filippisa,c, M. De Palmaa,b, A. Di Florioa,b, F. Erricoa,b, L. Fiorea, A. Gelmia,b, G. Iasellia,c, S. Lezkia,b, G. Maggia,c, M. Maggia, G. Minielloa,b, S. Mya,b, S. Nuzzoa,b, A. Pompilia,b, G. Pugliesea,c,
R. Radognaa, A. Ranieria, A. Sharmaa, L. Silvestrisa,15, R. Vendittia, P. Verwilligena, G. Zitoa INFN Sezione di Bolognaa, Universit`a di Bolognab, Bologna, Italy
G. Abbiendia, C. Battilanaa,b, D. Bonacorsia,b, L. Borgonovia,b, S. Braibant-Giacomellia,b, R. Campaninia,b, P. Capiluppia,b, A. Castroa,b, F.R. Cavalloa, S.S. Chhibraa,b, C. Cioccaa, G. Codispotia,b, M. Cuffiania,b, G.M. Dallavallea, F. Fabbria, A. Fanfania,b, P. Giacomellia,
C. Grandia, L. Guiduccia,b, F. Iemmia,b, S. Marcellinia, G. Masettia, A. Montanaria, F.L. Navarriaa,b, A. Perrottaa, F. Primaveraa,b,15, A.M. Rossia,b, T. Rovellia,b, G.P. Sirolia,b, N. Tosia
INFN Sezione di Cataniaa, Universit`a di Cataniab, Catania, Italy S. Albergoa,b, A. Di Mattiaa, R. Potenzaa,b, A. Tricomia,b, C. Tuvea,b INFN Sezione di Firenzea, Universit`a di Firenzeb, Firenze, Italy
G. Barbaglia, K. Chatterjeea,b, V. Ciullia,b, C. Civininia, R. D’Alessandroa,b, E. Focardia,b, G. Latino, P. Lenzia,b, M. Meschinia, S. Paolettia, L. Russoa,28, G. Sguazzonia, D. Stroma, L. Viliania
INFN Laboratori Nazionali di Frascati, Frascati, Italy L. Benussi, S. Bianco, F. Fabbri, D. Piccolo
INFN Sezione di Genovaa, Universit`a di Genovab, Genova, Italy F. Ferroa, F. Raveraa,b, E. Robuttia, S. Tosia,b
INFN Sezione di Milano-Bicoccaa, Universit`a di Milano-Bicoccab, Milano, Italy
A. Benagliaa, A. Beschib, L. Brianzaa,b, F. Brivioa,b, V. Cirioloa,b,15, S. Di Guidaa,d,15, M.E. Dinardoa,b, S. Fiorendia,b, S. Gennaia, A. Ghezzia,b, P. Govonia,b, M. Malbertia,b, S. Malvezzia, A. Massironia,b, D. Menascea, L. Moronia, M. Paganonia,b, D. Pedrinia, S. Ragazzia,b, T. Tabarelli de Fatisa,b
INFN Sezione di Napolia, Universit`a di Napoli ’Federico II’b, Napoli, Italy, Universit`a della Basilicatac, Potenza, Italy, Universit`a G. Marconid, Roma, Italy
S. Buontempoa, N. Cavalloa,c, A. Di Crescenzoa,b, F. Fabozzia,c, F. Fiengaa, G. Galatia,
A.O.M. Iorioa,b, W.A. Khana, L. Listaa, S. Meolaa,d,15, P. Paoluccia,15, C. Sciaccaa,b, E. Voevodinaa,b
INFN Sezione di Padova a, Universit`a di Padova b, Padova, Italy, Universit`a di Trento c, Trento, Italy
P. Azzia, N. Bacchettaa, D. Biselloa,b, A. Bolettia,b, A. Bragagnolo, R. Carlina,b, P. Checchiaa, M. Dall’Ossoa,b, P. De Castro Manzanoa, T. Dorigoa, U. Dossellia, F. Gasparinia,b, U. Gasparinia,b, A. Gozzelinoa, S. Lacapraraa, P. Lujan, M. Margonia,b, A.T. Meneguzzoa,b,
P. Ronchesea,b, R. Rossina,b, F. Simonettoa,b, A. Tiko, E. Torassaa, M. Zanettia,b, P. Zottoa,b, G. Zumerlea,b
INFN Sezione di Paviaa, Universit`a di Paviab, Pavia, Italy
A. Braghieria, A. Magnania, P. Montagnaa,b, S.P. Rattia,b, V. Rea, M. Ressegottia,b, C. Riccardia,b, P. Salvinia, I. Vaia,b, P. Vituloa,b
INFN Sezione di Perugiaa, Universit`a di Perugiab, Perugia, Italy
L. Alunni Solestizia,b, M. Biasinia,b, G.M. Bileia, C. Cecchia,b, D. Ciangottinia,b, L. Fan `oa,b, P. Laricciaa,b, E. Manonia, G. Mantovania,b, V. Mariania,b, M. Menichellia, A. Rossia,b, A. Santocchiaa,b, D. Spigaa
INFN Sezione di Pisaa, Universit`a di Pisab, Scuola Normale Superiore di Pisac, Pisa, Italy K. Androsova, P. Azzurria, G. Bagliesia, L. Bianchinia, T. Boccalia, L. Borrello, R. Castaldia, M.A. Cioccia,b, R. Dell’Orsoa, G. Fedia, L. Gianninia,c, A. Giassia, M.T. Grippoa, F. Ligabuea,c, E. Mancaa,c, G. Mandorlia,c, A. Messineoa,b, F. Pallaa, A. Rizzia,b, P. Spagnoloa, R. Tenchinia,
G. Tonellia,b, A. Venturia, P.G. Verdinia
INFN Sezione di Romaa, Sapienza Universit`a di Romab, Rome, Italy
S. Gellia,b, E. Longoa,b, B. Marzocchia,b, P. Meridiania, G. Organtinia,b, F. Pandolfia, R. Paramattia,b, F. Preiatoa,b, S. Rahatloua,b, C. Rovellia, F. Santanastasioa,b
INFN Sezione di Torino a, Universit`a di Torino b, Torino, Italy, Universit`a del Piemonte Orientalec, Novara, Italy
N. Amapanea,b, R. Arcidiaconoa,c, S. Argiroa,b, M. Arneodoa,c, N. Bartosika, R. Bellana,b, C. Biinoa, N. Cartigliaa, F. Cennaa,b, S. Cometti, M. Costaa,b, R. Covarellia,b, N. Demariaa, B. Kiania,b, C. Mariottia, S. Masellia, E. Migliorea,b, V. Monacoa,b, E. Monteila,b, M. Montenoa, M.M. Obertinoa,b, L. Pachera,b, N. Pastronea, M. Pelliccionia, G.L. Pinna Angionia,b, A. Romeroa,b, M. Ruspaa,c, R. Sacchia,b, K. Shchelinaa,b, V. Solaa, A. Solanoa,b, D. Soldi, A. Staianoa
INFN Sezione di Triestea, Universit`a di Triesteb, Trieste, Italy
S. Belfortea, V. Candelisea,b, M. Casarsaa, F. Cossuttia, G. Della Riccaa,b, F. Vazzolera,b, A. Zanettia
Kyungpook National University, Daegu, Korea
D.H. Kim, G.N. Kim, M.S. Kim, J. Lee, S. Lee, S.W. Lee, C.S. Moon, Y.D. Oh, S. Sekmen, D.C. Son, Y.C. Yang
Chonnam National University, Institute for Universe and Elementary Particles, Kwangju, Korea
H. Kim, D.H. Moon, G. Oh
Hanyang University, Seoul, Korea J. Goh, T.J. Kim
Korea University, Seoul, Korea
S. Cho, S. Choi, Y. Go, D. Gyun, S. Ha, B. Hong, Y. Jo, K. Lee, K.S. Lee, S. Lee, J. Lim, S.K. Park, Y. Roh
Sejong University, Seoul, Korea H.S. Kim
Seoul National University, Seoul, Korea
J. Almond, J. Kim, J.S. Kim, H. Lee, K. Lee, K. Nam, S.B. Oh, B.C. Radburn-Smith, S.h. Seo, U.K. Yang, H.D. Yoo, G.B. Yu
University of Seoul, Seoul, Korea
D. Jeon, H. Kim, J.H. Kim, J.S.H. Lee, I.C. Park Sungkyunkwan University, Suwon, Korea Y. Choi, C. Hwang, J. Lee, I. Yu
Vilnius University, Vilnius, Lithuania V. Dudenas, A. Juodagalvis, J. Vaitkus
National Centre for Particle Physics, Universiti Malaya, Kuala Lumpur, Malaysia
I. Ahmed, Z.A. Ibrahim, M.A.B. Md Ali29, F. Mohamad Idris30, W.A.T. Wan Abdullah,
M.N. Yusli, Z. Zolkapli
Centro de Investigacion y de Estudios Avanzados del IPN, Mexico City, Mexico
H. Castilla-Valdez, E. De La Cruz-Burelo, M.C. Duran-Osuna, I. Heredia-De La Cruz31, R. Lopez-Fernandez, J. Mejia Guisao, R.I. Rabadan-Trejo, G. Ramirez-Sanchez, R Reyes-Almanza, A. Sanchez-Hernandez
Universidad Iberoamericana, Mexico City, Mexico
S. Carrillo Moreno, C. Oropeza Barrera, F. Vazquez Valencia Benemerita Universidad Autonoma de Puebla, Puebla, Mexico J. Eysermans, I. Pedraza, H.A. Salazar Ibarguen, C. Uribe Estrada Universidad Aut ´onoma de San Luis Potos´ı, San Luis Potos´ı, Mexico A. Morelos Pineda
University of Auckland, Auckland, New Zealand D. Krofcheck
University of Canterbury, Christchurch, New Zealand S. Bheesette, P.H. Butler
National Centre for Physics, Quaid-I-Azam University, Islamabad, Pakistan
A. Ahmad, M. Ahmad, M.I. Asghar, Q. Hassan, H.R. Hoorani, A. Saddique, M.A. Shah, M. Shoaib, M. Waqas
National Centre for Nuclear Research, Swierk, Poland
H. Bialkowska, M. Bluj, B. Boimska, T. Frueboes, M. G ´orski, M. Kazana, K. Nawrocki, M. Szleper, P. Traczyk, P. Zalewski
Institute of Experimental Physics, Faculty of Physics, University of Warsaw, Warsaw, Poland K. Bunkowski, A. Byszuk32, K. Doroba, A. Kalinowski, M. Konecki, J. Krolikowski, M. Misiura, M. Olszewski, A. Pyskir, M. Walczak
Laborat ´orio de Instrumenta¸c˜ao e F´ısica Experimental de Part´ıculas, Lisboa, Portugal
P. Bargassa, C. Beir˜ao Da Cruz E Silva, A. Di Francesco, P. Faccioli, B. Galinhas, M. Gallinaro, J. Hollar, N. Leonardo, L. Lloret Iglesias, M.V. Nemallapudi, J. Seixas, G. Strong, O. Toldaiev, D. Vadruccio, J. Varela
Joint Institute for Nuclear Research, Dubna, Russia
A. Golunov, I. Golutvin, V. Karjavin, V. Korenkov, G. Kozlov, A. Lanev, A. Malakhov, V. Matveev33,34, V.V. Mitsyn, P. Moisenz, V. Palichik, V. Perelygin, S. Shmatov, S. Shulha, V. Smirnov, V. Trofimov, B.S. Yuldashev35, A. Zarubin, V. Zhiltsov
Petersburg Nuclear Physics Institute, Gatchina (St. Petersburg), Russia
V. Golovtsov, Y. Ivanov, V. Kim36, E. Kuznetsova37, P. Levchenko, V. Murzin, V. Oreshkin, I. Smirnov, D. Sosnov, V. Sulimov, L. Uvarov, S. Vavilov, A. Vorobyev
Institute for Nuclear Research, Moscow, Russia
Yu. Andreev, A. Dermenev, S. Gninenko, N. Golubev, A. Karneyeu, M. Kirsanov, N. Krasnikov, A. Pashenkov, D. Tlisov, A. Toropin
Institute for Theoretical and Experimental Physics, Moscow, Russia
V. Epshteyn, V. Gavrilov, N. Lychkovskaya, V. Popov, I. Pozdnyakov, G. Safronov, A. Spiridonov, A. Stepennov, V. Stolin, M. Toms, E. Vlasov, A. Zhokin
Moscow Institute of Physics and Technology, Moscow, Russia T. Aushev
National Research Nuclear University ’Moscow Engineering Physics Institute’ (MEPhI), Moscow, Russia