ISSN 1450-2267 Vol.29 No.2 (2012), pp. 222-232 © EuroJournals Publishing, Inc. 2012
http://www.europeanjournalofsocialsciences.com
The Effects of the Image of Destination on Tourist
Satisfaction and Loyalty: The Case of Cappadocia
Suzan Çoban
Ph.D, Department of Business Administration Faculty of Economics and Administrative Sciences
University of Nevşehir, Nevşehir, Turkey
E-mail: [email protected] Fax: +90-384-215 20 10
Abstract
The purpose of this study is to determine the impact of the destination image on satisfaction and loyalty. The destination image in the study has been examined as cognitive and emotional image and has been investigated the effect of both factors on the components of satisfaction and loyalty. The sample consists of 170 tourists who visited Cappadocia. With this aspect, the work has got differences among similar studies. The survey has been obtained from the region adaptation of the scale used in studies with similar characteristics. The factor and regression analysis was used for the data analysis. According to the results of factor analysis, the cognitive image has been composed of six factors. According to the results of regression analysis, cognitive and emotional image affects satisfaction. The most important factors are the possibilities of tourist attractiveness and touristy substructures-access. Emotional image in the same way has an effect on satisfaction. Tourist attractiveness, having multi-faceted impact, in part affects satisfaction and also affects loyalty. Satisfaction has a significant effect on loyalty. At the conclusion, the author makes suggestions about enriching the tourist appeal and the corrective work to be done. There are two constraints of the study. First, a single language (English) is used to prepare a questionnaire and the second it covers only tourists who travel with tourist guides.
Keywords: Destination Image, Tourist Satisfaction, Loyalty, Cappadocia. JEL Classification Codes: M30, M31
1. Introduction
It is very important to determine the destination image while taking decisions for strategic marketing of tourism destinations. Because it is assumed that it will result in a positive image of a destination, loyalty to tourist destinations and satisfaction felt by tourists, such as variables. In addition, the loyalty is a concept closely related to tourists’ satisfaction and as a result even with the ideas there is a high degree of satisfaction with loyal tourists (Lobato et. al, 2006). In short, a positive destination image and satisfaction, is the basis for tourist’ visits all over again. If a destination that provides accommodation for the faithful tourists who repeat periodically, it will provide employment opportunities and economic benefits to its citizens. It will also contribute to form a solid foundation in the long-term development of the region.
Therefore, for the correct choice of services to be provided for tourists, it will be important to decide on the perceived image, and on the effect of perceived total satisfaction of the image and the
tourists’ loyalty. We have found out that there have been various studies about the image, satisfaction, and loyalty relationships while working on this subject (Kozak 2001; Lobato et. al. 2006; Prayag, 2008; Chi and Qu 2008). In this study, the Cappadocia region which is a tourist destination of Turkey is examined, and in this respect this study has differences among similar studies. In terms of cultural tourism, destination in Cappadocia, which has important features and is listed in the Ministry of Culture and Tourism 2023 strategic plan, is a region (Ministry of Culture, 2009). In Cappadocia which is an important centre of cultural tourism in Turkey, especially in the dissemination of a boutique hotels, conference tourism, and balloon tour options are available. For these reasons, this study aims to determine the effects of the perceived image of the destination of Cappadocia on the tourist’s satisfaction and loyalty and determine the interaction between satisfaction and loyalty. Thus, to take advantage of all the benefits of sustainable tourism practices, the preliminary ideas may occur as what should be done.
2. Conceptional Framework
2.1. The Concept of the Destination Image
A touristy facility, bay, district, country, a bunch of countries, even a continent can be defined as a touristy destination. As for the destination image, it’s regarded as a theory which generally has subjectiveness and is highly conceptional (Baloğlu and Brinberg 1997; Tasci et. al., 2007). For example, Barich and Kotler (1991: 95) describes the image as the total of a person’s or group’s faiths, attitudes and impressions. These impressions can be true or false, real or fancy. Image is the reasonable connotation or acting that someone has on the thing which is beyond their physical perception limits. Besides being the traces remaining in the brain after something received by the sensations, image can also be a mental fiction somebody has made up (Prayag 2008). In the wide literature search, Tasci and the others asserted the destination image which is a united concept as an “interactive system of the thoughts, ideas, sensations, dreams and intentions. Briefly destination image can be defined as an aspect of tourists’ beliefs, views and impressions about a place (Avcıkurt 2004).
The attraction of a touristy destination importantly depends on the natural sources and climate conditions of its geographical location. These environmental elements perceived by tourists, helps an image come about in their heads. From the tourists’ point of view, the image delivered is the fundamental factor on the final decision (Lobato et. al. 2006).
Measurement of the image of a tourism destination is made of too many tough factors. The literature examination points out that the principal contents in this theory’s formation are innate and scenic sources, attainability, cultural sources, security, nightlife-amusement, quality/price proportion (Andreu et.al. 2000; Chen 2001; Oleary and Deegan 2003). Some writers point out that there are two main elements of image (Baloğlu and McCleary 1999; Hosany et. al. 2006; Lobato et. al. 2006; Ilban
et. al. 2008; Prayag 2008): Cognitive and emotional elements. Cognitive element of image describes the beliefs and information that people have about a place. Cognitive element generally comes as a result of evaluating the people who live in that place and the events happening in that place. As for the emotional element, it describes what people feel about a place. More clearly, the emotional image of a place is about loving or not loving somewhere. Emotional image that people have about the place, as the knowledge, beliefs and thoughts can be said to be connected to the cognitive image. Observing the cognitive and emotional images of a place, the general image of it can be found out.
2.2. Tourist Satisfaction Concept
Content is the key factor in marketing. Customer (tourist) satisfaction has been a subject for discussions on marketing and tourism literature and defined in various ways (Oliver 1980; Chen and Tsai 2007; Prayag 2008; Lobato et. al. 2006). One of the most remarked definitions says satisfaction is the degree of positive feelings’ activation for the experience. The main principle of the satisfaction
measurement is the increase of itself when customers compare their sensations to their initial expectations with the “disconfirmation theory” (Oliver 1981; Yüksel and Yüksel 2001; Prayag 2008). According to this paradigm; satisfaction is a comparison between performance and expectation. If the perceived performance is higher than the expectations, the customer is happy. Alternatively, if the perceived performance is lower than the expectations, it is considered to be the discontentedness of the customer’s experience. The remarkable restriction of this theory; the less expectation, the more satisfaction. Another restriction is dynamism for the expectations’ nature and the fact that experience and satisfaction differ according to the situations confronted in sectors such as hosting/tourism services (Yüksel and Yüksel 2001). But in Oliver’s opinion (1999), this is based on what the customer does, but not the psychological point. That’s why “Oliver’s Satisfaction” is defined as the fulfilled joy.
Tourist satisfaction is measured as the total of comments by the tourists on each destination’s quality (Kozak 2003; Lobato et. al. 2006; Prayag 2008). This type of satisfaction measurement can be considered as the valuation about the quality of the destination performance such as how tourists are treated and subserved as well as how they felt in the destination, but not only their content at the end of their experiences. Consequently, it is said that satisfaction and discontentedness can be used as a performance measurement means and the ability to determine and to work as to fix factors causing discontentedness might be an important competitive benefit source.
2.3. Loyalty Concept
Loyalty can be defined as the future manner assurance to buy a product or service. From this aspect, loyalty can be established by observing direct buying attitude and buying frequency or by focusing on the selling number of a product or service as well as measuring the attitude to buy it once again indirectly (Prayag 2008). In this comprehension, that’s obtained in some “tourist attitude studies” which affirm various alternatives to measure tourists’ loyalty (Lobato et. al. 2006; Prayag 2008). First one, loyalty can be measured with repeating buying attitude. Second one; it can be measured with the attitude by analyzing tourists’ tendency towards the tourism destination. As a result, a complete measurement that includes the combination of tourists’ attitude and manner towards a destination (Lobato et. al. 2006).
3. Search Method
3.1. Search Model and Hypotheses
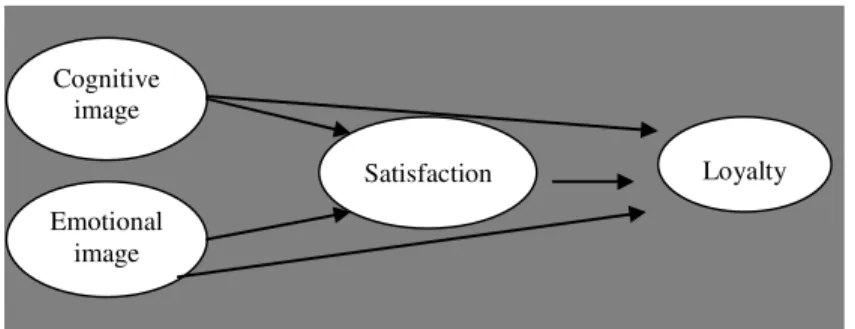
The study which was made to establish the cognitive and emotional image of Cappadocia Destination on tourist satisfaction and loyalty and to investigate the effect of satisfaction on loyalty was carried out according to the search model in figure 1.
Figure 1: Research model
Cognitive image
Emotional image
Satisfaction Loyalty
Too many labours investigating the relation between destination image and tourist satisfaction have been carried out and so many of these investigations has brought out that destination image is an important factor in affecting tourist satisfaction (Oleary and Deegan 2003; Petrick 2004; Lobato et. al.
2006; Chen and Tsai 2007; Prayag 2008). Therefore, whereas positive destination image supplied high satisfaction, negative images causes discontentedness. The hypothesis which points out the effect of the perceived image components is as below;
H1: Perceived cognitive and emotional images affect the satisfaction perceived by the tourist.
It’s affirmed that there is a positive relation between destination image and future attitudes, and the possibility of a guest’s, who has a positive image about the destination, visiting there again and recommending the destination to the others increase (Lobato et.al. 2006; Chen and Tsai 2007; Prayag 2008). Therefore, destination image is declared to be a determinative element on affecting tourist’s loyalty since it foresees tourists’ attitudes (Oppermann 1998; Lobato et.al. 2006; Prayag 2008). As in table 1, the hypothesis which explains the perceived image components’ effect on loyalty is as below;
H2: Perceived cognitive and emotional images affect the loyalty of tourists.
Additionally, in literature it is asserted that satisfaction has a positive effect on manners after buying (Oliver 1980; Kozak 2001; Chen andTsai 2007; Prayag 2008). In other words, there is a positively oriented relation between tourists’ sensed satisfaction level and their visiting the destination again as well as the manner to recommend the destination to the others. But satisfaction’s effect on re-visiting tendency and the possibility of recommending is not the same for every destination and in all situations (Mccleary et.al. 2006). Some investigations prove contentment’s positive effect in verbal communication (recommendation) (Chi and Qu 2008). However, other investigations show that satisfaction barely has effect or doesn’t have any effect at all in re-visiting tendency (Petrick et.al. 2001; Prayag 2008). Kozak (2001) has proved that satisfaction is the most effective element in re-visiting tendency for the same and different destinations in Mallorca and Turkey. As for Oliver, he emphasized that loyalty tendency cannot be explained only with satisfaction and some factors such as cost and time should be considered too (Oliver 1999). For instance, even if tourists are glad, they may look for new experiences in different destinations. As in table 1, the hypothesis to explain the relation between tourists’ satisfaction and loyalty is as below;
H3: Tourists’ satisfaction affects tourists’ loyalty.
3.2. Data Collecting and Analysis Techniques
Prepared in order to obtain data, the survey was applied to tourists who visited Nevşehir (Cappadocia) between 1-20 June. In survey’s development, the surveys, which have been used in explorations, fulfilled about the destination images have been examined and it has been determined that it generally consists of similar questions besides having some differences in terms of tourism types. The survey which was prepared in English was carried out on a group that was staying at a five-starred hotel in 30 April and it was found out that there were some meaning mistakes in the questions of the survey. After correcting the mentioned mistakes, the survey was set ready to be carried out.
A great number of tourists visit Cappadocia every year and there are tourists on their own besides the travel agencies and tour operators. Additionally, there are too many tourists who stay at different kinds of hotels in the region. Consequently, it is very hard to determine the sampling frame. For this reason, easy sampling was used in implementing the surveys. These surveys were handed in to tourist guides who bring tourists to those hotels by the 4-5 starred and boutique hotels’ owners. Tourist guides were asked to hand in the surveys at the end of the tour and collect the surveys back. The managers of one five-starred, two four-starred and a boutique hotel haven’t accepted the survey application. Tourists who were escorted by tour guides and stay at one five-starred, three four-starred and four boutiques, as total; eight hotels participated in the survey. The surveys were carried out by ten tour guides. 400 surveys were sent to the tour guides and 170 surveys in total returned back. The rate of return is 43%. In table 1, the demographic peculiarities of tourists and their dispersion according to where they stay at are shown.
Table 1: The Distribution of Demographic Characteristics
Demographic Characteristics
A.Gender F % D. Age F %
Male 77 45 Less Than 34(Young) 54 32
Female 93 55 35-54 (Middle-Aged) 67 39
More Than 55 (Aged) 49 29
B. Civil Status F % E. Hotel Type F %
Single 82 48 Star Hotels 74 43,5
Married 88 52 Boutique Hotels 96 56,5
C. Education Status F % F. Continent F %
High School or Less 27 16 America 86 51
Pre-Licensing 34 20 European 29 17
University 77 45 Australia 28 16
High Degree-Doctoral 32 19 Asia 27 16
Total 170 100 Total 170 100
SPSS 15.0 quick pack program was used while evaluating the data. Factor analysis was used in determining the perceived cognitive and emotional image and to measure the impact of cognitive and emotional image, satisfaction and loyalty and the impact of satisfaction on loyalty regression analysis was used.
3.3. The Scales
In the work, the scale, which was used by Sahin and Baloglu (http://www.tursab.org.tr) and Prayag (2008), was used pretty much. The survey prepared consisted of five sections; Initial two sections, cognitive (1: very bad and 5: perfect), and emotional image (1: captivating, 5: disappointment, 1: exciting, 5: boring and 1: relaxing, 5: depressive), were made to measure cognitive and emotional images and consisted of 5 questions scale. Third section includes the questions about re-visiting tendency and recommending possibility to measure the loyalty to the destination. Re-visiting tendency and recommending possibility were measured over 5 points scale. (1: unlikely and 5: very likely). The fourth section includes one question measuring the total satisfaction. Destination experience and total contentment of the guests were measured by 5 points scale (1: not content at all and 5: content more than enough). The last section of the survey consists of demographic questions such as age, gender, nationality, education.
4. Findings
4.1. The Factors which Compose Cognitive and Emotional Images
Before checking out the factors and components which compose the destination image obtained by using factor analysis, it is better to mention some amounts about analysis: (a) as indicated in Table 2, in cognitive and emotional image factors, Barlett’s Test result proves the result of the analysis was correct (p: ,00< ,05) (b). Kaiser-Meyer-Olkin(KMO) amount which is acquired for cognitive image has come out as 0.799, which explains the acceptability of the sampling. As for the emotional image, KMO was found out to be ,717. Mentioned amounts ensure the needed condition that has to be over 0.60 (Nakip, 2003). In Table 2 and 3 is shown the factors composing cognitive and emotional images, their components, the load of each factor, eigenvalue, variance, mean and Cronbach’s Alpha valuation. Additionally, the percentage of explaining total variance in cognitive image is 66.7%, and this percentage is 78.5% in emotional image.
Table 2: The Factors Which Compose Cognitive Images
Cognitive **
Factors Factor Components
Factor Loads Total Variance Explain (%) Cronbach's α Mean Touristy Attractions
Night Life and Entertainment ,77 13,87 ,73 3,47
Quality of Restaurant ,65
Variety of Shopping Opportunities ,62
Local Cuisine ,56
Basic Facilities
Safety and Security ,73 12,72 ,71 4,02
People’s Hospitality ,68 Standart of Services ,54 Local Tours/Excursion ,51 Cultural Attractions Natural/Scenery Attractions ,88 11,84 ,77 4,13 Cultural Attractions ,79 Cultural Heritage ,65 Touristy Substructures and Access Tourism Information ,82 10,22 ,72 3,73 Accessibility ,74
Foreign Language Abilty of People ,59 Natural
Environment
Unpolluted envinment ,81 9,22 ,65 3,75
Weather and climate ,74
Variety and Economical Factors
Value for Money Spent ,77 8,80 ,66 3,83
Variety of Activities ,54
Qualty of Accommodations ,48
Kaiser-Meyer-Olkin (KMO) : ,799 Barlett Testi: 750,944 df : 171 p: ,000< ,05
**
1: Very bad ……. 5: Perfect
Emotional image components were set as one factor and the factors quantity for cognitive image was fixed at 6. Touristy attractions, basic facilities, cultural attractions, touristy substructures and access possibilities, natural environment, variety and economical factors compose the cognitive image. While fixing the quantity of factors, criterions considered as that eigenvalue would be over 1 and factor’s loading would be over ,450. These factors were named according to their relation with the content of the components and the destination image. In similar searches, perceived image factors differ. In the search made by Prayag (2008), those 5 factors were fixed; basic-comfort facilities, security-substructure, cultural environment, variety-access and tourist attractions-atmosphere. As for the search made by Lobato and the others (2006) the quantity of the factors composing cognitive image was fixed as three; innate sources, service quality, entertainment.
Table 3: Emotional Image Factor and Its Components
Factors Components (b) Load of factor Explain of total variance (%) Cronbach’s α(%) Eigenvalue Mean Captivating- Disappointment ,91 2,33 2,13 Exciting-Boring ,88 78,55 ,85 2,48 Relaxing - Depressive ,85 2,53
Kaiser-Meyer-Olkin (KMO): ,717 Barlett’s testi: 231,046 df:3 p: ,000< ,05
In Table 4, correlation among factors is seen. 6 factors composing cognitive image are directly and positively related to satisfaction (at the 0.01 level of significance). There is a negatively oriented relationship between emotional image and satisfaction (at the 0.05 level of significance). Likewise, there is a positively oriented relationship among touristy attractions, basic facilities, cultural attractions, touristy substructure and access possibilities and emotional image with loyalty (at the 0.01 level of significance). There is a positive relationship between the natural environment and loyalty (at the 0.05 level of significance).
Table 4: Correlation Between Variables Variables 1 2 3 4 5 6 7 8 9 Touristy Attractions 1 Basic Facilities ,643** 1 Cultural Attractions ,452** ,508** Touristy Substructures and Access ,479** ,483** ,377** Natural Environment ,569** ,475** ,422** ,233** Variety and Economical Factors ,346** ,459** ,285** ,263** ,304** Emotional image -,092 -,034 -,005 -,161* ,101 0,28 1 Satisfaction ,429** ,335** ,206** ,397** ,276** ,239** -,192* 1 Loyalty ,317** ,223** ,233** ,237** ,237** ,155* ,066 ,560** 1
* Correlation: 0.05 Significance level (two-way) is important. ** Correlation: 0.01 Significance level (two-way) is important.
4.2. Results of the Regression Analysis
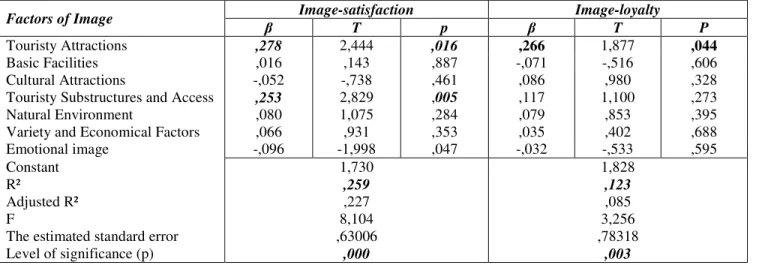
As seen in table 5, at the 0.05 level of significance the image (cognitive and emotional) has an important effect on satisfaction (R2: ,259; F: 8,104; p: ,00< ,05) and the effect of two factors makes sensible consequences. These factors are touristy substructure-access facilities (p< ,05) and touristy attractions. Especially, inabilities in touristy substructures-accessibility affect the tourist satisfaction. Besides tourists who come to a destination via tour operators and travel agencies, there are tourists who travel on their own. Deficiency in numbers of airlines and road haulage, and the poor quality particularly in road haulage are the most remarkable discontentedness point. Deficiency in both tourism information system and knowledge in foreign languages is emphasized. As for the subject of touristy attractions, the efficiency of night-life, local entertainment, the efficiency and quality of the restaurants, the disability in shopping and reflecting traditional cuisine are remarkable tracts of trouble. Therefore, it can be said that actions to develop those two factors can be done. Then again, it can be said that emotional image has an effect on contentment. At this point, tourists emphasize the destination’s characteristic of being magical. As well as “being satisfied”, as one of the factors composing cognitive image is important, cognitive satisfaction is forgotten as time goes by. On the other hand, the extents of the emotional image last longer in the tourists’ memories and remind them of the joy of a magical vacation. Hence, focusing on advertising these aspects of the destination which reflects the atmosphere might make tourists visit the same destination again.
Table 5: The Effect of Image on Satisfaction and Loyalty
Factors of Image Image-satisfaction Image-loyalty
β T p β T P
Touristy Attractions ,278 2,444 ,016 ,266 1,877 ,044
Basic Facilities ,016 ,143 ,887 -,071 -,516 ,606
Cultural Attractions -,052 -,738 ,461 ,086 ,980 ,328
Touristy Substructures and Access ,253 2,829 ,005 ,117 1,100 ,273
Natural Environment ,080 1,075 ,284 ,079 ,853 ,395
Variety and Economical Factors ,066 ,931 ,353 ,035 ,402 ,688
Emotional image -,096 -1,998 ,047 -,032 -,533 ,595
Constant 1,730 1,828
R² ,259 ,123
Adjusted R² ,227 ,085
F 8,104 3,256
The estimated standard error ,63006 ,78318
As indicated in table 5, cognitive image at the 0.05 level of significance with its effect on loyalty (R2: ,123; F: 3,256; p: ,003< ,05), it can be said that loyalty to the image description feature is too low (R2: ,123). The factor expressing image’s effect on loyalty is tourists attractions (p< ,05). Amongst perceived cognitive image factors, touristy attractions and the efficiency of the services given to tourists and its quality affect tourists’ loyalty. As can be seen, touristy attractions affect both satisfaction and loyalty. In order to satisfy tourists, to make them come back and recommend the destination, especially the services given under the name of “touristy attractions” should be enriched and made qualified.
In the regression analysis fulfilled to discover touristy attractions’ effect on tourists recommending the destination to others and their thoughts of re-visiting, this result was obtained; touristy attractions affect the tendency of recommending to the others(β: ,238, p: ,003< ,05; R2: ,054, F:10,170) much more than considering to re-visit there(β: ,345, p: ,001< ,05, R2: ,069, F:10,517). Besides the fact that this outcome is important in terms of sentiments, possessing positive destination image may not be enough to visit a destination (manner) later again.
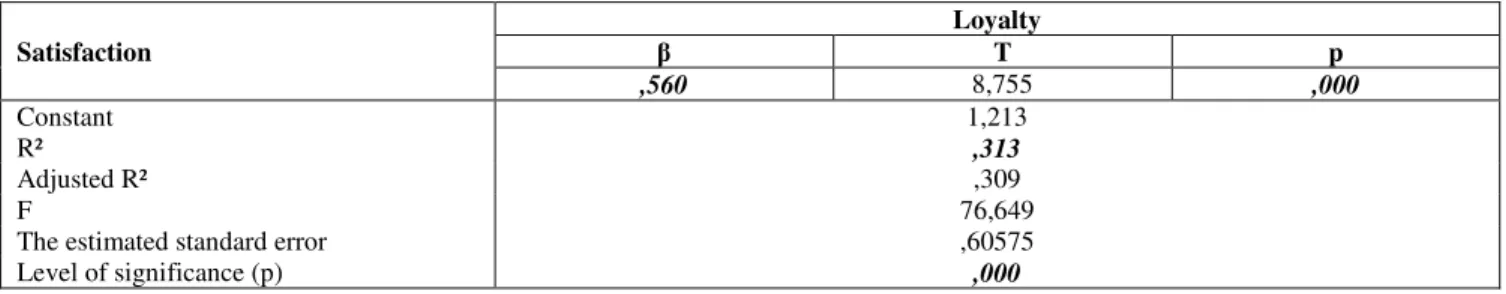
Table 6: Effect of Satisfaction on Loyalty
Satisfaction Loyalty β T p ,560 8,755 ,000 Constant 1,213 R² ,313 Adjusted R² ,309 F 76,649
The estimated standard error ,60575
Level of significance (p) ,000
As in Table 6, satisfaction affects loyalty on a high level ((R2: ,313; F: 76,649; p: ,000< ,05). Tourists should be made satisfied so that they’d re-visit the destination and recommend it to the others. Therefore, the perceived image has a positive impact on satisfaction and loyalty; on the other hand satisfaction has a positive impact on loyalty. According to these results, the point that various foundations which do business in the region and the state’s related branches in order to take advantage of all the facilities coming from sustainable tourism the point that they should focus on can be explained this way; such works as increasing the number of the services given to tourists and making them better, giving tourists information about the region, setting an active information system, representing services in various languages, and increasing the number and quality of the activities which would attract tourists’ interest such as animation shows and cultural activities should be done. Therefore, with cognitive image, a joyful and relaxing vacation ambiance can be provided. Moreover, being effective while working on how to make destinations be memorable in visitors’ minds might increase the number of visitors and the chance of tourists’ re-visiting the destination again.
5. Conclusions and Suggestions
Attraction in tourism destination importantly depends on the service tourists take and what they live during the time they spend at the destination as well as the destination’s geography and its innate sources. Tourists interpret the touristy regions they stay at with the cognitive and emotional criterions and get to have a general opinion about the region. This fact describes as cognitive image causes results with too many dimensions. Cognitive image sets a ground for management decisions such as planning marketing efforts and applications, heading for new types of tourism, supplying current deficiencies. Additionally, perceived image affects tourists’ satisfaction and loyalty. And tourists’ satisfaction and loyalty sets ambiance for sustainable tourism, and helps the development of the region and deploy.
In this work, it is aimed to decide the effects of the perceived image of the destination of Cappadocia on the tourist’s satisfaction and loyalty and determine the interaction between satisfaction and loyalty. In the result of factor analysis, six cognitive and emotional image factors composing perceived image were found. The components composing cognitive image are arranged as follows; touristy attractions, basic facilities, cultural attractions, touristy substructures and transportation options, natural environment, variety and economic factors. As for the results of the regression analysis, cognitive and emotional images components tourists’ satisfaction. The most important explanatory components are touristy attractions, substructure-transportation options and emotional image factors. Cognitive image partly affects tourists’ loyalty. Touristy attractions component is the main explanation of this effect. As for the tourists’ satisfaction, it highly affects loyalty. One of the most remarkable outcomes obtained in these works is that perceived image’s level of explaining loyalty is low although satisfaction explains loyalty and image explains satisfaction on a high level.
These results indicates that in order to make tourists re-visit the destination and recommend it to the others, they should be satisfied with the best and the most important factors in terms of satisfaction are touristy substructure-transportation options and image factors about touristy attractions. That’s why it’s necessary to assure the services given to tourists are appropriate and qualified and to found new workings which have these qualities, to set service standards and to develop them, to check transportation options and to do necessary works to fix or to provide alternative transportation vehicles. On this course, both of transportation alternatives to be used in the region and intercity transportation options should be considered. It is necessary to review the advertising works including the information tourists might need and to make sure they’re served in different languages. It might be necessary to increase the activities of tourism information offices. Language knowledge is an important element for the people and foundations who participate in employment process as much as it is important while introducing the district. Therefore, it can be recommended that the staff who can speak different languages in the region should be hired or there should be language teaching classes for those people. Importance should be attached to emotional image factor, advertising works which remind of the region’s magical atmosphere since they affect tourists’ satisfaction, various activities (animations and cultural ones) made for a relaxing and joyful vacation. Image’s emotional component may bring out new job opportunities for productive entrepreneurs. At this point, works based on harmony and cooperation should be accomplished amongst Ministry of Tourism, City Directorships and business operations in order to strengthen positive cognitive and emotional images and make them last longer.
There are two factors restricting the example capacity of the work. First factor is the language in the survey sheet. The survey sheet was prepared in English. Tourists from too many different countries (Japan and France in particular) visit Cappadocia destination. The survey prepared in English has been filled by some tourists. When such a work is done, preparing survey sheets in different languages will increase the example capacity. As for the second factor, it is that the survey would be carried out by only the tourists who travel through tour operators and travel agencies and with the company of tour guides. More than a million tourists visit Cappadocia destination through various approaches, and these tourists are counted out because of the different ways in carrying out surveys. Because of these reasons, only 170 tourists could be reached. This example capacity may not reflect the whole group. Exercises for different tourists can be repeated in different time periods.
In the next works, destination image’s various qualities about touristy attractions, substructure-transportation options and its effect on satisfaction can be examined in details by using focus group method. Exercises for different tourists can be repeated in different time periods. Additionally, the interaction amongst image, satisfaction and loyalty can be investigated on tourists who come to Cappadocia destination and especially stay at boutique hotels for long.
References
[1] Andreu, L., Bigne, E. and Cooper, C. (2000),“Projected and Perceived Image of Spain Seize to Tourist Destination for British Travellers”, Journal of Travel and Tourism Marketing, 9(4), pp. 47–66.
[2] Avcıkurt, C.(2004), “Country Image and Tourism Relationship-The Case of Turkey, tourist attractions (destinations) Marketing”, Weekend Tourism Conference, IX, Nevsehir, pp. 1-17. [3] Baloglu, Ş. and Brınberg, D. (1997), “Affective Images of Tourism Destinations”, Journal of
Travel Research, 35(4), pp.11-15.
[4] Baloglu, S. and Mccleary, K.W. (1999), “U.S. International Pleasure Travellers’ Images of Four Mediterranean Destinations: A Comparison of Visitors and Non-Visitors”, Journal of
Travel Research, 38(2), pp.144-153.
[5] Barich, H. and Kotler, P. (1991), “A Framework for Marketing Image Management”, Sloan
Management Review, Winter, pp.94-104.
[6] Chen, J.S. (2001), “To Marry Study of Korean Outbound Traveller’s Destination Images By Using Correspondence Analysis”, Tourism Management, 22, pp.345–350.
[7] Chen, C. and Tsai, D. (2007), “How Destination Image and Evaluative Factors Affect Behavioral Intentions”, Tourism Management, 28(4), pp.1115-1122.
[8] Chi, C.G.Q and Qu, H. (2008), “Examining the Structural Relationships of Destination Image, Tourist Satisfaction and Destination Loyalty: An Integrated Approach”, Tourism Management, 29(4), pp. 624-636.
[9] Hosany, S., Ekinci, Y. and Uysal M. (2006), “Destination Image and Destination Personality: An Application of Branding Theories to Tourism Places”, Journal of Business Research, (59), pp.638-642.
[10] İlban, M.O., Köroğlu A. and Bozok D. (2008), “Destination Image of tourists traveling with Thermal Tourism Purpose: Gonen Example," Journal of Social Sciences at Istanbul Commerce
University, (13), pp.105 -129
[11] Kozak, M. (2001), “Repeaters’ Behaviour at Two Distinct Destinations”, Annals of Tourism
Research, 28(3), pp.784-807.
[12] Kozak, M. (2003), “Measuring Tourist Satisfaction with Multiple Destination Atributes”, Tourism Analysis, 7(3/4), pp.229-240.
[13] Lobato, L.H., et.al. (2006), “Tourism Destination Image, Satisfaction and Loyalty: A Study in Ixtapa-Zihuatanejo, Mexico”, Tourism Geographies, Vol. 8, No. 4, pp.343–358
[14] Mccleary, K.W., et. al. (2006), “The Relationship Between International Leisure Travellers’ Origin Country and Product Satisfaction, Value, Service Quality and Intent to Return”, Journal
of Travel & Tourism Marketing, 21(2/3), pp.117-130.
[15] Nakip, M. (2003), Marketing Research (Techniques and SPSS Aided Applications), Seçkin Publication, Ankara.
[16] Oleary, S. and Deegan, J. (2003), “People, Pace, Place: Qualitative and Quantitative İmages of Ireland Seize Tourism Destination in France”, Journal of Vacation Marketing, 9(3), pp. 213– 226.
[17] Oliver, R.L. (1980), “A Cognitive Model of the Antecedents and Consequences of Satisfaction Decisions”, Journal of Marketing Research, 17, pp.460-469.
[18] Oliver, R. L. (1981), “Measurement and Evaluation of Satisfaction Processes in Retail Settings”, Journal of Retailing, 57, pp. 25–48.
[19] Oliver, R.L. (1999), “Whence Consumer Loyalty?” Journal of Marketing, 63, pp. 33-44.
[20] Opperman, M. (1998), “Destination Threshold Potential and the Law of Repeat Visitation”,
Journal of Travel Research, 37(2), pp.131-137.
[21] Petrick, J.F. (2004), “The Roles of Quality, Value and Satisfaction in Predicting Cruise Passengers’ Behavioural Intentions”, Journal of Travel Research, 42(4), pp.397-407.
[22] Prayag, G. (2008), “Image, Satisfaction and Loyalty-The Case of Cape Town”, Anatolia: An
International Journal of Tourism and Hospitality Research, 19, (2), pp. 205-224.
[23] Tascı, A.D.A, Gartner, W.C. and Cavuşgil, S.T.(2007), “Conceptualisation and Operationalisation of Destination Image”, Journal of Hospitality and Tourism Research, 31(2), pp. 194-223.
[24] Şahin, Ş. and Baloglu, Ş. (2009),
http://www.tursab.org.tr/content/.../07agsafak's%20thesis%20survey.doc, Access Date: 25.08.2009.
[25] Ministry of Culture (2009), "Turkey Tourism Strategy 2023, the Action Plan 2007-2013", http://www.kultur.gov.tr/TR/Tempdosyalar/189566__TTStratejisi2023.pdf., Access Date: 25.08.2009.
[26] Yüksel, A. and Yüksel, F. (2001), “The Expectancy-Disconfirmation Paradigm: A Critique”,