A Modern Approach to Estimate the
Bearing Capacity of Layered Soil
Gizem Misir
1*, Mustafa Laman
2Received 07 June 2016; Revised 12 August 2016; Accepted 08 November 2016
Abtsract
This study is concerned with the bearing capacity of circular footings on a granular fill layer above a soft clay soil. The results of an extensive series of laboratory and field tests were used to define an empirical equation. This is generally done by estimating the dependent variable (e.g. bearing capacity) based on the independent variables (e.g. granular fill layer thickness, soil and footing parameters and settlement ratio). A logarithmic model has been developed by using regression analysis to estimate the bearing capacity of a circular foot-ing restfoot-ing on granular fill at any settlement ratio, usfoot-ing all possible regression techniques based on 342 field test data, to select the significant subset of the predictors. The results indi-cate that the logarithmic model serves a simple and reliable tool to predict the bearing capacity of circular footings placed on a granular fill with different thicknesses above a soft clay soil. And also, the validity of the developed formulation was verified with different plate load test results from literature. Keywords
bearing capacity, layered soil, regression analysis, field tests, laboratory model tests, circular footing
1 Introduction
The ultimate bearing capacity of strip footings in homogene-ous soils is generally estimated by geotechnical engineers with the bearing capacity equation proposed first by Terzaghi [1] and modified later by Meyerhof [2] and Brinch Hansen [3]. How-ever, natural soil profiles are often layered and/or heterogene-ous. Two cases are generally considered for two layer clay soils: a) weak clay overlain by relatively stronger clay, and b) stronger layer overlain by relatively weaker clay. In the former case, it is generally assumed that bearing capacity failure occurs in the upper weak clay. In the second case, the problem is usually ana-lysed as a punching failure through the upper strong clay and as a general shear failure in the lower weak clay.
Several experimental and numerical studies have been described in the literature about the reinforcement of a weak soft soil (Ochiai et al. [4], Otani et al. [5], Yamamoto and Kusuda [6], Ismail, K. M. H. I. [7], Verma, S. K. et al. [8], Thome et al. [9], Mosadegh A. & Nikraz H. [10], Ziaie Moayed, R. et al. [11], Ornek et al [12], and Calik and Sadoglu [13]. Ochiai et al. [4] investigated the theory and the applications of reinforced fill over soft ground in Japan. Otani et al. [5] studied the behavior of strip foundation constructed on reinforced clay. Settlement was found to be reduced with the increase in reinforcement size, stiffness and number of layers. The layout of reinforce-ment closer to each other caused an increase in carrying capac-ity. Yamamoto and Kusuda [6] employed approximate solutions for bearing capacity of reinforced soil using the upper-bound theorem of limit analysis. Microscopic observation results of the failure mechanisms of reinforced and unreinforced soils were examined. The method was developed from the failure mechanism results by using upper bound theorem and it was compared with the experimental results. It was found that the upper-bound calculation is an effective way for the evaluation of bearing capacity and the prediction of failure mechanism. Ismail, K. M. H. I. [7] compared the results of the numerical analysis and the field plate loading observations of the circular footing resting on granular soil overlying soft clay. It is demon-strated that the ultimate bearing capacity is directly proportional to the angle of internal friction of granular soil ϕ, the granular
1 Karamanoğlu Mehmetbey University, Civil Engineering Department,
70100, Karaman, Turkey
2 Cukurova University, Civil Engineering Department, 01330 Balcali/Adana,
Turkey
* Corresponding author email: [email protected]
61(3), pp. 434–446, 2017
https://doi.org/10.3311/PPci.9578
Creative Commons Attribution b
research article
PP
Periodica Polytechnica
Civil Engineering
layer thickness H, and the foundation depth D, while at the same time it is inversely proportional to the footing diameter B. Plate loading tests have been conducted by Verma, S. K. et al. [8] in a large tank to observe the load settlement behavior of plates of different sizes resting on layered granular soils. Tests were conducted on fine gravel layer overlain sand layer using mild steel plates of square shapes. The effect of the layer placement on the bearing capacity and settlement characteristics of foot-ing has been studied and an equation for predictfoot-ing the bearfoot-ing capacity of two layered granular soils is developed based on the plate load test data. Thome et al. [9] proposed a semi-em-pirical approach from finite element results, for the cemented fill layer above weak soil ground. This method was compared with the field plate loading test results. The results for different base diameters and the deposit thicknesses have shown that this approach can be used. Mosadegh A. & Nikraz H. [10] examined the bearing capacity of a strip footing on one-layer and two-layer soils by using ABAQUS. For a two-layered, soft- over-strong soil, the effect of layer thickness, soil shear strength and mate-rial property on bearing capacity value and failure mechanism have been studied. It was concluded that, the bearing capacity of footing decreases as the height of clayey soil increases whilst the displacement under footing increases. However, the stron-ger bottom layer have not been effected the ultimate bearing capacity and displacement value of footing after some thickness of clayey soil on top. Ziaie, R. M. et al. [11] performed a finite element analysis to study the bearing capacity of ring footings on a two layered soil. The effects of two factors, the clay layer thickness and the ratio of internal radius (ri) of the ring footing to external radius (r0) of the ring, have been analyzed. It was found that, the bearing capacity decreases as the value of ri/r0 increases.
In the present study an attempt has been done to develop a regression model on the basis of the actual data obtained from the field tests, for estimating the bearing capacity of circular footing on granular fill layer above a soft clay soil to any s/D ratio. To the best of the author’s knowledge, no attempts so far have been made to estimate the bearing capacity of a circular footing resting on granular fill layer above a soft clay soil, by means of a regression analysis.
2 Materials Used
Soft clay and granular soils were used for the experimental investigations.
2.1 Soft Clay
The soft soil material used in this research was locally avail-able clay soil from the west part of Adana, Turkey. The soil conditions at the experimental test site were determined from a geotechnical site investigation comprising both field and labo-ratory tests. Two test pit excavations (TP1 and TP2) and four borehole drillings (BH1, BH2, BH3 and BH4) were performed
in the water treatment metropolitan municipality test area. The plan view and the locations of the piles in test area are shown in Fig. 1. The main purpose of the piles are to use them as a reac-tion piles to reach some large load values as in the plate loading test. Standard Penetration Tests (SPT) were carried out during the drilling of each borehole, and the distribution of SPT values with depth is shown in Fig. 2.
Fig. 1 Plan View Showing Piles, Borings and Test Pits (Ornek et al. [12])
Fig. 2 SPT (N) Values Measured From Boreholes (Ornek et al. [14])
After conducting required conventional laboratory tests (sieve and hydrometer, moisture content, unit weight, liquid and plastic limit, unconfined compressive strength), the soil was prepared for model tests. The soil was identified as high plasticity inorganic clay, CH, according to the unified soil clas-sification system (USCS). The values of liquid limit, plastic limit and plasticity index of soft soil were obtained as 53%, 22% and 31%, respectively. The water content of the stratified soil layers varied between 20% and 25%, depending on depth, which was almost the same as, or greater than, the plastic limit. The value of specific gravity of clay soil was found to be 2.60. The average cohesion values of clay soil were 40 kN/m2 and 75
kN/m2 for laboratory model and field tests, respectively (Demir
Table 1 Clayey Soil Properties
Depth 0-1 m 1-2.2 m 2.2-3.5 m 3.5-5.0 m
Soil Type Topsoil CH CL CL
w (%) - 0-21 22-24 22-24 γn (kN/m3) - 19.5-20.5 19.3-22.5 20.8-21.5 γs (kN/m3) - 25.7-26.0 26.0-26.9 25.7-26.6 wL (%) - 51-69 28-54 37-44 wP (%) - 21-30 19-22 20-25 cu (%) 60-80 65-75 -2.2 Granular Soil
The granular fill material used in the experimental stud-ies was obtained from Kabasakal region situated northwest of Adana, Turkey. Some conventional laboratory tests (sieve, moisture content, unit weight, direct shear and proctor) were conducted for this material. All the conventional test results are tabulated in Table 2.
Table 2 Granular Soil Properties Soil Type (%)w γkmax
(kN/m3) (kN/mγs 3) (ϕ0) (kN/mcu 2)
GW-GM 7.0 21.7 26.4 42.0 15.0
According to the sieve analysis, granular soil was classified as well graded gravel-silty gravel, GW-GM according to the USCS (Fig. 3).
Fig. 3 Grain Size Curve for Granular Fill (Misir [16])
For all test groups, granular soil was prepared at a value of optimum moisture content of 7% and a maximum dry unit weight of 21.7 kN/m3 obtained from the standard proctor test
(Fig. 4). To maintain the desired density of the soil in the test area, the same compaction procedure was applied to each gran-ular fill layer.
Fig. 4 Standard Proctor Curve for Granular Fill (Misir [16])
The values of internal friction angle and the cohesion of granular fill were obtained as 43° and 15 kN/m2, respectively
from direct shear test (Fig. 5). Specific gravity of the granular soil was obtained as 2.64 (Demir et al. [15]).
Fig. 5 Direct Shear Test Curve for Granular Fill (Misir [16])
3 Field Tests
3.1 Preparation of Granular Fill Layer
The test programme contains 21 field tests for circular rigid footings, with diameters of 6, 9, 12, 30, 45, 60, 90 cm. In the field experiments, the wooden box was used to form the granular fill layer. Box sizes were selected from the numerical analysis for all the footings which was performed previously to eliminate the boundary effects due to the loading. The total fill layer thicknesses were determined as a multiple of the foot-ing diameter. To obtain the desired granular fill thickness the fill material was placed in layers above the natural clay soil. Each granular fill layer thicknesses was 20 mm for 6, 9, 12 cm footings, and it was 50 mm, for 30, 45, 60, 90 cm footings on natural soft clay. For each granular fill layer, the amount of soil needed was calculated. The fill material was prepared by using tiller to mix the pre-weighted soil and water. For each layer the needed soil poured and was compacted using with an electri-cal plate compactor, to the predetermined height to achieve the desired densities. Compaction procedure was used throughout the testing program in order to obtain a reasonably homogene-ous soil. After preparation of each granular fill layer was com-pleted, the height of each layer was controlled.
3.2 Test Procedure
A total of 21 field tests were conducted on silty clay soil. Reinforced concrete reaction piles were installed on each side of the test footing and connected to each other by means of a 4 m length I–240 steel beam (Laman et al. [17]). A hydraulic jack and two displacement transducers (LVDT) were connected to a data logger and it was connected to a computer, to measure the applied load and settlement of the footing. The circular model footings used in the field tests had diameters of 6 cm, 9 cm and 12 cm with 2 cm thickness and also had diameters of 30 cm, 45 cm 60 cm and 90 cm with 3 cm thickness. The footing was loaded with a hydraulic jack supported against the reaction frame (Laman et al. [17]). Depending on the diameter of the foundations, different capacities of hydraulic jacks were used (Fig. 6). The tests were performed according to the ASTM D 1196-93 (ASTM [18]).
Fig. 6 Schematic View of The Experimental Set-Up (Laman et al. [17])
A load cell was placed between the jack and the footing to measure the applied load. Settlements were measured by using 5 cm capacity two transducers which were placed at the bottom of the foundation plate base. The average value of these two readings, were obtained as the value of settlement (Fig. 7–8).
Fig. 7 Field Test Set-up for D = 30, 45, 60, 90 cm (Laman et al. [17])
Fig. 8 Field Test Set-up for D = 6, 9, 12 cm (Laman et al. [17])
3.3 Test Variables
Field tests were carried out for three different granular fill layer thicknesses. Seven different footing diameters (D) were used for the same granular thickness. The field tests were con-ducted under three series and symbolized by IM. Parameters considered in these series are footing diameters (D), and granu-lar fill layer thicknesses (H/D) (Table 3).
Table 3 Test Variables for Field Tests Test Series ParametersConstant
(H/D) Variable Parameters (D) cm IM–D–0.33 0.33 6, 9, 12, 30, 45, 60, 90 IM–D–0.67 0.67 6, 9, 12, 30, 45, 60, 90 IM–D–1.00 1.00 6, 9, 12, 30, 45, 60, 90
4 Laboratory Model Tests
As in the field tests, in order to establish the effect of foot-ing diameters and granular fill layer thickness on the bearfoot-ing capacity of circular footing, laboratory tests were carried out. Experimental setup and preparation procedure of granular fill layer above the natural clay soil were moreless the same as in the field test. Some differencies are reported below.
4.1 Preparation of Granular Fill Layer
A total of 8 laboratory tests were carried out using circular rigid footings with diameters of 6 and 9 cm. The granular mate-rial was prepared by mixing the pre-weighted soil and water according to the compaction test results. The granular fill layer was placed on natural soft clay in layers of approximately 25 mm thicknesses. As in the field tests before to compact the gran-ular fill in layers, the amount of soil needed for each lift was cal-culated first. Then the granular soil, was poured, and compacted using with an electrical plate compactor, to the predetermined height to achieve the desired densities. After preparation of each granular fill layer was completed, the height and the densities of each layer was controlled for a homogeneous fill.
4.2 Test Procedure
A cylindrical test box having 38 cm diameter and 42 cm height, was used in the laboratory tests. This rigid test box is made of steel and has a wall thickness of 5 mm. The inside walls of test box, was polished smooth, to reduce friction with the soil. For the model tests, soft clay soil was kept in an oven for 24 h at a temperature of 105 + 5Co and it was then sieved passing through B. S. sieve No 10 (2.00 mm). The clay soil was thoroughly mixed by hand and placed at the predetermined soil unit weight, into the test box. The remolded clay was placed into the bin in layers of 2.5 cm thickness. The soil in the test box was compacted, by a special hammer to give standard compaction energy. The test box was filled in a similar way to get enough height for each test. The granular material was
compressed, as in the field experiments with an electrical plate compactor (Demir et al. [15]). A square steel plate with a width of 50 cm was placed under this heavy model box and firmly clamped using two long pins to prevent any movements during the tests. A model circular footing with a hole at its top center made of mild steel was used to transfer the load to the center of the foundation with a steel ball. Model circular foundations, with diameters of 6 and 9 cm and with thickness of 2 cm were used. The foundation was positioned at the center of the top soil layers, before the tests (Misir [16]). Such an arrangement produced a hinge, which allowed the foundation to rotate freely as it approached failure and eliminated any potential moment transfer from the loading fixture (El Sawwaf [19]).
4.3 Test Variables
Laboratory tests were carried out for two different founda-tion diameters (D). For two constant model footing diameters, the granular fill layer thicknesses (H/D) were varied between 0.25D and 1.50D (Table 4). The tests for remolded clay, is sym-bolized by LM.
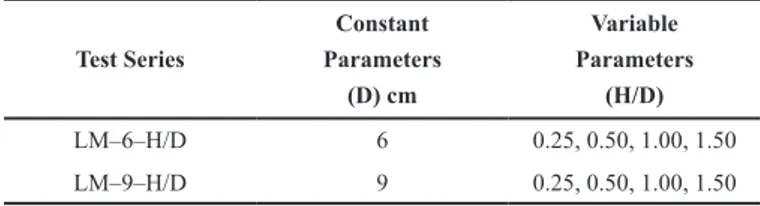
Table 4 Test Variables for Laboratory Tests Test Series Constant Parameters (D) cm Variable Parameters (H/D) LM–6–H/D 6 0.25, 0.50, 1.00, 1.50 LM–9–H/D 9 0.25, 0.50, 1.00, 1.50 5 Statistical Analysis
Empirical estimation methods are often used in many Engi-neering applications including Geotechnical EngiEngi-neering (Chen [20], Davarci, B. et al. [21], Adunoye and Agbede [22], Latha et al. [23], Jha et al. [24]). Regression analysis is a statistical meth-odology used to examine the relationship between a depend-ent variable and a set of independdepend-ent variables. Correlation and regression analysis are related in the sense that both deal with relationships among variables. Neither regression nor correla-tion analyses can be interpreted as establishing cause-and-effect relationships. The correlation coefficient (R) measures only the degree of linear association between two variables. In fact,
R2 = R*R (and sometimes known as the coefficient of
determina-tion) is used as measure of the quality of the regression. The method which is used in this study, is preferred as a sim-ilarity model and can be adopted for load displacement relation-ship because the independent variables used are explicit and the dimensionless variables are physically bounded.
As in the regression analysis, it is generally done by estimat-ing the dependent variable (e.g. bearestimat-ing capacity) based on the independent variables (e.g. settlement ratio (s/D) and thickness of the granular fill layer (H/D)). In the experimental studies, granular fill layer with different thicknesses (H) was located beneath the foundation (Fig. 3). The aim of carrying out these
tests is to analyze the contribution of granular fill on the bearing capacity of soft clay soil. In the tests, granular fill thickness was changed depending on the foundation diameters.
As in any prediction problem, the selection of input variables is very important. For that reason, only the essential variables which have significant effect on the behavior should be selected (Uncuo-glu [25]). 6, 9, 60 and 90 cm diameter circular foundations were used in the field experiment to derive the statistical approach. In the analysis, three different granular fill layer thicknesses were used for each of the four different foundation diameters (Fig. 9). As seen from the graphs, the relationship between the bearing capacity (q) and settlement ratios (s/D) for all the curves is fairly linear for small-load ranges, and that the relationship is nonlinear for large-load ranges and does not exhibit any peak values. Also, from a comparison of the curves for different H/D values, it can be seen that the load–settlement behavior became stiffer as the
H/D ratio increased, due to partially replacing the natural clay soil
with a layer of compacted stiffer granular fill, for both D = 0.06 m and 0.90 m footing diameters. In these series, the bearing capacity is a function of H/D (Ornek at al [12]).
Fig. 9 The Field Test Results Used to Obtain The Formulation
Failure loads are more significant for footings with smaller diameters however, this behavior is not observed clearly for larger diameter. The reason for this is, load handling system was forced and inaccessibility of greater deformation rates. In this study a statistical formulation was developed with these test curves to estimate the bearing capacity of soft clay stabi-lized with granular fill layer. For this aim, in order to create a formulation in terms of dimensionless parameters for bear-ing capacity, a theoretical formula is needed. This suggests, a means of extrapolating the results of a circular footings between certain limits, to a design process for model or full-scale footings on the same granular upper material and lower soft foundation material (Thome et al. [9]).
In layered soils, to predict the value of bearing capacity according to the upper stiff layer, is not a realistic way. There-fore, Onalp and Sert [26] has proposed the following formula to reflect this behavior Eq (1).
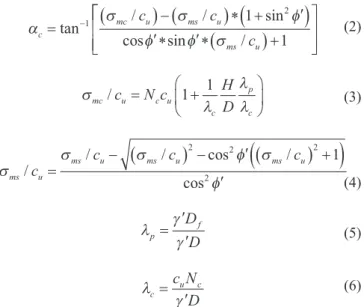
The expressions in the bearing capacity formula Eq (1) are given in Eqs (2–6).
This formulation contains foundation, soil and fill layer parameters, to reach ultimate bearing capacity for the desired granular fill layer thickness and equivalent foundation diameter.
However, most of the developed theoretical approaches are independent from settlement ratio. Therefore only the bearing capacity values can be obtained but load-settlement behavior cannot be assessed as it was the case in the experimental stud-ies. The formulation was obtained from 342 data points in Fig. 9 by plotting q values against s/D values. The settlement ratio
s/D is defined as the ratio of footing settlement s to footing
diameter D. Many formulations were tested and the best equa-tion that fits the load deformaequa-tion behavior, occurred in a non-linear logarithmic equation from as seen in Eq. (8).
In generally Eq. (8) can be used both to obtain the value of ultimate bearing capacity at a constant settlement ratio (in general the most common settlement ratios (s/D) are 3%, 5% or 10% etc. to obtain the ultimate bearing capacities in the lit-erature.) and the behavior of the load displacement relationship at a constant granular fill layer thicknesses.
Therefore, Eq (8) can be used for both the laboratory and field tests for layered soil conditions in a certain limits as in the experiments. The parameters of granular and soft clay soilsmust be used to calculate the value of theoretical bearing capacity (qtheoric). In this study, although the procedure of the remolded clay soil constitution has been generated in a reason-able way, the effect of the bond forces between the clay parti-cles for the natural and remolded clay soils are different from each other and this effect occurs by the value of cohesion. The usage of the theoretical bearing capacity formulation by actual soil parameters, makes the bearing capacity estimation possible for the experimental studies considered in this work by using a single formulation Eq. (8). Although Eq. (8) was derived by using the limited data of the field experiments, by taking into account the parameter of the cohesion, the formulation was used to verify and to validate the laboratory test results.
Regression analysis is a technique used to estimate values that are unknown with the known values. It is important to know the shape and the degree of the functional relationship between vari-ables. The value of correlation coefficient, indicates the degree of reliability, for the estimated values. The results produced high coefficient of determination (R2) for Eq. (8) to be 0.898 (Fig. 10).
Fig. 10 Correlation of the Experimental and Predicted Results
for Formulation Data
6 Results and Discussion
6.1 Comparison of the Field Test Results with Those Obtained from Eq. (8)
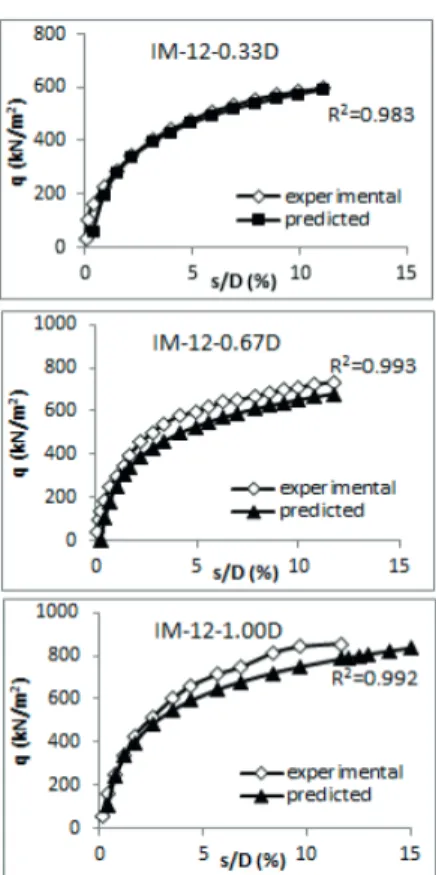
The purpose of this study, is to find a relationship between settlement ratio s/D, and bearing capacity q, depending on the thickness of granular fill layer together with different footing diameters placed on the soft clay soil. Some more field tests were carried out for different footing diameters (D = 12 cm, 30 cm, 45 cm). The results of these tests were not used to obtain Eq. (8). When Eq. (8) was applied to the geometries of these tests, the graphs of q versus s/D were obtained. Figures 11, 12 and 13 shows clearly that the values by using the proposed analytical solution is in very good agreement with test results for all three different footing diameters and granular fill layer thicknesses.
q H D c N D H K theoric c u c f f p c = +
(
+ ′ + ′)
+ ′ − ′ 1 2 tan sin( ) cos α γ γ φ α φφ ∗ α γ γ γ α ′(
+ ′)
− ′ + cos c f f tan c H D D H H H D 1 2 α σ σ φ φ φ σ c mc u ms u ms u c c c =(
)
−(
)
∗ +(
′)
′∗ ′∗(
)
+ − tan / / sin cos sin / 1 2 1 1 σ λ λ λ mc u c u c p c c N c H D / = + 1 1 σ σ σ φ σ φ ms u ms u ms u ms u c c c c / / / cos / cos = −(
)
− ′(
(
)
+)
′ 2 2 2 2 1 λ γ γ p f D D = ′ ′ λ γ c=c Nu′Dc q qtheoric= ∗HD − ∗DH + 0 074 0 135 0 339 2 . . . + ∗ − ∗ + ln . . . s D H D H D 0 108 0 217 0 502 2 (1) (2) (3) (4) (5) (6) (7) q qtheoric= ∗a x b+ ln( ) (8)Fig. 11 Comparison of Experimental and Eq. (8) Results for D = 45 cm New
Field Tests
Fig. 12 Comparison of Experimental and Eq (8) Results for D = 30 cm New
Field Tests
Fig. 13 Comparison of Experimental and Eq. (8) Results for D = 12 cm New
Field Tests
As seen from the results that, the q-s/D relationship pre-dicted by using Eq. (8) has shown a similar non-linear behavior with experimental results. Also, the ultimate bearing capacity obtained by using Eq. (8), gives similar results obtained from field tests as shown in Figs. 11–13.
Fig. 14 presents the measured bearing capacities against the predicted bearing capacities by the network model with R2
coef-ficients for the input and the output values, respectively. The linear 1:1 line was also plotted in these figures to discuss the performance of the statistical models. It is seen from the figure that by using Eq. (8), the location points of the experimental and the predicted bearing capacity values are scattered around the 1:1 line for both input and output phases (Fig. 14).
Fig. 14 Correlation of the Experimental and Predicted Results for New
In engineering practice foundations are always designed at a limited settlement level because of serviceability requirements. The field tests and the formulation results are summarized in Table 5. In this table, the bearing capacities (qu) obtained at a settlement ratio of s/D = 3% are presented. The error between the experimental results and the estimated bearing capacity values by using Eq. (8) was calculated, by the mean absolute percentage error method Eq. (9). The mean absolute percent-age error (MAPE), is a measure of accuracy of a method for constructing fitted time series values in statistics, specifically in trend estimation. It usually expresses accuracy as a percentage, and is defined by the following formula:
where Ai is the actual value and Fi is the forecast value. In the proposed model, the value of mean absolute percentage error varies within the range of 0.02% and 13.05% and the for-mulation estimates 184 field experiment data, with an error rate of 5.47% on average.
Table 5 Comparison of Bearing Capacities Obtained from Eq. (8) and Field
Test Results for s/D = 3%
Test series H/D (cm)D Experimentalq
u(kN/m2) Predicted qu(kN/m2) Mape (%) IM-12-0.33D 0.33 12 403.3 396.6 1.7 13.0 7.8 IM-12-0.67D 0.67 511.7 444.9 IM-12-1.00D 1.00 557.3 513.5 IM-30-0.33D 0.33 30 377.6 397.4 5.3 2.0 13.8 IM-30-0.67D 0.67 435.7 444.5 IM-30-1.00D 1.00 456.1 519.1 IM-45-0.33D 0.33 45 389.8 388.7 0.3 0.02 5.3 IM-45-0.67D 0.67 446.0 446.1 IM-45-1.00D 1.00 499.3 525.7
The Mean Absolute Error: 5.4
In this section, regression analysis of the results of field tests which were not used to obtain the formula were shown sat-isfactory results with the results of the formula. In the field tests due to the limitations in the experimental assembly, it was not possible to load more than a certain value. The large-scale experiments were terminated at settlement rate of 3% due to the limitation of loading mechanism. Considering the curve obtained from the formula showed that the bearing capacity values for the values of 3%, is also acceptable.
Fig. 15 The Estimation of the Curve of q versus s/D for the Remaining
Part of the Test
So, the experimental curve of non-linear behavior of load- deformation relationship q–s/D couldn’t be fully achieved and the ultimate bearing capacity values could not be obtained clearly (Fig. 15) for these diameters. At this point the formula-tion was used to produce the full form of the curve which was not reached in the experiments. The load deformation curve obtained from Eq. (8) continued after the termination point of the experimental curve. As a result, the curve obtained from the formula is highly significant and represents the actual behavior of the soil until the point of changing the inclination of the curve and the formulation is in compliance with the experimen-tal results up to this point. It is shown that, the soil behavior and the failure load can be obtained easily by using the formula derived in this study without any extra experimental work.
6.2 Comparison of the Laboratory Test Results with Those Obtained from Eq. (8)
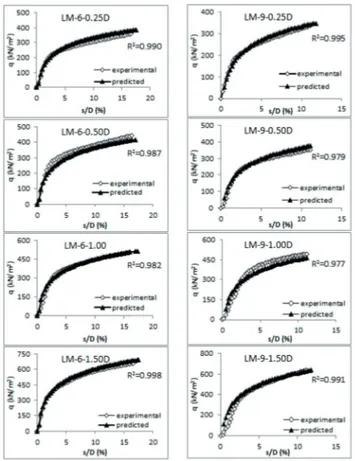
As in the field tests, in order to test Eq. (8) for laboratory tests, for different footing diameters and granular fill material thicknesses which were not considered while obtaining Eq. (8), the results of these tests were compared with the results obtained by using Eq. (8) with the parameters of the tests (Fig.16). MAPE A F A n i i i i n = ∗ − =
∑
100 1 (9)Fig. 16 Comparison of Experimental and Eq. (8) Results for Laboratory
Model Tests
Fig. 16 shows clearly that the values obtained by using the proposed analytical solution are again in very good agreement with the laboratory test results. For each laboratory test, the determination coefficient between the experimental and the predicted ultimate bearing capacities are given in Fig. 17. All the laboratory test results were evaluated together; the average coefficient of determination, as shown in Fig. 17 was obtained as 0.971.
Fig. 17 Correlation of the Experimental and Predicted Results for Laboratory
Model Tests
The bearing capacity of laboratory test results and those obtained from Eq. (8) are summarized in Table 6. In this table, the bearing capacities obtained at settlement ratio of
s/D = 3% are presented. Bearing capacity values increase with
an increase in thickness of granular fill. In the proposed model, the value of mean absolute percentage error varies within the range of 1.19 and 13.57. The formulation was estimated 403 laboratory experiment data, with an error rate of 5.15% on average. Also as seen from Table 6, when the thickness of the granular fill layer for the laboratory tests were increased from 0.25D to 1.50D, a significant increment of the bearing capacity have been observed up to 76%.
Table 6 Comparison of Bearing Capacities Obtained from Eq. (8) and
Labora-tory Test Results for s/D=3%
Test series H/D (cm)D Experimentalq
u(kN/m2) Predicted qu(kN/m2) Mape (%) LM-6-0.25D 0.25 6 227.5 224.8 1.2 13.5 5.4 3.8 LM-6-0.50D 0.50 285.8 247.0 LM-6-1.00D 1.00 324.9 307.3 LM-6-1.50D 1.50 399.0 414.2 LM-9-0.25D 0.25 9 222.2 224.8 1.2 1.6 8.4 5.9 LM-9-0.50D 0.50 251.2 247.2 LM-9-1.00D 1.00 336.6 308.3 LM-9-1.50D 1.50 393.3 416.7
The Mean Absolute Error: 5.1
6.3 Verification of Eq. (8) by Comparing with Literature
In this section, the developed formulation (Eq. 8) was applied to different model test results to investigate the valid-ity. For this purpose, three different experimental studies from the literature were used to compare. One of the aforementioned studies belongs to Biswas et al. [27]. In the study, the research-ers investigated the behaviour of geogrid reinforced sand-clay foundation systems, with clay subgrades of different strengths.
Model tests were carried out on a circular footing of 150 mm diameter (D) resting on layered soil. The layered systems were comprised dense sand of varying layer thicknesses (H = 0.63D–2.19D) overlying the clay subgrades of different und-rained shear strengths (cu), ranging from 7 to 60 kPa.
As seen in Figure 18, four different test results with differ-ent undrained shear strength and fill layer thicknesses were selected to compare and validate Eq. (8) with the experimental results of Biswas et al. [27].
Three of these tests were performed in different granular fill layer thicknesses (H/D = 0.63, 1.15, 1.67) in cases where the undrained cohesion was 7 kPa. The last graph shows the case of c = 15 kPa and H/D = 0.63.
Fig. 18 Comparison of q–s/D Relationship Between Eq. (8)
and Biswas et al. [27]
The developed formulation was applied to these experi-mental results. Upon analyzing the q–s/D behaviors, both of the graphs, reveal nonlinear behavior as shown in Figure 18. Generally, the predicted pressure values were higher than test results at the same settlement ratios. In case of the lower gran-ular fill layer thicknesses (0.63), the differences between the results of Eq. (8) and Biswas et al. [27] were relatively more. According to minimum curvature point approach, the calcu-lated mean absolute percentage error (MAPE) values at that point were obtained maximum 25%, in case of H/D = 0.63 for different cohesion values As a result, increasing the thicknesses of granular fill layer for 1.15 and 1.67, caused a decrease in MAPE values for 1% and 13%, respectively.
The determination coefficient obtained from the Biswas et al. [27] and the predicted ultimate bearing capacities are given in Fig. 19. All the results in Fig 18 were evaluated together; the average coefficient of determination, as shown in Fig. 19 was obtained as 0.916.
Fig. 19 Correlations of the Eq. (8) and Biswas et al. [27]
The second comparison was done with the results of Dash et al. [28]. In that article, they have studied effectiveness of geo-cell reinforcement placed in the granular fill overlying soft clay beds by small-scale model tests in the laboratory. Five different series of tests (i.e. A–E) were carried out by varying different parameters such as, unreinforcement, width of geocell layer (b) and height of geocell layer (h) etc. Under series A, tests were conducted on unreinforced soil beds with different thickness (H) of the overlying sand layer.
The model footing used was rigid steel plate and had 150mm diameter (D) and 30mm thickness. The sand used in this inves-tigation was a dry sand and the friction angle of the sand at 70% relative density as determined from standard triaxial com-pression tests is found to be 41o. The tests were conducted for
clay bed in the 3.13 kPa undrained shear strength condition. The layered systems were comprised varying layer of sand thicknesses (H = 0.52D – 2.62D) overlying the clay subgrade.
In comparison between the results of Eq [8] and Dash et al. [28] for 0.94 and 1.36 H/D values according to limit ranges of this study, the behavior of the load-settlement ratios are in very good agreement as seen in Fig. 20. And also, the average MAPE values were obtained less than 10% at the point of 5% settlement ratio both of the H/D ratios.
Fig. 20 Comparison of q–s/D Relationship Between Eq. (8)
and Dash et al. [28]
The determination coefficient between the Dash et al. [28] and the predicted ultimate bearing capacities are given in Fig. 21. All the results in Fig 20 were evaluated together; the
y = x line was coincided with the q points. The average coefficient
of determination, as shown in Fig. 19 was obtained as 0.956.
Fig. 21 Correlations of the Eq. (8) and Dash et al. [28]
The last comparison was done with the results of Ibrahim [7]. This paper focuses on variable factors which affect the global bearing capacity such as: granular soil thickness, rela-tive density, foundation depth, footing size, and the extension of granular soil with respect to footing edge. The granular fill layer thickness (H) was tested for 0, B/2, B, 2B and 4B values.
Figure 22 shows the comparison between field observations and predicted results of load settlement curves for a rigid loaded circular plate with a diameter of B = 0.2 m and H/D ratios of 0.5 and 1.0. In the comparisons soil medium was in two different density conditions being medium to loose sand with ϕ = 35o and
very dense sand with ϕ = 45o overlain by soft clay c = 21 kPa.
Fig. 22 Comparison of q–s/D Relationship Between Eq. (8) and Ibrahim [7]
The behavior of the graphs shows that, both, the results of Eq[8] and Ibrahim [7], were in a non-linear form. In comparison between the results of Eq. (8) and Ibrahim [7] for 0.5 and 1.0
H/D values according to limit ranges in this study, the behavior
of the load- settlement ratios are quite close each other.
The average MAPE values in the point of minimum curvature are in the range of 4–10%. The determination coefficient of the data between predicted and Ibrahim [7] was obtained as 0.910.
Fig. 23 Correlations of the Eq. (8) and Ibrahim [7]
As mentioned earlier, the developed formulation was verifi-cated successfully, for the results of field tests which were not used to obtain the formula.
Also, from the comparisons of these formulation and the laboratory and field plate load test results from the literature, it can be concluded that the results are in a very good agreement to predict the behavior of convergence by different works in the literature.
7 Limitations
The results reported in the present study are valid only for the subsurface condition at the test location and for the thick-ness of the granular fill layer used in these tests. The size and scale effects of model foundations have not been investigated. Therefore these findings need additional verification before they can be applied to full-size foundations.
8 Conclusions
The bearing capacity of circular footings on granular fill layer over a soft clay soil was investigated using an empirical estimation method based on physical modelling in the labora-tory and at site. In general, the statistical analysis is performed when the experimental cases are difficult and the cost of con-structing and monitoring full-scale test embankments is quite high. To be able to this, the statistical model should be required verification and validation using experimental data.
On the basis of analysis of the results obtained from the pre-sent investigation, the following conclusions can be drawn: • The bearing capacity equations of circular footings with
partial replacement of granular fill layer as a soil improve-ment technique were never encountered during the literature review studies.
• From the laboratory and field test results, it is concluded that, the bearing capacity of the circular footing on granular fill layer over soft clay soil was increased up to 78% depend-ing on the granular fill layer thicknesses for the different footing diameters.
• For layered soil conditions investigated in this study, Equa-tion 8 reflects successfully the non-linear behavior of the observed load-deformation relationship, which is based on logarithmic approach.
• Eq. (8) takes into account of granular fill layer thickness, foundation depth, the rate of settlement, the foundation diameter, and the index and engineering parameters for weak ground and backfill material have taken into account by using Equation 1. Comparisons between the results of experimental studies and those of predictions by using Equation 8 are in very good agreement.
• The formulation was derived from 342 field data taken from 12 field tests. In addition to these, 184 field test data from 9 field tests and 403 laboratory model test data from 8 labora-tory tests were used to verify Eq. (8). In these comparisons, both of the experimental test groups were obtained with the average error rate of 5%. Thus, the field and laboratory test results were estimated with correlation coefficients better from than 0.97 by using Eq. (8).
• The most important parameter that affects the bearing capac-ity of remolded soils, is the value of cohesion. Although field tests have been developed using this approach, the approach is quite successful on the results of laboratory tests.
• The statistical method in determining the bearing capacity of layered soil, for a desired settlement ratio in which the stiff soil is above the weak layer, provides realistic results for the parameters considered in this study.
• The distribution of the bearing capacity of layered soil against the settlement ratio s/D, can be estimated reasonably and easily by using Eq. (8).
• Another advantage of the formulation, for the load steps that could not be reached as with IM-90-0.33D for any reason, the form of the curve can be successfully estimated by Eq. (8). • From the comparisons of these formulation and the
labora-tory and field plate load test results from the literature, it can be concluded that the results are in a very good agreement to predict the behavior of convergence by different works in the literature.
Acknowledgement
The project presented in this article is supported by TUBI-TAK (The Scientific and Technological Research Council of Turkey) grant number 106M496.
References
[1] Terzaghi, K. “Theoretical soil mechanics.” 510 p. John Wiley and Sons, Inc., New York, London. 1943. DOI: 10.1002/9780470172766
[2] Meyerhof, G. G. “The ultimate bearing capacity of foundations.”
Geotechnique. 2 (4) pp. 301-332. 1951. DOI: 10.1680/geot.1951.2.4.301
[3] Hansen, J. B. “A revised and extended formula for bearing capacity.” In: Bulletin No. 28. pp. 5-11. Danish Geotechnical Institute, Copenhagen. 1970. URL: http://trid.trb.org/view.aspx?id=125005
[4] Ochiai, H., Watari, Y., Tsukamoto, Y. “Soil reinforcement practice for fills over soft ground in Japan.” Geosynthetics International. 3 (1), pp. 31-48. 1996. DOI: 10.1680/gein.3.0052
[5] Otani, J., Hidetoshi, O., Yamamoto, K. “Bearing capacity analysis of reinforced foundations on cohesive oil.” Geotextiles and Geomembranes. 16 (4), pp. 195-206. 1998. DOI: 10.1016/S0266-1144(98)00005-3
[6] Yamamoto, K., Kusuda, K. “Failure mechanisms and bearing capacities of reinforced foundations.” Geotextiles and Geomembranes. 19 (3), pp. 127-162. 2001. DOI: 10.1016/S0266-1144(01)00003-6
[7] Kamal, M. H. I. I. “Bearing capacity of circular footing resting on granular soil over lying soft clay.” HBRC Journal. 12 (1), pp. 71-77. 2016. DOI: 10.1016/j.hbrcj.2014.07.004
[8] Verma, S. K., Jain, P. K., Kumar, R. “Prediction of Bearing Capacity of Granular Layered Soils by Plate Load Test.” International Journal
of Advanced Engineering Research and Studies. II (III), pp. 142-149.
2013. URL: http://www.technicaljournalsonline.com/ijaers/VOL%20II/ IJAERS%20VOL%20II%20ISSUE%20III%20APRIL%20JUNE%20 2013/318.pdf
[9] Thome, A., Donato, M., Consoli, N. C., Graham, J. “Circular footings on a cemented layer above weak foundation soil.” Canadian Geotechnical
Journal. 42 (6), pp. 1569-1584. 2005. DOI: 10.1139/t05-069
[10] Mosadegh, A., Nikraz, H. “Bearing Capacity Evaluation of Footing on a Layered‐Soil using ABAQUS.” Journal of Earth Science & Climatic
Change. 6 (3), pp. 1-8. 2015. DOI: 10.4172/2157-7617.1000264
[11] Ziaie, R. M., Rashidian,V., Izadi, E. “Evaluation on Bearing Capacity of Ring Foundations on two-Layered Soil.” World Academy of Science,
Engineering and Technology. 6, pp. 1108-1112. 2012. URL: http:// waset.org/publications/968/evaluation-on-bearing-capacity-of-ring-foundations-on-two-layered-soil
[12] Ornek, M., Laman, M., Demir, A., Yildiz, A. “Prediction of bearing capacity of circular footings on soft clay stabilized with granular soil.” Soils and Foundations. 52 (1), pp. 69-80. 2012. DOI: 10.1016/j. sandf.2012.01.002
[13] Calik, U., Sadoglu, E. “Engineering properties of expansive soil stabilized with lime and perlite.” Geomechanics and Engineering. 6 (4), pp. 403-418. 2014. DOI: 10.12989/gae.2014.6.4.403
[14] Ornek, M., Demir, A., Laman, M., Yildiz, A. “Numerical analysis of circular footings on natural clay stabilized with a granular fill.”Acta
Geotechnica Slovenica. 2012 (1), pp. 61-75. 2012. URL: http://www. fg.uni-mb.si/journal-ags/pdfs/ags_2012-1_article_4.pdf
[15] Demir, A., Örnek, M., Laman, M., Yildiz, A., Misir, G. “Model studies of circular foundations on soft soils.” In: Geotechnics of Soft
Soils: Focus on Ground Improvement. (Karstunen, M., Leoni, M.
(Eds)), pp. 219-226. Taylor & Francis Group, London. 2009. DOI:
10.1201/9780203883334.ch26
[16] Misir, G. “Granüler Stabilize Dolgu ile İyilestirilenYumusak Kil Zeminlere Oturan Temellerin Analizi.” (Analysis of Footing on Soft Clay Stabilized with a Granular Soil.) Master Thesis, Adana, 2008. (in Turkish) URL: http://library.cu.edu.tr/tezler/6890.pdf
[17] Laman, M., Yildiz, A., Ornek, M., Demir, A. “Geogrid reinforcement on soft clay deposit.” TUBITAK Scientific Research Project (No: 106M496), Ankara, Turkey, 528 p. 2009.
[18] ASTM International. “ASTM D1196-93. Standard test method for nonrepetitive static plate load tests of soils and flexible pavement components, for use in evaluation and design of airport and highway pavements.” 1997. URL: http://www.astm.org/Standards/D1196.htm
[19] El Sawwaf, M. A.“ Behavior of strip footing on geogrid reinforced sand over a soft clay slope.” Geotextiles and Geomembranes. 25, pp. 50-60. 2007. DOI: 10.1016/j.geotexmem.2006.06.001
[20] Chen, Q. “An experimental study on characteristics and behaviour of reinforced soil foundation.” PhD Thesis, Louisiana State University,
United States. 2007. URL: http://etd.lsu.edu/docs/available/etd-07092007-100545/unrestricted/Qiming_Dis.pdf
[21] Davarci, B., Ornek, M., Turedi, Y. “Analyses of multi-edge footings rested on loose and dense sand.” Periodica Polytechnica - Civil
Engineering. 58 (4), pp. 355-370. 2014. DOI: 10.3311/PPci.2101
[22] Adunoye, G. O., Agbede, O. A. “Bearing Capacity Determination by Multiple Regression.” Journal of Multidisciplinary Engineering Science
and Technology. 1 (5), pp. 285-291. 2014. URL: http://www.jmest.org/ wp-content/uploads/JMESTN42350261.pdf
[23] Latha, G. M., Somwanshi, A., Reddy, K. H. “A Multiple Regression Equation for Prediction of Bearing Capacity of Geosynthetic Reinforced Sand Beds.” Indian Geotechnical Journal. 43 (4), pp. 331-343. 2013. DOI: 10.1007/s40098-013-0053-7
[24] Jha, J. N., Choudhary, A. K., Gill, K. S., Shukla, S. K. “Bearing Capacity of a Strip Footing Resting on Reinforced Fly Ash Slope: An Analytical Approach.” Indian Geotechnical Journal. 43 (4), pp. 354-366. 2013. DOI:
10.1007/s40098-013-0059-1
[25] Laman, M., Uncuoglu, E. “Prediction of the moment capacity of pier foundations in clay using neural network.” Kuwait Journal of Science
&Engineering. 36 (1), pp. 33-52. 2009. URL: https://www.researchgate. net/publication/289747680_Prediction_of_the_moment_capacity_of_ pier_foundations_in_clay_using_neural_networks
[26] Onalp, A., Sert, S. “Geoteknik Bilgisi III, Bina Temelleri.”(Geotechnical Information III, Building Foundations.) BirsenYayınları, Istanbul. 2006. (in Turkish) URL: http://www.birsenyayinevi.com/geoteknik-bilgisi-3-bina-temelleri--akin-onalp---sedat-sert
[27] Biswas, A., Ansari, Md. A., Dash, S. K., Krishna, A. M. “Behavior of Geogrid Reinforced Foundation Systems Supported on Clay Subgrades of Different Strengths.” International J.ournal of Geosynthetics and
Ground Engineering. 1:20, 2015. DOI: 10.1007/s40891-015-0023-5
[28] Dash, S. K., Sireesh, S., Sitharam, T. G. “Model Studies on Circular Footing Supported on Geocell Reinforced Sand Underlain by Soft Clay.”
Geotextiles and Geomembranes. 21 (4), pp. 197-219. 2003. DOI: 10.1016/ S0266-1144(03)00017-7
![Fig. 2 SPT (N) Values Measured From Boreholes (Ornek et al. [14])](https://thumb-eu.123doks.com/thumbv2/9libnet/4555158.82970/2.892.487.791.455.652/fig-spt-n-values-measured-boreholes-ornek-et.webp)
![Fig. 4 Standard Proctor Curve for Granular Fill (Misir [16])](https://thumb-eu.123doks.com/thumbv2/9libnet/4555158.82970/3.892.60.445.465.530/fig-standard-proctor-curve-granular-misir.webp)


![Fig. 18 Comparison of q–s/D Relationship Between Eq. (8) and Biswas et al. [27]](https://thumb-eu.123doks.com/thumbv2/9libnet/4555158.82970/10.892.123.360.74.745/fig-comparison-d-relationship-eq-biswas-et-al.webp)
![Fig. 21 Correlations of the Eq. (8) and Dash et al. [28]](https://thumb-eu.123doks.com/thumbv2/9libnet/4555158.82970/11.892.530.771.71.755/fig-correlations-eq-dash-et-al.webp)
