Copyright © International Journal on New Trends in Education and Their Implications / www.ijonte.org 73
THE TURKISH ADAPTATION OF THE CONCEPTIONS OF LEARNING SCIENCE QUESTIONNAIRE:
THE STUDY OF VALIDITY AND RELIABILITY
Assist. Prof. Dr. Ozlem Sadi Karamanoglu Mehmetbey University Faculty of Education Department of Educational Sciences Karaman- TURKEY
Miray Uyar Hacettepe University Institute of Educational Sciences Department of Curriculum and Instruction Ankara- TURKEY
Abstract
The purpose of the present study is to translate the "Conceptions of Learning Science Questionnaire (COLS)" into Turkish language and also adapt and validate it. First, three English teachers translated the original questionnaire from English to Turkish. Later three other experts, blind to the original questionnaire performed a back translation from Turkish to English. Moreover, another expert conducted Turkish grammar check and made the necessary corrections. Later the questionnaire translated was prepared for validiy and reliability analyses. 415 students from Anatolian High Schools participated in the study. Construct validity was tested by exploratory factor analysis and confirmatory factor analysis. The reliability coefficient was calculated for each factor in the scale. For the analysis, SPSS 15 and Lisrel 8.72 software were used. When the analysis results were examined, it was seen that the Turkish version of the questionnaire had a 7-factor structure, which are memorizing, preparing for exams, calculating and practicing, increasing one’s knowledge, applying, understanding and seeing in a new way, like the original version. These factors together explain the 58.0% of the variance. In the Turkish version of the questionnaire, internal consistency for the questionnaire in general was calculated as 0.82 and Cronbach's alpha reliability coefficient for each factor varied between 0.65 and 0.82. As a result, it can be said that the Turkish-COLS is a reliable and valid scale that can be used to identify and categorize the framing conceptions of students in Turkish culture while they are learning science in general. Key Words: Conceptions of Learning Science Questionnaire, Path Model.
INTRODUCTION
One of the common aims of the research studies conducted in the field of science education today is to research the factors that affect students’ academic achievement and to reveal the ways to use these factors in favor of students and teachers. Especially, the recent studies conducted on such topics as the effect of cognitive and affective variables on academic achievement (Sadi & Uyar, 2013; Gürbüz, Çakmak & Derman, 2013; Demir, Öztürk & Dökme, 2012; Reyes, Brackett, Rivers, White & Salovery, 2012; Henning & Shulruf, 2011; Sadi & Çakıroğlu, 2011), metacognition (Whitebread et al., 2009; Topcu & Tüzün, 2009), approaches to learning (Chiou, Liang & Tsai, 2012; Bliuc, Ellis, Goodyear & Piggott, 2011) and epistemological beliefs (Tümkaya, 2012; Liang & Tsai, 2010; Brownlee, Purdie & Boulton-Lewis, 2001) stand out. In addition to these topics, another topic that the researchers focus on is the identification of students’ conceptions of learning. A lot of terms which are very close to each other in meaning are used to define conceptions of learning (Liang & Tsai, 2010; Purdie & Hattie, 2002; Meyer, 2001; Entwistle & Peterson, 2004; Benson & Bor, 1999). In general, it is
Copyright © International Journal on New Trends in Education and Their Implications / www.ijonte.org 74 emphasized that conceptions of learning have a certain hierarchy and that it can cover surface or quantitative learning and in-depth or qualitative learning (Entwistle & Peterson, 2004). Benson and Bor (1999) describe conception of learning as “what students think of the topics learned or learning process or of what they have learned.” According to Vermunt and Vermetten (2004), the conception of learning is learning and a consistent system of knowledge and beliefs on the events regarding learning. In other words, conception of learning might be a student’s individual learning goals, activities, responsibilities, strategies or what he/she thinks about the learning process. Buehl and Alexander (2001) and Tsai (2004) defined conception of learning as students’ beliefs about their school knowledge and learning, i.e. their academic epistemological beliefs. Moreover, Liang and Tsai (2010) defined conceptions of learning as students’ own learning experiences and their opinions about the ways they prefer.
The oldest study on conceptions of learning was conducted by Saljo (1979). Saljo made interviews with 90 university students and categorized conceptions of learning under five different categories. These categories are 1) increase of knowledge, 2) memorizing, 3) acquisitions of facts, procedures that can be retained and/or utilized in practice, 4) abstraction of meaning and 5) an interpretative process aimed at the understanding of reality. Recently a lot of researchers have conducted studies on students’ conceptions of learning with various student groups and on different subjects (Li, Liang & Tsai, 2013; Chiou et al., 2012; Yang & Tsai, 2010; Tsai & Khuo, 2008; Duarte, 2007; Liang & Tsai, 2010; Eklund-Myrskog, 1997). For example, Tsai (2004) conducted interviews with 120 high school students using phenomenographic method and divided conceptions of learning science under seven categories. These categories are (1) memorizing, (2) preparing for tests, (3) calculating and practicing the tutorial problems, (4) increase of knowledge, (5) applying, (6) understanding, and (7) seeing in a new way. As it was emphasized in the previous studies, Tsai (2004) stated that the categories he created had a certain hierarchy and defined the first three categories as “lower-level conceptions of learning” and the last four categories as “higher-level conceptions of learning.” In lower-level conceptions of learning, the student usually adopts learning conceptions of “memorizing” and “preparing for the exam.” However, in higher-level conceptions of learning, the student wants to apply the acquired knowledge and creates a new perspective with this knowledge. In addition, in their survey study Liang and Tsai (2010) analyzed the relationship between the epistemological beliefs and conceptions of learning of 407 Taiwanese science-major college students. In the findings of the study, it is stated that the students who are sophisticated in terms of their epistemological beliefs are found to be less consistent with lower-level conceptions of learning science, but more consistent with higher-level conceptions of learning. Another recent study is the quantitative study of Li and his colleagues (2013) with 369 chemistry-major college students. In this study, the link between students’ conceptions of learning and their learning approaches. The conceptions of learning chemistry of the students participated in the study are grouped under four categories and these categories are named as “memorizing”, “testing”, “calculating and practicing” and “transforming.” Moreover, according to the findings of the research study, the students who have a deep learning approach adopt higher level conceptions of learning, whereas the ones who have a surface learning approach adopt lower level conceptions of learning.
When the studies given above are analyzed, it is understood that in order to identify students’ conceptions of learning, both qualitative and quantitative studies were conducted and the link between the conception of learning and learning approaches and also its link to epistemological beliefs were revealed. Furthermore, the researchers who stated that the conception of learning might be related to the learning process, and thus learning outcomes (Hofer, 2001; Sinatra, 2001) emphasized that the conception of learning may also vary depending on cultural differences (Purdie, Hattie & Douglas, 1996; Tsai, 2004; Tsai, 2006; Tsai & Khuo, 2008). For example, different categories were formed for Australian and Japanese students’ conceptions of learning (Tsai, 2006, 2008). Similarly, in his studies, Li (2003) compared the learning conceptions of Chinese and American students and revealed that the conceptions of learning of Chinese students were related more to “seeking knowledge” because of Chinese cultural features. Therefore, it is important to conduct studies in different cultures and to identify the conceptions of learning of those students due to its contribution to the literature. In addition to this, the differences in educational contexts might have an effect on the formation of different conceptions of learning (Marshall, Summer & Woolnough, 1999; Trigwell & Ashwin, 2006; Tsai & Khuo, 2008; Tsai, 2004). In his study, Tsai (2004) claimed that the differences in educational contexts in high schools may cause differences in students’ conceptions of learning. Moreover, another important point emphasized by the researchers is that the conception of learning can be domain-specific. Duell and
Schommer-Copyright © International Journal on New Trends in Education and Their Implications / www.ijonte.org 75 Aikins (2001) and then Schommer-Aikins (2004) claimed that the conception of learning can be regarded as part of epistemological belief system. As a result, similar to domain-specific epistemological beliefs of students (Buehl & Alexander, 2001; Hofer, 2000), the conception of learning can also be domain-specific (Tsai, 2004; Tsai & Khuo, 2008). Chiou et al. (2012) emphasized that in order to closely analyze students’ conception of learning, it is necessary to do research in more specific domains.
As it is summarized in the studies above, the conception of learning might change depending on educational and cultural contexts and the topics to be researched. In this regard, the purpose of this study is to adapt “Conceptions of Learning Science” questionnaire, which was developed by Lee, Johanson and Tsai, (2008) and was used by them in their following studies, to Turkish and also to carry out analyses for reliability and validity. In this way, it will be possible to reach a big sample in Turkey, which is a meeting point for different cultures using the adapted version of “Conceptions of Learning Science” questionnaire and to identify the conceptions of learning of Turkish students.
METHOD Research Group
The research group of this study consists of 415 Anadolu (Anatolian) High School students who live in Karaman, a city in the south of Middle Anatolia Region. There are 225 girls (54.2%) and 190 boys (45.8%) in the research group. Moreover, 145 students in 9th grade (34.9%), 90 in 10th ((21.7%), 103 in 11th (24.8%) and 77 in 12th (18.6%) participated in the study.
Measures
In order to identify students’ conceptions of learning through quantitative methods, Lee and his colleagues (2008) developed the conceptions of learning science questionnaire. The authors sent the original version of the questionnaire that they have used in their following studies to the researchers via e-mail. In the original version of the questionnaire, there are 35 items measuring 7 sub-dimensions. The questionnaire items which are grouped under 7 factors are 1) memorizing (5th item), 2) preparing for an exam (6th item), 3) calculating and practicing (5th item), 4) increasing one’s knowledge (5th item), 5) application (5th item), 6) understanding (4th item) and 7) seeing in a new way (5th item). In “memorizing” dimension, students prefer to learn science by “memorizing” definitions, formulas and terms. For these students, learning is keeping the knowledge in mind and remembering it when necessary. In the secondfactor, students’ main goal in learning science is to “prepare for the exam” and getting high grades in the exams. In the third factor, students’ conceptions of learning is usually solving scientific problems and making quantitative calculations. In the 4th factor, students prefer to learn science in order to increase their knowledge. In the 5th factor, students define the purpose of learning science as applying the acquired knowledge to daily life. In the 6th factor, which is “understanding,” meaningful learning of scientific knowledge and forming links between concepts. In the last dimension, students gain a new perspective by learning science and find new ways of thinking. 5 point likert scale (strongly agree, agree, neither agree nor disagree, disagree and strongly disagree) was used in order to measure these factors in the questionnaire.
In this study, “Conceptions of Learning Science Questionnaire” is adapted to Turkish and necessary analyses were conducted. The term “science” was preferred since it refers to science and natural science (e.g. physics, chemistry and biology) and their features and methods like the word “science” in English.
The scale was translated from English to Turkish and then again from Turkish to English by three experts to make comparisons. Moreover, another expert conducted Turkish grammar check and made the necessary corrections. As a result of this stage, it was decided that there is consistency in meaning between the original and Turkish questionnaire by making some comparisons. The questionnaire was also prepared for validity and reliability analyses.
Data Analysis
Construct validity was tested by exploratory factor analysis and confirmatory factor analysis. The reliability coefficient (Cronbach Alfa) was calculated for each factor in the scale. For the analysis, SPSS 15 and Lisrel 8.72
Copyright © International Journal on New Trends in Education and Their Implications / www.ijonte.org 76 software were used. In order to test the suitability of the data collected from 415 high school students for factor analysis, Kaiser-Meyer-Olkin (KMO) and Bartlett’s Sphericity tests were applied. KMO coefficient gives information about whether data matrix is suitable for factor analysis or not and whether data structure is suitable for factor subtraction. For factorability, KMO is expected to be higher than .50 (Field, 2000). Since the value obtained from KMO test was 0.871 and this value was close to 1, it was possible to model the data by factor analytical model (Tavşancıl, 2005). Bartlett’s test shows whether there is relationship between the
variables basing on partial correlations (Büyüköztürk, 2011). After Bartlett’s Sphericity test, the Ki-Square (χ²)
was found to be 4651.92 (p < 0.01) and zero hypothesis was rejected. The fact that the result of Bartlett’s test was meaningful shows that there is a normal distribution of the data with many variables and thus it is suitable
for factor analysis (Çokluk, Şekercioğlu & Büyüköztürk, 2010).
RESULTS
Exploratory Factor Analysis
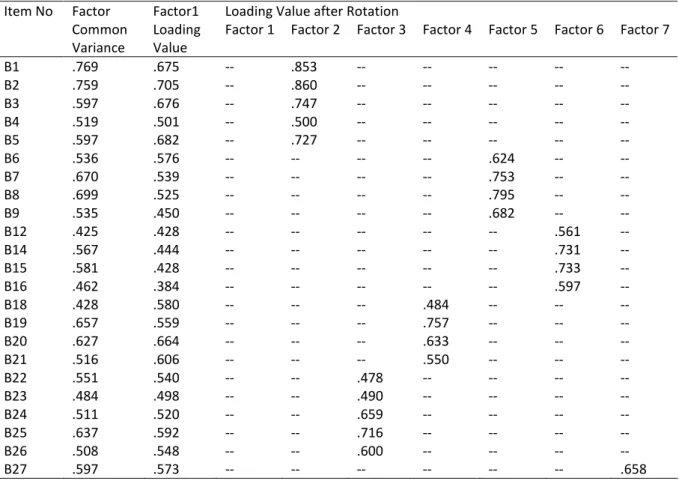
According to the results of factor analysis which was conducted to examine the construct validity of the Turkish adaptation of the “The Conceptions of Learning Science” questionnaire, 10th, 11th, 13th and 17th items of the scale were removed from the scale since these items loaded on more than one factor or their factor loadings were under 0.45. After these items were removed from the scale, the same analysis was repeated by using SPSS 15.0 statistical package for the remaining 31 items. The results of the analysis are given in Table 1. Table 1a: KMO and Bartlett’s Test Results
Kaiser-Meyer-Olkin Measure of Sampling Adequacy. .871
Ki Square 4651.923
sd 465
Bartlett’s Test of Sphericity
p .000
Table 1b: Factor Analysis Results of the Scale
Loading Value after Rotation Item No Factor Common Variance Factor1 Loading Value
Factor 1 Factor 2 Factor 3 Factor 4 Factor 5 Factor 6 Factor 7
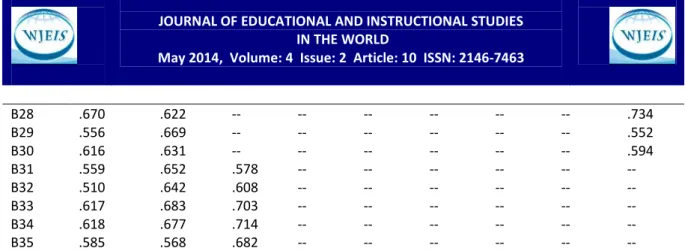
B1 .769 .675 -- .853 -- -- -- -- -- B2 .759 .705 -- .860 -- -- -- -- -- B3 .597 .676 -- .747 -- -- -- -- -- B4 .519 .501 -- .500 -- -- -- -- -- B5 .597 .682 -- .727 -- -- -- -- -- B6 .536 .576 -- -- -- -- .624 -- -- B7 .670 .539 -- -- -- -- .753 -- -- B8 .699 .525 -- -- -- -- .795 -- -- B9 .535 .450 -- -- -- -- .682 -- -- B12 .425 .428 -- -- -- -- -- .561 -- B14 .567 .444 -- -- -- -- -- .731 -- B15 .581 .428 -- -- -- -- -- .733 -- B16 .462 .384 -- -- -- -- -- .597 -- B18 .428 .580 -- -- -- .484 -- -- -- B19 .657 .559 -- -- -- .757 -- -- -- B20 .627 .664 -- -- -- .633 -- -- -- B21 .516 .606 -- -- -- .550 -- -- -- B22 .551 .540 -- -- .478 -- -- -- -- B23 .484 .498 -- -- .490 -- -- -- -- B24 .511 .520 -- -- .659 -- -- -- -- B25 .637 .592 -- -- .716 -- -- -- -- B26 .508 .548 -- -- .600 -- -- -- -- B27 .597 .573 -- -- -- -- -- -- .658
Copyright © International Journal on New Trends in Education and Their Implications / www.ijonte.org 77 B28 .670 .622 -- -- -- -- -- -- .734 B29 .556 .669 -- -- -- -- -- -- .552 B30 .616 .631 -- -- -- -- -- -- .594 B31 .559 .652 .578 -- -- -- -- -- -- B32 .510 .642 .608 -- -- -- -- -- -- B33 .617 .683 .703 -- -- -- -- -- -- B34 .618 .677 .714 -- -- -- -- -- -- B35 .585 .568 .682 -- -- -- -- -- --
In Table 1b, it is seen that the 31 items that are analyzed are grouped under 7 factors whose Eigenvalue is over 1. These factors explain the 58% of the total variance regarding the scale. The common variance of the seven factors defined in relation to these items varied between 0.425 and 0.769. This situation is seen in Figure 1. According to the results of the analysis, the seven factors together that appeared as important factors in the analysis explain most of the total variance in the items and the variance regarding the questionnaire.
Figure 1: Scree plot graphic
As it is seen in scree plot graphic (Figure 1), there is an accelerated fall until the seventh factor and this fall has a high acceleration after the first and the second factors and after the third factor this acceleration decreases. From the graphic above, it is seen that the scale can be a 7-factor scale.
According to the rotated component matrix analysis given in Table 1b, it was found that the first factor of the scale consisted of five items (B31, B32, B33, B34, B35); the second factor consisted of five items (B1, B2, B3, B4, B5); the third factor consisted of five factors (B22, B23, B24, B25, B26); fourth factor consisted of four items (B18, B19, B20, B21); the fifth factor consisted of four items (B6, B7, B8, B9); sixth factor consisted of four items (B12, B14, B15, B16) and the seventh factor consisted of four items (B27, B28, B29, B30). The loading values of the items in the first factor varied between .578-.714, in the second factor between .500-.860, in the third factor .478-.716, in the fourth factor .484-.757, in the fifth factor .624-.795, in the sixth factor .561-.733 and in the seventh factor between .552-.734. When the contents of the items loaded on the factors were analyzed, depending on the names given in the original version of the questionnaire, the first factor was named “Seeing in a new way”, the second factor “memorizing”, the third factor “applying”, the fourth factor “increasing one’s knowledge”, the fifth factor “preparing for exams”, the sixth factor “calculating and practicing”, and the seventh factor “understanding.”
Moreover, regarding the reliability of the “Conceptions of Learning Questionnaire,” Cronbach's alpha reliability coefficient was found to be 0.82. The item numbers and Cronbach's alpha reliability coefficients for each sub-dimension are given in Table 2.
Copyright © International Journal on New Trends in Education and Their Implications / www.ijonte.org 78 Table 2: The Reliability Results regarding the factors of the Conception of Learning Science Questionnaire
Factors Item Numbers
Cronbach's Alpha Internal Consistency Coefficients
Factor-1 Seeing in a new way 5 .81
Factor -2 Memorizing 5 .82
Factor -3 Applying 5 .74
Factor -4 Increasing One’s Knowledge 4 .74
Factor -5 Preparing for the exam 4 .74
Factor -6 Calculating and Practicing 4 .65 Factor -7 Understanding 4 .77
Total 31 .82
According to Büyüköztürk (2011), the internal consistency coefficient gives the lowest value that reliability is allowed to have and in social sciences a general reliability value over 0.70 is considered satisfactory to make the test points reliable. When the values in Table 2 are considered, it can be said that the reliability of the test is satisfactory.
Findings of Confirmatory Factor Analysis
In the study, exploratory factor analysis, which is the performance of identifying factor loadings by using the relationships between the variables, was made on 35 items in the scale. After the exploratory analysis, confirmatory factor analysis was performed on the reduced 31 items with the help of Lisrel 8.72 analysis software. In confirmatory factor analysis, it is aimed to test the hypothesis which is formulated on the relationship between the variables (Büyüköztürk, 2011).
In the first stage of the confirmatory factor analysis performed on the seven hidden variables determined by the exploratory factor analysis and the 31 indicator variables of the questionnaire, the suitability and modification indices of the model were examined. According to the result of this analysis, values of x² = 929.08 and sd= 413 were found. It is accepted that the suitability of the scale increases as the x2/sd ratio gets lower than 5:1 ratio (Haşlaman, 2005). When the ratio obtained from the study was examined, the ratio was found to be lower than 5:1 and thus it was seen that the suitability was acceptable although it was not high. When the suitability indices of Root Mean Square Errror of Approximation (RMSEA); the goodness of fit index (GFI); comparative fit index (CFI) and normed fit index (NFI) were analyzed, the values of RMSEA=.055; GFI=0.87; CFI=0.95; NFI=0.92 were found. Since the RMSEA value was greater than .05 (a cut-off rule) and the GFI suitability index was smaller than 0.90, it was understood that the model needed some modifications to have high suitability (Vierra, 2011).
In order to identify on which items the modification would be performed, first path model was examined. Path model reveals the relationship between each observed variable and the corresponding factors (Albright, 2006). According to the model, the value of the relationship of the “memorizing” factor in the scale with B1 observed factor was found to be 1.17 and with B2 it was 1.16, with B3 0.90, with B4 0.49, with B5 0.83. The value of the relationship of the factor of “preparing for the exam” with B6 variable was 0.74, and with B7 it was 1.20, with B8 1.03, with B9 0.73. The value of the relationship of the factor “calculating and practicing” with B12 was 0.67, and with B14 it was 0.78, with B15 0.90, with B16 0.61. The value of the relationship of the factor of “increasing knowledge” with B18 was 0.68, and with B19 it was 0.60, with B20 0.74, with B21 0.72. The value of the relationship of the factor “applying” with B22 variable was 0.74, and with B23 it was 0.67, with B24 0.69, with B25 0.75, with B26 0.67. The value of the relationship of the factor of “understanding” with B27 variable was 0.60, and with B28 it was 0.73, with B29 0.79, with B30 0.69. Finally, the value of the relationship of the factor of “seeing in a new way” with B31 variable was 0.66, and with B32 it was 0.72, with B33 0.80, with B34 0.76, with B35 0.68.
Copyright © International Journal on New Trends in Education and Their Implications / www.ijonte.org 79 In order to determine whether the values (predictions) showing the relationship between the factor and the variable were meaningful or not, for each relationship standard error value which was calculated in the path model and the relationship value were compared. As a result of this, the fact that the values showing the relationship were at least the twice of the standard error value shows that each relationship constructed in the path model had a meaningfulness level of .05. Moreover, when the calculated variance (R2) value for each observed variable was examined, it was concluded that all variables had a high compatibility with the model. R2 values were minimum 0.15 and maximum 0.75. All these obtained values shows that the predictions made for the path model were correct. Therefore, in order to increase the compatibility of the model, it is not necessary to remove the existing predictions from the model.
Finally, in order to increase the compatibility of the model, modification indices were analyzed and it was aimed to contribute to the improvement of the model by decreasing x2 value through additional links formed between factors and variables. The modification indices which were analyzed for this purpose revealed that some of the variables in the scale had a relationship with more than one factor. Based on this, in addition to the links formed in the first path model, links between B6 variable and the factor of memorizing and calculating, between B23 variable and preparing for an exam, between B4 and B22 variables and calculating and practicing, between B21 and B27 variables and applying, and finally between B31 variable and understanding were formed. After the modifications mentioned above were made, the compatibility indices and modification index of the newly constructed model were examined with the help of Lisrel 8.72 analysis software once more. According to the analysis result, x² =778.03 and sd=405 (p=.00) values were obtained. When these values were compared with the results obtained from the previous model, they show that the model had a higher compatibility since these values were lower than the ratio of 5.1. When the other compatibility indices were analyzed, it was seen that the new model was more compatible with the data (RMSEA=.047; GFI=0.90; CFI=0.96; NFI=0.93).
The path model of the confirmatory factor analysis is given in Figure 2. As it is seen in Figure 2, the relationship value of the “memorizing” factor in the scale with B1 (R²=0.72) observed variable was found to be 1.17, with B2 (R²=0.75) 1.17, with B3 (R²=0.48) 0.90, with B4 (R²=0.21) 0.42, with B5 (R²=0.39) 0.83;
The relationship value of “preparing for the exam” factor with B6 (R²=0.33) variable was 0.63, with B7 (R²=0.62) 1.20, with B8 (R²=0.58) 1.05, with B9 (R²=0.27) 0.72;
The relationship value of “calculating and practicing” factor with B4 variable was 0.32, with B6 0.28, with B12 (R²=0.24) 0.66, with B14 (R²=0.39) 0.82, with B15 (R²=0.46) 0.87, with B16 (R²=0.25) 0.61, with B22 0.28; The relationship value of “increasing knowledge” factor with B18 (R²=0.35) variable was 0.67, with B19 (R²=0.43) 0.66, with B20 (R²=0.59) 0.76, with B21 (R²=0.39) 0.48;
The relationship value of “applying” factor with B21 variable was 0.31, with B22 (R²=0.41) 0.59, with B23 (R²=0.37) 0.73, with B24 (R²=0.32) 0.70, with B25 (R²=0.45) 0.77, with B26 (R²=0.34) 0.68, with B27 0.28; The relationship value of “understanding” factor and B27 (R²=0.33) variable was 0.35, with B28 (R²=0.41) 0.70, with B29 (R²=0.53) 0.80, with B30 (R²=0.53) 0.74, with B31 0.49;
Finally, the relationship value of “seeing in a new way” factor with B31 (R²=0.48) variable was 0.23, with B32 (R²=0.44) 0.71, with B33 (R²=0.55) 0.82, with B34 (R²=0.56) 0.78, with B35 (R²=0.36) 0.70.
Moreover, t-values of the variables are given on another path model (Image 3). As it is seen in Image 3, t-value of B1 variable was 20.15; of B2 20.71; of B3 18.29; of B4 6.58; of B5 13.37; of B6 3.52; of B7 15.71; of B8 16.31; of B9 10.26; of B12 9.05; of B14 11.73; of B15 12.81; of B16 9.09; of B18 12.05; of B19 13.53; of B20 16.35; of B21 3.71; of B22 9.36; of B23 11.72; of B24 11.42; of B25 11.86; of B26 15.86; of B27 13,45; of B28 15.82; of B29 15.78; of B30 14.07; of B31 5.79; of B32 14.27; of B33 16.49; of B34 16.53; of B35 12.43. As a result, the findings of the analysis reveal that the model formed for the factor structure of the scale is valid.
Copyright © International Journal on New Trends in Education and Their Implications / www.ijonte.org 80 Figure 2: The path analysis and factor loading values of the questionnaire according to the confirmatory factor analysis
Copyright © International Journal on New Trends in Education and Their Implications / www.ijonte.org 81 Figure 3: t-values of the variables
Copyright © International Journal on New Trends in Education and Their Implications / www.ijonte.org 82 CONCLUSIONS AND DISCUSSIONS
In this study, the “Conceptions of Learning Science Questionnaire”, which was developed by Lee and his colleagues (2008), was adapted to Turkish and exploratory and confirmatory factor analyses were conducted to examine its factor structure. 415 students from Anadolu High Schools participated in the study. While in the original version of the questionnaire, there are 35 items, after the adaptation there are 31 items in the Turkish version. Basing on the factor analysis, 4 items (item 10, 11, 13 and 17) which were below the item loading of 0.45 and were overlapping were removed from the questionnaire.
In order to evaluate the suitability of the questionnaire for Turkish students, its construct validity was examined by exploratory factor analysis. Moreover, confirmatory factor analysis was conducted for the factor structure. When the analysis results were examined, it was seen that the Turkish version of the questionnaire had a 7-factor structure like the original version. Therefore, while naming the newly determined 7-factors, names in the original version, which are memorizing, preparing for exams, calculating and practicing, increasing one’s knowledge, applying, understanding and seeing in a new way, were preferred. These factors together explain the 58.0% of the variance.
In the Turkish version of the questionnaire, internal consistency for the questionnaire in general was calculated as 0.82 and Cronbach's alpha reliability coefficient (α) for each factor varied between 0.65 and 0.82. The minimum point that a person can get in the questionnaire is 31 and the maximum is 155. As a result, under the light of the analyses conducted, it can be said that the “Conceptions of Learning Science Questionnaire” is a reliable and valid scale that can be used to identify and categorize the framing conceptions of students in Turkish culture while they are learning science in general.
It is thought that the COLS will be useful for education researchers and people who are interested in this field. It is important to apply the questionnaire to different samples, and then, to conduct reliability and validity tests for the standardization of the questionnaire.
In the research studies conducted, it was emphasized that there might be a close relationship between students’ conceptions of learning and their learning approaches and learning outcomes (Tsai & Khuo, 2008). Therefore, it is crucial to identify students’ conceptions of learning and to look for alternative solutions if the lower-level conceptions of learning (for example, if students conceptualized learning science as practice of memorization, tests, and calculations) are dominant. Curriculum developers, teachers and even parents should spend a considerable effort to reflect on the evaluation of the curriculum, varying teaching methods and techniques and implementing them effectively and creating a better understanding of their children In further studies, with the help of adapted questionnaires of this kind, how students conceptualize learning science should be determined by identifying students’ conceptions of learning science. Under the light of the findings of these studies, students, teachers and parents should make concrete inferences regarding the learning process, learning approach and learning outcomes and, if necessary, they should come up with solutions.
REFERENCES
Albright, J. J. (2006). Confirmatory factor analysis using AMOS, LISREL, and MPLUS. The Trustees of Indiana University. USA. Avaliable at: http://www.iub.edu/~statmath/stat/all/cfa/cfa2008.pdf.
Benson, P. & Lor, W. (1999). Conceptions of Language and Language Learning System. Brown, H.D. (Ed.), in
Principles and Practices of Language Learning and Teaching (p.459-472). NJ: Prentice Hall.
Bliuc, A.M., Ellis, R.A., Goodyear, P., & Piggott, L. (2011). A blended learning approach to teaching foreign policy: student experiences of learning through face-to-face and online discussion and their relationship to academic performance. Computers & Education, 56 (3), 856-864.
Copyright © International Journal on New Trends in Education and Their Implications / www.ijonte.org 83 Brownlee, J., Purdie, N., & Boulton-Lewis, G. (2001). Changing epistemological beliefs in pre- service teacher education students. Teaching in Higher Education, 6 (2), 247-268.
Buehl, M.M., & Alexander, P.A. (2001). Beliefs about academic knowledge. Educational Psychology Review, 13, 325-351.
Büyüköztürk, Ş.. (2011). Sosyal Bilimler için Veri Analizi El Kitabı: İstatistik, Araştırma Deseni, SPSS Uygulamaları
ve Yorum (12.baskı). Ankara: Pegem.
Chiou, G.L., Liang, J.C., & Tsai,C.C. (2012). Undergraduate students' conceptions of and approaches to learning in biology: a study of their structural models and gender differences. Int. J. Sci. Educ., 34, 167-195.
Çokluk, Ö., Şekercioğlu, G. & Büyüköztürk, Ş. (2010). Sosyal Bilimler için Çok Değişkenli İstatistik. Tek ve Çok
Değişkenli Dağılımlar için Sayıltıların Analizi, Lojistik Regresyon Analizi, Diskriminant Regresyon Analizi, Küme Analizi, Açımlayıcı Faktör Analizi, Doğrulayıcı Faktör Analizi, Yol Analizi. Ankara: Pegem.
Demir, R. ,Öztürk N. & Dökme İ. (2012). İlköğretim 7. sınıf öğrencilerinin fen ve teknoloji dersine yönelik motivasyonlarının bazı değişkenler açısından incelenmesi. Mehmet Akif Ersoy Üniversitesi Eğitim Fakültesi
Dergisi, 23, 1 - 21.
Duarte, A.M (2007). Conceptions of learning and approaches to learning in portuguese students. Higher
Education, 54, 781-794.
Duell, O.K. & Schommer-Aikins, M. (2001). Measures of people's beliefs about knowledge and learning.
Educational Psychology Review, 13(4), 419-449.
Eklund-Myrskog, G. (1997). The influence of the educational context on student nurses' conceptions of learning and approaches to learning. British Journal of Educational Psychology, 67 (3), 371-381.
Entwistle, N. J., & Peterson, E. R. (2004). Conceptions of learning and knowledge in higher education: Relationships with study behaviour and influences of learning environments. International Journal of
Educational Research, 41, 407-428. doi:10.1016/j.ijer.2005.08.009.
Field A., (2000). Discovering Statistics Using SPSS for Windows: Advanced Techniques for the Beginner. London, England: Sage.
Gürbüz, H., Çakmak, M. & Derman, M. (2013). Biyoloji öğretmen adaylarının sürdürülebilir çevreye yönelik tutumları. Türk Bilimsel Derlemeler Dergisi, 6 (1), 144-149.
Haşlaman, T., (2005). Programlama Dersi İle İlgili Öz-düzenleyici Öğrenme Stratejileri İle Başarı Arasındaki
İlişkilerin İncelenmesi: Bir Yapısal Eşitlik Modeli. (Unpublished Master Thesis), Hacettepe Üniversitesi/Fen
Bilimleri Enstitüsü, Ankara.
Henning, M. A., & Shulruf, B. (2011). Academic achievement: Changes in motivational beliefs and self-regulated learning strategies over time. Psychologia, 54 (3), 135-144.
Hofer, B.K. (2000). Dimensionality and disciplinary differences in personal epistemology. Contemporary
Educational Psychology, 25, 378-405.
Hofer, B.K. (2001). Personal epistemology research: Implications for teaching and learning. Journal of
Educational Psychology Review, 13(4), 353-383.
Lee M. H., Johanson R. E. & Tsai C. C., (2008), Exploring Taiwanese high school students' conceptions of and approaches to learning science through a structural equation modeling analysis. Sci. Educ., 92, 191-220.
Copyright © International Journal on New Trends in Education and Their Implications / www.ijonte.org 84 Li, J. (2003). US and Chinese cultural beliefs about learning. Journal of Educational Psychology, 95, 258-267. Li, W.T., Liang, J.C., & Tsai, C.C. (2013). Relational analysis of college chemistry-major students' conceptions of and approaches to learning chemistry. Chemistry Education Research and Practice, 14, 555-565. doi: 10.1039/c3rp00034f.
Liang, J. C., & Tsai C. C. (2010). Relational analysis of college science-major students' epistemological beliefs toward science and conceptions of learning science. Int. J. Sci. Educ., 32, 2273-2289.
Marshall, D., Summer, M., & Woolnough, B. (1999). Students' conceptions of learning in an engineering context. Higher Education, 38, 291-309.
Meyer, J. H. F. (2001). An overview of the development and application of the Reflections on Learning Inventory. Paper presented at the RoLI symposium, Imperial College, London, 25 July.
Purdie, N., Hattie, J., & Douglas, G. (1996). Student conceptions of learning and their use of self-regulated learning strategies: a cross-cultural comparison. Journal of Educational Psychology, 88, 87-100.
Purdie, N., & Hattie, J. (2002). Assessing students' conceptions of learning. Australian Journal of Educational
and Developmental Psychology, 2, 17-32.
Reyes, M.R., Brackett, M.A., Rivers, S. E., White, M. & Salovey, P.(2012). Classroom emotional climate, student engagement, and academic achievement. Journal of Educational Psychology, 104(3), 700-712. doi: 10.1037/a0027268.
Sadi, Ö., & Cakiroğlu, J. (2011) Effects of hands-on activity enriched instruction on students' achievement and attitudes towards science. Journal of Baltic Science Education, 10(2), 87-97.
Sadi, Ö., & Uyar, M. (2013). Relationship between self-efficacy, self-regulated learning strategies and achievement: A path model. Journal of Baltic Science Education,12(1), 21-33.
Saljo, R., (1979). Learning in the Learner's Perspective I: Some Commonsense Conceptions. (Unpublished Master Thesis). Institute of Education/University of Gothenburg, Gothenburg, Sweden.
Schommer-Aikins, M. (2004). Explaining the epistemological belief system: Introducing embedded systemic model and coordinated research approach. Educational Psychologist, 39, 19-29.
Tavsancıl, E. (2005). Tutumların Ölçülmesi ve SPSS ile Veri Analizi. (ikinci Baskı). Ankara: Nobel Yayınları.
Topcu, M. S., & Yılmaz-Tuzun, O. (2009). Elementary students' metacognition and epistemological beliefs considering science achievement, gender and socioeconomic status. Elementary Education Online, 8(3), 676-693.
Trigwell, K. & Ashwin, P. (2006) An exploratory study of situated conceptions of learning and learning environments. Higher Education 51, 243-258.
Tsai, C.C., (2004). Conceptions of learning science among high school students in Taiwan: A phenomenographic analysis. International Journal of Science Education, 26 (14), 1733-1750. doi: 10.1080/0950069042000230776. Tsai, C.C. (2006). Biological knowledge is more tentative than physics knowledge: Taiwan high school adolescents' views about the nature of biology and physics. Adolescence, 41, 691-703.
Copyright © International Journal on New Trends in Education and Their Implications / www.ijonte.org 85 Tsai, C.-C., (2008). Standards of Judging Online Information, Searching Strategies and Learning Outcomes From Online Inquiry Science Activities. Y. J. Lee & A. L. Tan (Eds.), In Science Education at the Nexus of Theory and
Practice (pp. 135-154). Rotterdam, Netherlands: Sense.
Tsai, C.C. & Khuo, P.C., (2008). Cram school students' conceptions of learning and learning science in Taiwan. International Journal of Science Education, 30(3), 353-375.
Tümkaya, S, (2012). The investigation of the epistemological beliefs of university students according to gender, grade, fields of study, academic success and their learning styles. Educational Sciences: Theory & Practice,
12(1), 88-95.
Vermunt, J. D. & Vermetten, Y. J., (2004). Patterns in student learning: relationships between learning strategies, conceptions of learning, and learning orientations. Educational Psychology Review, 16(4), 359-383. Vieira, A. L. (2011). Interactive LISREL in Practice. Getting Started With a SIMPLIS Approach. US: Springer. Whitebread, D., Coltman, P., Pasternak, D. P., Sangster, C., Grau, V., Bingham, S., Almeqdad, Q., & Demetriou, D. (2009). The development of two observational tools for assessing metacognition and self-regulated learning in young children. Metacognition and Learning, 4(1), 63-85. http://dx.doi.org/10.1007/s11409-008-9033-1. Yang, Y.F., & Tsai, C.C.(2010). Conceptions of and approaches to learning through online peer assessment.