Research paper
Archaeometric investigation of the Late Chalcolithic-Early Bronze Age I
and the 1st
–2nd millennium BCE potteries from Kuriki-Turkey
Murat Bayazit
a,⁎
, Iskender I
şık
b, Ali Issi
b, Elif Genç
ca
Department of Ceramics, Faculty of Fine Arts, Batman University, Central Campus, 72060 Batman, Turkey
bDepartment of Materials Science & Engineering, Faculty of Engineering, Dumlupınar University, Evliya Çelebi Campus, 43100 Kütahya, Turkey c
Department of Archaeology, Faculty of Science and Letters, Çukurova University, 01330 Adana, Turkey
a b s t r a c t
a r t i c l e i n f o
Article history: Received 22 January 2016
Received in revised form 8 March 2016 Accepted 14 March 2016
Available online xxxx
In this study, potsherds belonging to the Late Chalcolithic-Early Bronze Age I and the second half of the 2nd mil-lennium BCE-beginning of the 1st milmil-lennium BCE from Kuriki (Turkey) were investigated. Energy dispersive X-rayfluorescence and X-ray diffraction were performed for chemical and mineral/phase analysis, respectively. Micro-Raman spectroscopy, optical microscopy and thermal gravimetric-differential thermal analysis were used as complementary techniques. Scanning electron microscopy and energy dispersive X-ray spectrometry were also performed for micro structural and micro chemical characterization. Results showed that mainly illitic and occasionally smectitic type of clays were used. Andesite, basalt, granite and limestone were found as the main sources of the minerals identified in the samples. Considering the decomposition and formation of the minerals, the results showed that potsherds were exposed tofiring temperatures changing between 750 °C–950 °C. SEM images showed that the potsherds have a quite poor vitrification degree and heterogeneous grain distribution suggesting a simplefiring technique. The results of this study suggested that despite a long time vacancy from the Late Chalcolithic-Early Bronze Age I to the second half of the 2nd millennium BCE, the ceramic production technology was presumably not changed drastically in Kuriki.
© 2016 Elsevier B.V. All rights reserved.
Keywords: Archaeometric characterization X-ray methods Spectroscopy TG-DTA Electron microscopy Kuriki Mound (Turkey)
1. Introduction
Being the most encountered materials in excavations, ceramics have a substantial importance in enlightening the history of humanity and are frequently used in archaeometry which has a wide range of use in characterizing ancient materials in order to reveal their chemical, phys-ical, optphys-ical, thermal or other specific properties (Krapukaitytė et al., 2008). Thus, it provides information regarding the characteristics of an-cient civilizations. Having a multidisciplinary study, archaeometry gathers different branches of the science, and commonly uses elemen-tal/chemical analyses, thermal analysis methods, electron microscopy techniques, vibrational spectroscopy and dating methods (Striova et al., 2006; Mangone et al., 2009; Issi et al., 2011).
Surrounded by two important rivers (Euphrates and Tigris), Meso-potamia has been the homeland for numerous civilizations thanks to its fertile nature and has witnessed significant cultural interactions among the communities throughout the history (Postgate, 1994). Dated back to the Late Chalcolithic period, the Kuriki Mound is one of the ancient residential sites in upper Mesopotamia (Genc, 2013). The mound is located approximately 15 km far away from the city of Batman
in southeastern Anatolia (Fig. 1). Today, the Ilısu Dam will flood the mound as soon as its construction is completed. Consequently, many ancient materials and architectures will be lost by the time. In archaeo-logical excavations carried out in Kuriki since 2009, a great number of ceramics (potteries), metal goods and skeleton ruins, also some graves in various sizes have been unearthed mainly from four different settle-ment layers (i: the Late Chalcolithic-Early Bronze Age I; ii: after a long period of abandonment, the second occupation occurred from the sec-ond half of the 2nd millennium BCE to beginning of the 1st millennium BCE; iii: from the 1st millennium BCE (particularly towards the end of it) to beginning of thefirst millennium CE; iv: the first millennium CE, respectively) (Genc, 2013). As seen from the chronological order of the mound there is a significant undefined gap (about 1500 years) after the Late Chalcolithic-Early Bronze Age I period which would sug-gest that people have abandoned the region due to unknown reasons (i.e. natural disaster, war, invasion). The second archaeological layer representing the re-settlement evidences of the residents may imply that people have not left their land voluntarily, because in case of that they would not return. Today, the agricultural activities carried out by the villagers around Kuriki may support this prediction indicating that the territory was probably convenient for agriculture at that time and there was not any acceptable reason to leave. Furthermore, the location area of Kuriki covering the intersection point of the Batman Creek and the Tigris, which would be used for various purposes (i.e.fishing,
⁎ Corresponding author at: Batman University, Faculty of Fine Arts, Department of Ceramics, Central Campus, 72060 Batman, Turkey.
E-mail address:[email protected](M. Bayazit).
http://dx.doi.org/10.1016/j.clay.2016.03.013 0169-1317/© 2016 Elsevier B.V. All rights reserved.
Contents lists available atScienceDirect
Applied Clay Science
transportation, irrigation), may also imply such interpretation. In brief, the replacement of the residents would be attributed to two main rea-sons; i:flooding of the territory by the creek and/or river would have made the area uninhabitable; ii: the presence of Mitanni and the middle Assyrian, which were two of the political powers in the upper Tigris re-gion at certain intervals, would have forced the people to move through more secured residential areas (Wilhelm, 1989).
In addition to the previous archaeometric studies (Bayazit et al., 2014; Bayazit et al., 2015) applied for the ancient ceramics belonging to different periods of the mound, this study aims to elucidate the pro-duction technologies (i.e. maximumfiring temperature, firing atmo-sphere, raw materials) of some representative potsherds from different archaeological settlement layers of the Kuriki Mound (Late Chalcolithic-Early Bronze Age I and the second half of the 2nd millen-nium BCE-beginning of the 1st millenmillen-nium BCE). The results will also be evaluated by means of archaeometric approach in order to reveal whether the ceramic technology has changed after about 1500 years or continued as it was.
2. Materials and methods 2.1. Samples
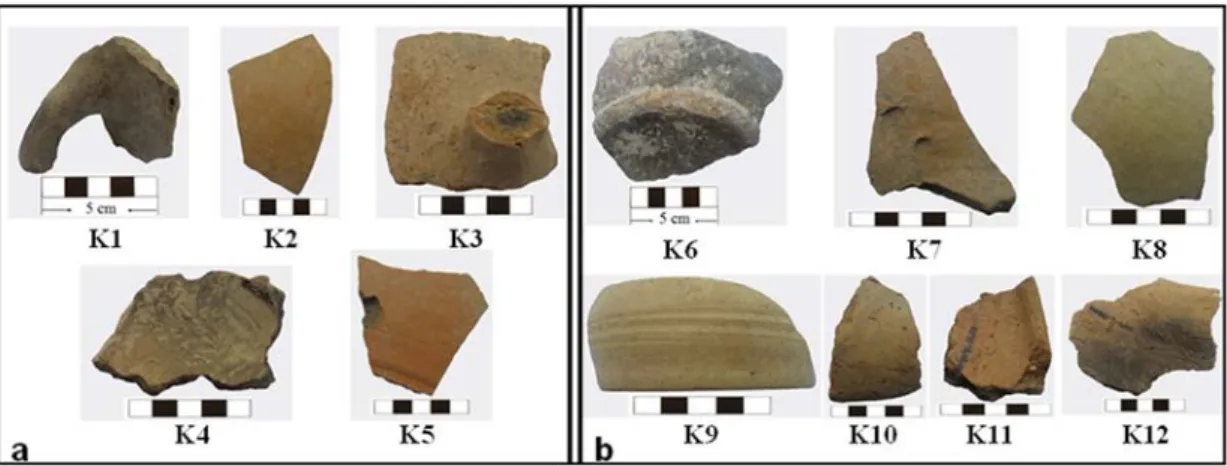
The representative samples were selected from the third (K1–K5; between the second half of the 2nd millennium BCE and beginning of the 1st millennium BCE, abbreviated as“MBC”) and fourth (K6–K10; the Late Chalcolithic, abbreviated as“LC” — K11–K12; Early Bronze Age I, abbreviated as“EBA1”) archaeological settlement layers of the mound, respectively (Fig. 2a–b). In selection process of the potsherds it was aimed to choose the most suitable fragments which would repre-sent the whole ensemble of pottery unearthed in the related archaeo-logical settlement layers of the mound. The decisive parameters in this stage were the colors (including the interior-exterior layers and the core), corresponding forms (i.e. bowl, pitcher, plate, cup, vase, casse-role) and the macro structural properties (i.e. inclusions, gaps, grain and pore size/distribution, thickness, characteristic evidences of pro-duction; wheel or handmade) of the ceramicfindings. Sample types in-vestigated in this research are handle, rim, bottom, neck and edge of the wares. Potsherds have the colors of grey, buff, light reddish and brown. There is nofigure or coloring on the samples. So, it can be assumed that these wares have been produced for simple purposes and daily use. The description of the samples is given inTable 1.
2.2. Methods
Potsherds werefirstly purified from their contaminations which were thought to be occurred mostly due to the burial conditions. Sam-ples were ground in an agate mortar to be analyzed by energy disper-sive X-rayfluorescence (EDXRF), X-ray diffraction (XRD) and thermal gravimetric-differential thermal analysis (TG-DTA) techniques.
By using the mixture of sample powder (4 g) and binder (0.9 g HWC: Hoechst Wax C), tablets were prepared under the pressure of 105N in
order to utilize for chemical analysis of major and minor elements. EDXRF was carried out by Spectro X-Lab 2000 instrument. Rigaku Miniflex powder diffractometer with Cu Kα radiation was used for the mineralogical analysis. XRD patterns were obtained with a goniometer speed of 2/min and by scanning 2–70° 2θ values. Jade software was used for the assessment process of XRD patterns.
A Leica Research Polarizing Microscope (DMLP Model) was per-formed in optical microscopy analysis to investigate the outer and inner layers of the samples using top and bottom illumination. Having ×25 magnification with single and double nicol, a Leica DFC280 digital camera was utilized for the thin section images of the samples. Assess-ment of the results was carried out through a Leica Qwin digital imaging program. The Point Counting method was used for the identification of rock/clay types.
Fig. 1. A representative map showing the location of the mound.
The chromametrical analysis of the potsherds was carried out by Commission Internationale de L'Eclairage (CEI) color system (l: white/ black; a: red/green; b: yellow/blue intensities) using a portable colorim-eter equipped with ColorQA Pro System III.
Horiba Jobin Yvon LabRam confocal Raman spectrograph equipped with Olympus BX41 microscope and Peltier cooling CCD
(1024 × 256 pixels) detector was used to obtain Raman spectra of rep-resentative potsherds. 632.8 nm laser line of a He/Ne laser was employed for Raman excitation by also keeping the laser power below 700μW using density filters to avoid sample degradation. The samples were analyzed in situ without pre-treatment. Raman spectra were ob-tained with 10× and 100× objectives which allow 65 and 4 mm work-ing distance, respectively and the correspondwork-ing effective powers measured at the sample position were 315 and 286μW respectively. The spectrograph had a focal length of 800 mm, a grating of 1800 grooves mm−1, and confocal pin hole was set at 100μm. This condition and excitation at 632.8 nm gave an average spectral resolution of 2 cm−1over the range 50–3000 cm−1. The sample spot size was of
the order of about 0.2μm, in accordance with objective used. At least 20 spectra were recorded for each specimen, focusing on different points of the sample surface for each detected component. Polarization of the incident laser beam was selected parallel to the preferential do-main orientation of samples (y) and spectra were collected in a strict backscattering geometry. Microscopic images of the sample area ob-served prior to the spectral collection with the position of focal point for each spectrum were taken by a Raman PCI model video camera.
Thermal gravimetric and differential thermal analyses (TG-DTA) were simultaneously performed by Netzsch STA 449F3 instrument sup-ported by the Netzsch proteus software. Samples were heated from room temperature to 1100 °C in oxidizing atmosphere with 10 °C/min heating rate. Zeiss Supra 50VP SEM, equipped with Oxford Instruments INCA Energy EDS detector, was used to investigate micro structural and micro chemical features of the representative potsherds and to obtain backscattered electron (BSE) images in which the contrast difference is obvious.
3. Results
3.1. Chemical and mineralogical analyses 3.1.1. XRF results
Since the minerals are thefingerprints identifying both the current and neo-formation phases in ceramics, determination of chemical and mineralogical contents of the potteries allow reaching the details of raw materials used in the production processes (Perez-Arantegui et al., 2004). According to the EDXRF results (Table 2), it was seen that some of the samples belonging to both periods have relatively high amounts of CaO up to 22.63 wt.% (for the LC-EBA1 potteries) and 22.44 wt.% (for the MBC potteries). Samples have the amounts of MgO varying between 3.20 and 7.04 wt.% (LC-EBA1) and 3.60–4.97 wt.% (MBC). The MgO content would be originated from dolomite [CaMg (CO3)2] and/or the clay deposit (probably containing chlorite or Mg
bearing minerals). The vicinity of Kuriki is surrounded by mine deposits rich in calcareous raw materials (MTA Turkey, official website, 2013a;
Table 1
Definition of the samples.a
Sample code/type: K1 / handle, rim. Maximum thickness: 9.89 mm Body color: buff/grey. Equivalent color: L: 33.30, a: 11.07, b: 23.12 Small inclusions and gaps.
Sample code/type: K7 / rim. Maximum thickness: 8.60 mm Red exterior layers with a black core. Equivalent color:
L: 41.93, a: 15.29, b: 42.45 Elongated gaps in various sizes. Off–white inclusions
Visible cavities on the surface (~0.5–1 cm) Sample code/type: K2 / rim.
Maximum thickness: 5.91 mm Dark grey/black core with brownish–red exterior layers.
Equivalent color: L: 39.93, a: 8.28, b: 31.47 Visible off–white inclusions. Small elongated gaps on the surface.
Sample code/type: K8 / rim. Maximum thickness: 6.36 mm Light greenish exterior layer and red/brown interior layer.
Equivalent color: L: 43.14, a: 14.07, b: 33.53 Small gaps.
Visible inclusions. Sample code/type: K3 / handle, rim.
Maximum thickness: 11.86 mm Grey core with brownish–red exterior layers.
Equivalent color: L: 38.85, a: 10.68, b: 30.22 Small inclusions and elongated gaps.
Sample code/type: K9 / edge, rim. Maximum thickness: 3.75 mm Body color: buff/light brown. Equivalent color: L: 47.76, a: 4.74, b: 34.60 Small inclusions.
Evident traces of a possible wheel–made production. Thought to be Ninevite 5 sherd Sample code/type: K4 / rim.
Maximum thickness: 13.59 mm Body color: buff/black. Equivalent color: L: 19.86, a: 2.68, b: 15.72 Small inclusions and gaps. Seems like directly exposed to fire.
Sample code/type: K10 / rim. Maximum thickness: 17.59 mm Greenishbrown exterior layer, brown interior layer and red core. Equivalent color: L: 40.95, a: 17.79, b: 39.76
Evident presence of irregular shaped gaps. Ignorable amount of visible inclusions. Sample code/type: K5 / rim.
Maximum thickness: 8.43 mm Red–brown exterior layer and black–grey interior layer.
Equivalent color: L: 44.02, a: 16.80, b: 43.09 Visible burial contaminations. Traces of a possible wheel–made production.
Sample code/type: K11 / rim. Maximum thickness: 10.43 mm Brownish–red exterior layers with a black core.
Equivalent color: L: 34.76, a: 15.77, b: 32.53 Clear appearance of shapeless gaps. Ignorable amount of visible inclusions.
Sample code/type: K6 / bottom. Maximum thickness: 18.73 mm Red–brown interior layer and black–grey exterior.
Equivalent color: L: 34.74, a: 26.11, b: 35.19 Visible off–white inclusions.
Sample code/type: K12 / rim. Maximum thickness: 10.85 mm Brownish–red exterior layer and black–grey interior layer.
Equivalent color: L: 27.55, a: 9.25, b: 23.42
Evident existence of elongated gaps (up to around 2–2.5 cm).
Very small inclusions.
a: (K1–K5: MBC; K6–K10: EBA1; K11, K12: LC)
Table 2
EDXRF results of the samples.
Oxide (wt.%) MBC samples EBA1 samples LC samples
K1 K2 K3 K4 K5 K6 K7 K8 K9 K10 K11 K12 SiO2 59.24 55.39 52.08 48.18 49.23 64.48 50.12 57.63 49.63 55.48 55.25 54.06 Al2O3 13.65 13.81 12.25 12.33 11.61 16.40 11.30 13.59 12.72 14.67 12.81 13.35 CaO 10.97 12.52 17.83 22.44 21.92 3.55 22.63 12.22 14.94 7.20 14.01 13.49 Fe2O3 8.22 7.57 7.25 7.25 7.12 7.86 7.53 8.06 8.76 8.75 8.75 7.27 K2O 2.39 2.16 2.37 2.14 2.03 2.03 2.72 2.22 2.23 3.27 3.16 2.96 MgO 3.60 4.79 4.97 4.51 4.88 3.20 4.11 4.06 7.04 5.76 3.89 4.71 Na2O 0.13 2.44 1.90 1.76 1.90 1.01 0.13 0.70 2.93 2.91 0.12 2.55 P2O5 0.47 0.20 0.25 0.17 0.19 0.25 0.19 0.31 0.38 0.45 0.42 0.25 SO3 0.08 0.15 0.17 0.20 0.11 0.12 0.29 0.08 0.26 0.24 0.14 0.24 Cl− 0.02 0.04 0.02 0.06 0.05 0.03 0.09 0.03 0.16 0.14 0.06 0.18 TiO2 1.04 0.77 0.77 0.79 0.78 0.87 0.75 0.89 0.73 0.92 1.24 0.77 V2O5 0.02 0.02 0.02 0.01 0.02 0.02 0.02 0.03 0.03 0.03 0.03 0.02 Cr2O3 0.03 0.03 0.03 0.05 0.03 0.05 0.03 0.06 0.04 0.04 0.03 0.03 MnO 0.14 0.11 0.09 0.11 0.13 0.13 0.09 0.12 0.15 0.14 0.09 0.12
2013b; 2013c). For the samples having high amount of CaO (≥10 wt.%), it may be considered that the most probable origin of CaO was particu-larly the calcareous materials (i.e. calcite or dolomite).
K2O quantities change between 2.03 and 3.27 wt.% for the LC-EBA1
potteries and 2.03–2.39 wt.% for the MBC potteries. Na2O quantities
change between 0.12 and 2.93 wt.% (LC-EBA1) and 0.13–2.44 wt.% (MBC). It is thought that K2O and Na2O might have been originated
from clay minerals such as muscovite and illite or from potassium feld-spars and plagioclases, respectively. Fe2O3content of the samples varies
between 7.27 and 8.76 wt.% for the LC-EBA1 potteries and 7.12– 8.22 wt.% for the MBC potteries. Considering the chemical analysis re-sults of the potsherds belonging to two different periods, it was pre-dicted that while the MBC and LC potteries would have been produced using similar clay deposits, the EBA1 potteries showed an ev-ident variety in amounts of CaO (3.5 and 7.20 wt.% for the samples of K6 and K10, respectively) and MgO (7.04 wt.% for the sample of K9)
indicating that different clay deposits (one of which resembles to that of MBC and LC groups) were probably used for the samples.
3.1.2. XRD results
XRD results showed that the samples have similar mineralogical and phase contents with few differences (Table 3). According to the results quartz, feldspar (K-feldspar and plagioclase) were established in all samples. Calcite, iron mineral (hematite), clay minerals (illite/musco-vite), pyroxenes (diopside/augite) and gehlenite (a member of melilite group) were also identified from XRD patterns of the samples.
As minerals are the evidences for stable and metastable solid phases, the determination of these compositions and the neo-formations is the keynote for archaeometric investigation of ancient ceramics (Krapukaitytė et al., 2008). Thus, knowledge of decomposition of pres-ent minerals and formation of new phases allow us to estimate thefiring temperatures of the potteries. This information will also assist to unveil the production techniques and technologies of the ancient civilizations. For instance, calcite begins to decompose at 650 °C and calcium oxide (CaO) is formed while carbon dioxide (CO2) is released (Shoval,
2003). Decarbonation of calcite may extend to 1000–1100 °C for calcite rich systems and/or in case of the grains of the mineral are coarse and the heating rate is rapid (Trindade et al., 2009). Moreover, depending on burial conditions, calcite may exist as secondary calcite in ancient ce-ramics due to the gradual interactions of hygroscopic lime (CaO)-mois-ture and calcium hydroxide [Ca(OH)2]-atmospheric CO2, respectively
(Shoval et al., 2003). Illite/muscovite structure begins to lose its hy-droxyl group at around 700 °C, and complete breakdown of the dehydroxylated illite/muscovite occurs about 850–950 °C (Maritan et al., 2005). Thus, the presence of these minerals indicates a maximum firing temperature of 900–1000 °C. After the collapse of illite structure, an intermediate phase between hercynite (FeO·Al2O3) and spinel
(MgO·Al2O3) occurs (Jordan et al., 1999). Quartz and feldspars can
per-sist above 1000 °C (Iordanidis et al., 2009). Gehlenite appears as a result of reaction of illite and CaO at around 800–850 °C (Cultrone et al., 2001). Pyroxenes (e.g. augite and diopside) and anorthite (CaAl2Si2O8) may be
formed at 850–950 °C through the reaction between silica and carbon-ated materials (Issi, 2012). Constitution of all these neo-formations may also be affected byfiring types used in the production.Maritan et al. (2006)concluded that while calcite decomposition ends around 875 °C in pitfiring, it is completed about 825 °C in kiln firing conditions. Apart from thefiring technique, type of mineral/phases and their amounts, firing atmosphere, soaking time and maximum firing
Table 3
XRD results and estimated maximumfiring temperatures of the potsherds. Sample
code
Mineral/phases Estimated
maximumfiring temperature (°C) K1 Quartz, feldspar, plagioclase, calcite, pyroxene,
gehlenite, hematite
850–950 K2 Quartz, feldspar, plagioclase, calcite, pyroxene,
gehlenite, hematite
850–950 K3 Quartz, feldspar, plagioclase, calcite,
illite/muscovite
750–850 K4 Quartz, feldspar, plagioclase, calcite,
illite/muscovite
750–850 K5 Quartz, feldspar, plagioclase, calcite,
illite/muscovite
750–850 K6 Quartz, feldspar, plagioclase, pyroxene, gehlenite,
hematite
850–950 K7 Quartz, feldspar, plagioclase, calcite,
illite/muscovite
750–850 K8 Quartz, feldspar, plagioclase, calcite, pyroxene,
hematite
850–950 K9 Quartz, feldspar, plagioclase, pyroxene, hematite 850–950 K10 Quartz, feldspar, plagioclase, calcite,
illite/muscovite, pyroxene, hematite
800–900 K11 Quartz, feldspar, plagioclase, calcite,
illite/muscovite, hematite
750–850 K12 Quartz, feldspar, plagioclase, calcite,
illite/muscovite
750–850
temperature are thought to be the other key factors leading the decom-position and formation reactions.
One of the most remarkable results of XRD analysis is that calcite and pyroxenes were found together in some potsherds (K1, K2, K8 and K10) (Table 3). Samples of K1 and K2 also have gehlenite in addition to py-roxenes. K1, K2, K6, K8 and K9 do not include clay minerals. The samples of K6 and K9 do not include calcite. Thus, these two samples were thought to befired at the highest temperature (~850–950 °C). As the samples of K3, K4, K5, K7, K11 and K12 include both calcite and clay minerals, it is considered that these samples should have been subjected to afiring temperature not higher than 750–850 °C.
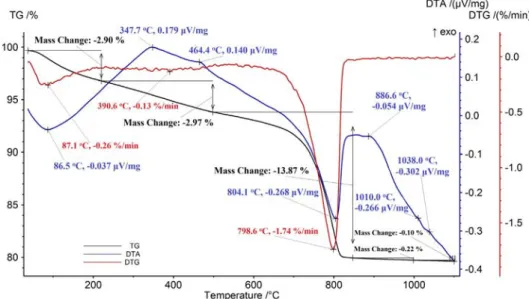
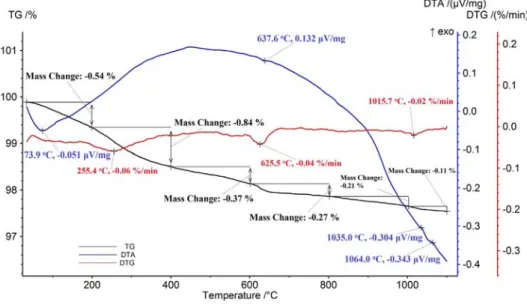
The calcite content of the samples was also confirmed by TG-DTA curves. Endothermic peak around 800 °C indicated to decarbonation oc-curred in the sample K4 (Fig. 3) (Leach et al., 2008; Moropoulou et al., 1995). This endothermic effect was not observed on the DTA curve of the sample K9 (Fig. 4) which does not include calcite and distinctly have characteristic pyroxene (augite) peaks in its XRD pattern (Fig. 5). According to the detailed TG-DTA results given inTable 4, the weight loss values in the range of 400–600 °C and 200/300–500 °C were assigned to the dehydroxylation of clay minerals (from 0.16 to 2.97%) (Meyvel et al., 2012). The weight losses varying from 0.27 to 13.87% at
500/600–800 °C were attributed to the decomposition of carbonated materials (mainly calcite and then dolomite; the most preferred carbon-ated temper materials in ancient pottery production) (Meyvel et al., 2012; Drebushchak et al., 2005; Carretero et al., 2002). The negligible fluctuation on TG curves above 850 °C (N800 °C for the sample K7) sug-gested that the reactions, which would indicate a transformation and/or decomposition in ceramic matrix, were limited (Krapukaitytė et al., 2008; Meyvel et al., 2012). The enthalpy changes at 700–825 °C (endo-thermic effects on DTA curves) indicating to decomposition of carbon-ated materials such as calcite and dolomite were compatible with the XRD results (Moropoulou et al., 1995).
Another decisive phase found in the samples is iron minerals which allow us to estimate thefiring atmosphere (Van der Weerd et al., 2004). The presence of hematite in the samples of K1, K2, K6, K8, K9, K10 and K11 suggested that thefiring process of these samples have presumably been ended in oxidizing atmosphere. It is also known that sandwich structured samples (red/brown exterior layer with black/grey interior layer or red/brown margin with a black/grey core) would appear in two ways; i:firing in reducing atmosphere and then cooling in oxidizing atmosphere, ii:firing in oxidizing atmosphere with high amounts of or-ganic materials (Bong et al., 2008). Organic material contents of some
Fig. 4. TG-DTA curve of the sample K9.
samples have been revealed through the DTA curves by the characteris-tic broad exothermic effects (Figs. 3–4) in the range of 200–600 °C (Leach et al., 2008; Moropoulou et al., 1995). Therefore the samples of K2, K3, K4, K5, K7, K8, K11 and K12 are believed to befired in an open-air environment instead of a stablefiring technique such as kiln firing. It is thought that these samples, most likely, have been subjected to both reducing and oxidizing atmosphere during thefiring process. Absence of any ceramic kiln in the mound so far supports this prediction.
Iron mineral content of the samples was also confirmed by micro-Raman analysis. Magnetite, hematite and quartz were detected from the micro-Raman spectrum of the representative sample K2 (Fig. 6). It is known that the type and amount of iron in raw material, and also thefiring conditions are the decisive parameters in clarifying the color of the potsherds (Nodari et al., 2007). Since hematite was detected by both XRD and Raman spectroscopy of this sample (K2), and additionally
due to its buff color, itsfiring process would presumably be ended in an oxidizing atmosphere.
3.1.3. Optical microscopy results
Petrographic investigation was carried out as a complementary technique in the present work in order to reveal the clay type used in the manufacture of the potteries and also to investigate the macro struc-tural features of the shards (i.e. porosity, aggregate content). The results showed that the potsherds were mainly produced with illitic and occa-sionally with smectitic clay types (Table 5). Quartz was identified in all samples. Opaque minerals (hematite, magnetite), plagioclase and chert were identified in most of the samples. Other minerals occasionally found were biotite, chalcedony, muscovite, opal and sericite. Andesite (extrusive igneous rock), basalt (effusive igneous rock), granite (felsic intrusive igneous rock), quartzite and limestone (sedimentary rock) identified in some of the samples suggested that such rock types were
Table 4 TG-DTA results.
Sample code
Weight loss (wt.%) Enthalpy change Weight loss (wt.%) Dehydroxylation of clay minerals (400–600 °C) Decomposition of carbonated materials (600–800 °C) Decomposition of carbonates (endothermic)(700–825 °C) Transformation and/or decomposition reactions (N850 °C) Total (25–1100 °C) K1 0.36 1.28 723.6 °C (vw) −0.040 μV/mg 0.19 3.15 K2 1.17 2.93 701.3 °C (vw) 0.001μV/mg 1.22 7.70 K3 1.69 9.62 786.3 °C (m) −0.169 μV/mg 0.29 14.99 K4 2.97 (200–500 °C) 13.87 (500–800 °C) 804.1 °C (s) −0.268 μV/mg 0.32 20.06 K5 0.91 9.39 787.2 °C (m) −0.215 μV/mg 0.28 13.26 K6 0.16 0.35 – 0.16 1.26 K7 1.47 (200–500 °C) 7.42 (500–800 °C) 763.6 °C (m) −0.126 μV/mg 2.46 (N800 °C) 13.29 K8 0.44 1.02 739.0 °C (vw) 0.016μV/mg 0.22 2.88 K9 0.37 0.27 – 0.32 2.34 K10 0.62 (300–500 °C) 1.73 (500–800 °C) 705.5 °C (w) 0.046μV/mg 0.16 3.43 K11 1.74 7.53 768.8 °C (m) −0.180 μV/mg 0.14 12.92 K12 1.18 6.07 750.8 °C (m) −0.082 μV/mg 0.40 10.78
presumably the main sources of the minerals characterized in the pot-tery samples.
The aggregate content of the samples changes from 3 to 45 vol.%, but averagely around 20% (excluding K9; 3%), probably indicating a rough preparation process for the raw materials chosen within the pottery production. The very low aggregate content of the sample K9 might be attributed to a different production technology which may refer to a non-local product (most likely transferred through the commercial links). The form (Fig. 2b) and thickness (Table 1) of the sample K9,
and the evident presence of the pyroxene together with the absence of carbonates and clay minerals (indicating relatively a higherfiring temperature range in comparison with the most of the samples; see Table 3) might also be confirmative for such prediction.
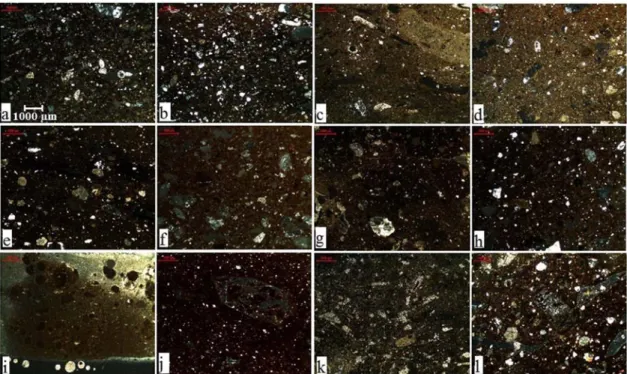
Thin section images (Fig. 7) were considered to assess the structural integrity of the samples (i.e. grain/pore size and distribution) and also to investigate the matrix (i.e. secondary calcite, grog, color transitions).
It is known that clay deposits may contain non-plastic materials (i.e. quartz, feldspars and iron compounds) and in addition to that content some calcareous or organic materials (plant residues, shells etc.) can also be used as temper materials in order to strengthen the structure of earthen wares during shaping, drying and firing processes (Carretero et al., 2002; Shepard, 1985). Grog, which can be defined as ground/crushed fragments of the residual ceramic wares, and dried/ fired clay may also be used as temper materials in order to control the evaporation during the drying andfiring processes (Loftfield, 1976; Rice, 1987). In some cases, dried orfired clays may turn into a compact mass, which is hard to pulverize, and tend to create“clay lumps” in ce-ramic paste which is thought to be occur especially due to an inattentive raw material preparation process (i.e. insufficient grinding) (Saffer, 1979). This phenomenon may generally happen for the clays which get so tough after drying and then become very hard to grind (i.e. coastal clays), thus they might be used without any refinement (Saffer, 1979). Although the discrimination of grog and clay lumps would be occasionally difficult due to some of their common features (i.e. internal microstructure, particle size and distribution), color and particle angularity can be used to differentiate such materials (Cuomo di Caprio and Vaughan, 1993; Herbert and Smith, 2010). In the present study, the probable existence of such temper materials was observed in most of the samples; K1 (Fig. 7a), K2 (Fig. 7b), K4 (Fig. 7d), K5 (Fig. 7e), K6 (Fig. 7f), K7 (Fig. 7g), K8 (Fig. 7h), K10 (Fig. 7j) and K12 (Fig. 7l). The presence of grog/rock fragments and clay lumps may be assigned to recycling process of manufacture errors and use of gravel/sand (or coastal clay) probably supplied from the rivers' bed (Tigris and Batman Creek), respectively. These results would indicate that the raw materials have presumably not been exposed to any further process (i.e. refining or enrichment) in addition to the arrangement process of the starting
Table 5
Petrography results of the potsherds. Sample code Aggregate (vol.%) Porosity (vol.%)
Clay type Minerala Rockband
grog (%) K1 21 7 Illitic + smectitic Q, Pl, Ch A, B, G, L K2 21 7 Illitic + smectitic Q, Pl, Ch A, B, G, L K3 17 9 Illitic Q, Pl, Ch, Op L K4 10 4 Illitic Q, Pl, Ch, Op L K5 21 7 Illitic + smectitic Q, Pl, Ch A, B, G, L K6 31 7 Illitic Q, Pl, Op, Sr Grog (%1,5) K7 18 3 Smectitic Q, Pl, Op,
Ch
G K8 31 7 Illitic Q, Pl, Op, Sr Grog (%1,5)
K9 3 4 Illitic Q, Op, Ch, O – K10 20 5 Illitic Q, Pl, Ch, Bi, Ms – K11 23 5 Illitic + kaolinitic Q, Pl, Ch, Op, Cy – K12 45 12 Illitic Q, Pl, Ch, Op Qs –: not defined.
aBi: biotite, Ch: chert, Cy: chalcedony, Ms: muscovite, O: opal, Op: opaque minerals
(e.g. hematite, magnetite), Pl: plagioclase, Q: quartz, Sr: sericite.
b
A: andesite, B: basalt, G: granite, L: limestone, Qs: quartzite.
Fig. 7. Microphotograph of the sample of (a) K1, (b) K2, (c) K3, (d) K4, (e) K5, (f) K6, (g) K7, (h) K8, (i) K9, (j) K10, (k) K11 and (l) K12. (For interpretation of the references to color in this figure, the reader is referred to the web version of this article.)
materials. Finally, it was also macroscopically identified that some of the samples (i.e. K7, K10) have elongated gaps on their surfaces which were again attributed to use of non-plastic materials (i.e. straw, grass).
Opposite to such kind of macro structures there are also some sam-ples having low non-plastic/matrix ratio (Fig. 7c, d, i, j, k) suggesting a well condensed structure which might be assigned to; i: wellfired
body, ii: refined raw materials, iii: use of materials which may react as flux during the firing process resulting in occurrence of a compact struc-ture (Hajjaji et al., 2002).
The black/dark grey matrix observed in the microphotographs of the samples of K1 (Fig. 7a), K2 (Fig. 7b), K5 (Fig. 7e), K7 (Fig. 7g), K8 (Fig. 7h) and K10 (Fig. 7j) suggested that these samples have
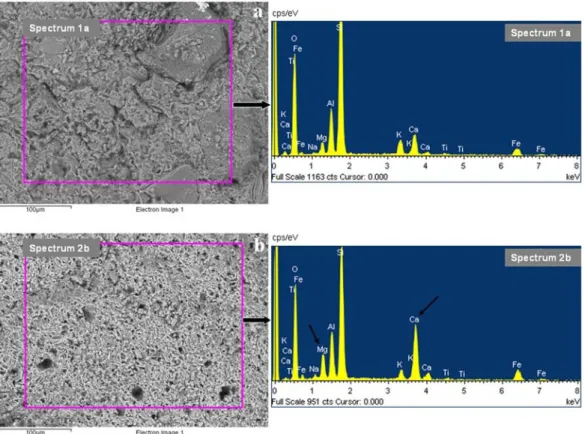
Fig. 8. Representative BSE images and EDS spectra of the samples of (a) K2 and (b) K9.
presumably beenfired in a reducing atmosphere in which oxygen pen-etration would drastically been limited most likely due to thefiring technology used by the potters. The color transition from dark to light shades of red/brownish colors seen in the microphotographs of the samples of K3 (Fig. 7c), K4 (Fig. 7d), K7 (Fig. 7g) and K8 (Fig. 7h) was at-tributed to an inhomogeneousfiring environment resulting in fluctua-tion in oxygen diffusion into the ceramic fabrics which would occur due tofiring technique (i.e. pit firing, kiln firing) directly affecting the ultimate color of the product (Van der Weerd et al., 2004; Issi, 2012). The position of ceramic body during thefiring process (i.e. closeness to the flame) might also be the other decisive factors for such formations.
Finally the potential existence of secondary calcite (with an irregular distribution throughout the ceramic fabric) was observed in micropho-tographs of some samples (Fig. 7a, b, c, e, h, j, l). Considering the decom-position of carbonates and formation of new phases, the simultaneous presence of neo-formations (pyroxenes and gehlenite) and calcite iden-tified by XRD analyses of the samples of K1, K8, K10 (Table 3) suggested that the secondary calcite have probably occurred due to the precipita-tion of calcium carbonate from the soluprecipita-tionflowing in the burial envi-ronment or decomposition of gehlenite during the burial time (Fabbri et al., 2014). The latter possibility (though it is a rare or less probable phenomenon) may be valid especially for the samples of K1 and K2 in which gehlenite - inclined to transform into calcite and/or wairakite (Fabbri et al., 2014) - was identified (seeTable 3).
3.2. Micro structural analysis
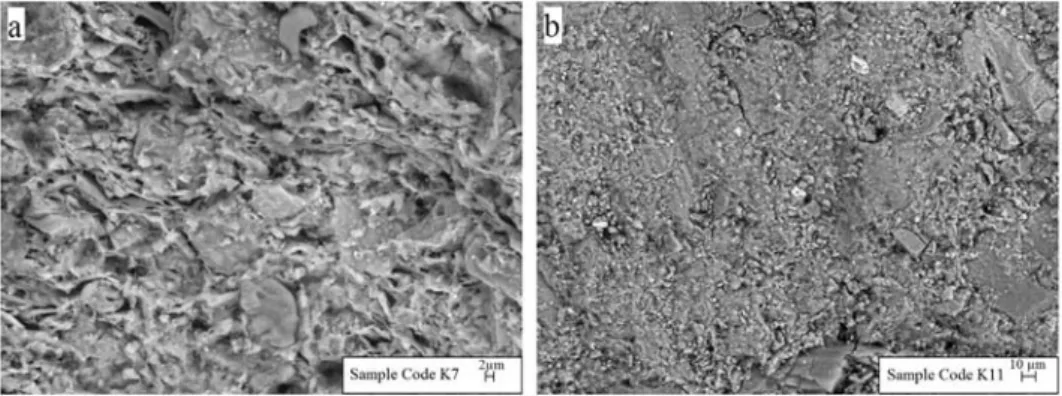
It is known that, in clay based ceramics, as the temperature in-creases; grains change their shapes due to the interactions with clay matrix, then aggregation rate increases with the generation of second-ary porosity, andfinally intergranular bonds occur (Issi, 2012). Thus, some mineralogical, structural and textural changes happen during the firing process particularly in case of existence of carbonates (Riccardi et al., 1999). XRF and XRD results showed that most of the samples include relatively high amounts of CaO and calcite, respectively. Especially considering the XRD results, aluminum silicate assemblages rich in Ca and Mg, which were identified by EDS (Fig. 8), are thought to be the formation of anorthite, pyroxenes (augite/diopside) and/or melilite minerals (gehlenite).
It isfigured out from backscattered electron images (Fig. 9a, c, and Fig. 10a) that some of the samples include pores in variable dimensions (up to 10–15 μm) depending on starting materials and firing conditions (i.e. peak temperature offiring, soaking time and firing atmosphere). It should also be noticed that most of the samples have shapeless and un-even pores bringing the thought of uncompleted densification of the bodies (Fig. 9a andFig. 10a). Supporting this prediction, the quite poor vitrification degree of the representative samples belonging to both pe-riods indicated that a simplefiring technology would be used (Fig. 9b, d andFig. 10b). In the present work, it would be expected for some of the
representative ceramics containing relatively high amount of carbon-ates to have more extended or continuous vitrification degree at lower temperatures (750–850 °C) than the ones produced with Ca-poor clays, but this was not observed most probably due to an unevenfiring environment which is one of the most decisive factor controlling the re-action kinetics and therefore the formation of new phases (Trindade et al., 2009).
Conclusions
Chemical analysis showed that most of the potsherds investigated in this study have similar chemical compositions except few of the sam-ples which have relatively lower amounts of CaO and higher amount of MgO. This result was attributed to probable use of different raw ma-terial sources and/or import of the wares. Considering the mineralogi-cal/phase analysis, it was concluded that the samples belonging to both periods include quartz, feldspars and plagioclase as major phases, clay minerals as minor phases, and calcite occasionally as a major and minor phase. It should also be noticed that most of the samples were produced using the illitic clay deposits rich in calcareous materials.
The simultaneous presence of calcite and pyroxenes (diopside/au-gite) identified by XRD in some potsherds indicated two possibilities; i: such kind of samples were produced with an unstablefiring technique (such as pitfiring or a simply designed single chambered kiln having in-homogeneous heat distribution) which was not able to provide the maximum temperature and the appropriate soaking time required for the completion of decomposition and formation reactions; ii: deposi-tion/formation of secondary calcite have occurred during the burial time. While the former one is thought to be more valid for such samples, the optical microscopy and SEM images suggested that the latter one also seems as an acceptable reason for those potsherds (especially when the geological features of the region and the existence of a joint point of the river and creek in the immediate vicinity of the mound were considered).
The results obtained through the XRD and TG-DTA analyses indi-cated that the maximumfiring temperature of all samples did not ex-ceed 950–1000 °C. The presence of characteristic augite (pyroxene) peaks along with the absence of calcite and clay minerals on XRD pat-tern of the sample of K9 concluded that this sample has afiring temper-ature range of 850–950 °C. This sample, which is thought to represent the Ninevite-5 culture (the 3rd millennium BCE), was also differentiated from other samples with its form and design. Thus, due to its character-istic discriminating features (visual, mineralogical, micro/macro struc-tural), it was concluded that this sample might be brought by commercial relationships, probably from the neighboring territories in Mesopotamia.
The results suggested that thefiring technique used by the potters brought a limited and uneven oxygen penetration resulting in appear-ance of different colored layers. Such kind of samples is believed to be exposed to both oxidizing and reducing atmosphere, and it is estimated
that thefiring process has presumably ended in oxidizing atmosphere. This prediction was also confirmed by the Raman analysis, in which he-matite and magnetite were clearly detected in a representative sample. Although a number of base structures (probably used forfiring) were found in the mound, these residues could not be specified due to the absence of anyfired and/or amorphous potsherds, or carbonized nu-trition (plant or seed) around. It was difficult to clarify if these units were used for pottery production or cooking. Being similar to the results of the previous archaeometric studies carried out for different aged pot-tery samples from Kuriki, the results represented in this paper showed that the potsherds belonging to both periods were presumably pro-duced using a simplefiring technique which was not qualified to reach higher temperatures and to provide a homogenous/regular heating. Considering these results, it is thought that thefireplaces used in ceramic production would be unearthed till the mound is flooded by the dam.
The results suggested that despite a long time vacancy from the Late Chalcolithic-Early Bronze Age I to the second half of the 2nd millennium BCE, the production technology of pottery (selection and preparation of starting raw materials,firing techniques etc.) was presumably not changed drastically in Kuriki, and probably continued locally excluding some exceptional products (i.e. Ninevite-5 ceramics). Such non-local products would be indicative of socio-cultural interactions and com-mercial links between Kuriki and the neighboring settlement areas in upper Mesopotamia region.
The main archaeological settlement layers of the mound has been uncovered so far, yet the furtherfindings (i.e. ancient materials, residen-tial structures; if exist) would also be valuable and complement for the ultimate characterization of Kuriki.
It is believed that the results of this paper would be directive and useful in terms of enlightening and comparing the ceramic production technologies in both south-eastern Anatolia and northern Mesopotamia.
Acknowledgements
Thefinancial support by the Scientific Research Projects (BAP) de-partment of Batman University, Turkey is greatly acknowledged (Pro-ject code number: BTUBAP-2011-GSF-3). We also thank Ali Akın Akyol (Gazi University, Turkey) for his contributions to ceramic petrography and chromametrical analyses of the samples.
References
Bayazit, M., Işık, I., Issi, A., Genc, E., 2014.Spectroscopic and thermal techniques for the characterization of thefirst millennium AD potteries from Kuriki-Turkey. Ceram. Int. 40, 14769–14779.
Bayazit, M., Işık, I., Issi, A., 2015.Investigating thefiring technologies of part-Roman pot-sherds excavated from Kuriki (Turkey) using thermal and vibrational spectroscopic techniques. Vib. Spectrosc. 78, 1–11.
Bong, W.S.K., Matsumura, K., Nakai, I., 2008.Firing technologies and raw materials of typ-ical early and middle Bronze Age pottery from Kaman-Kalehöyük: a statisttyp-ical and chemical analysis. Anatol. Archaeol. Stud. 17, 295–311.
Carretero, M.I., Dondi, M., Fabbri, B., Raimondo, M., 2002.The influence of shaping and fir-ing technology on ceramic properties of calcareous and non-calcareous illitic– chloritic clays. Appl. Clay Sci. 20, 301–306.
Cultrone, G., Rodriguez-Navarro, C., Sebastian, E., Cazalla, O., De La Torre, M.J., 2001. Car-bonate and silicate phase reactions during ceramicfiring. Eur. J. Mineral. 13, 621–634. Cuomo di Caprio, N., Vaughan, S., 1993.An experimental study in distinguishing grog (chamotte) from argillaceous inclusions in ceramic thin sections. Archaeomaterials 7, 21–40.
Drebushchak, V.A., Mylnikova, L.N., Drebushchak, T.N., Boldyrev, V.V., 2005.The investiga-tions of ancient pottery. J. Therm. Anal. Calorim. 82, 617–626.
Fabbri, B., Gualtieri, S., Shoval, S., 2014.The presence of calcite in archeological ceramics. J. Eur. Ceram. Soc. 34, 1899–1911.
Genc, E., 2013.Kuriki mound excavation 2011 (Kuriki Höyük 2011 Yılı Kazısı). Proceed-ings of the 34th Excavation Results Meeting (34. Kazı Sonuçları Toplantısı, 1. Cilt). Kültür ve Turizm Bakanlığı, Kültür Varlıkları ve Müzeler Genel Müdürlüğü, Ankara, Turkey, pp. 229–240.
Hajjaji, M., Kacim, S., Boulmane, M., 2002.Mineralogy andfiring characteristics of a clay from the valley of Ourika (Morocco). Appl. Clay Sci. 21, 203–212.
Herbert, J.M., Smith, M.S., 2010.Identifying Grog in Archaeological Pottery. The First An-nual Conference, Reconstructive/Experimental Archaeology, Gastonia, NC, October, pp. 1–17.
Iordanidis, A., Garcia-Guinea, J., Karamitrou-Mentessidi, G., 2009.Analytical study of an-cient pottery from the archaeological site of Aiani, northern Greece. Mater. Charact. 60, 292–302.
Issi, A., 2012.Estimation of ancientfiring technique by the characterization of semi-fused Hellenistic potsherds from Harabebezikan/Turkey. Ceram. Int. 38, 2375–2380. Issi, A., Kara, A., Alp, A.O., 2011.An investigation of Hellenistic period pottery production
technology from Harabebezikan/Turkey. Ceram. Int. 37, 2575–2582.
Jordan, M.M., Boix, A., Sanfeliu, T., De la Fuente, C., 1999.Firing transformations of Creta-ceous clays used in the manufacturing of ceramic tiles. Appl. Clay Sci. 14, 225–234. Krapukaitytė, A., Tautkus, S., Kareiva, A., Zalieckienė, E., 2008.Thermal analysis— a
pow-erful tool for the characterization of pottery. Chemija. 19, 4–8.
Leach, F., Davidson, J., Claridge, G., Ward, G., Craib, J., 2008.The physical and mineralogical characteristics of pottery from Mochong, Rota, Mariana Island. In: Clark, G., Leach, F., O'Conner, S. (Eds.), Islands of Inquiry: Colonization, Seafaring and the Archaeology of Maritime Landscapes. Australian National University press, Terra Australia, pp. 435–452.
Loftfield, T.C., 1976.A Brief and True Report: An Archaeological Interpretation of the Southern North Carolina Coast (Unpublished Ph.D. dissertation) Department of an-thropology, University of North Carolina, Chapel Hill.
Mangone, A., Giannossa, L.C., Colafemmina, G., Laviano, R., Traini, A., 2009.Use of various spectroscopy techniques to investigate raw materials and define processes in the overpainting of Apulian redfigured pottery (4th century BC) from Southern Italy. Microchem. J. 92, 97–102.
Maritan, L., Mazzoli, C., Nodari, L., Russo, U., 2005.Second iron age grey pottery from Este (Northeastern Italy): study of provenance and technology. Appl. Clay Sci. 29, 31–44. Maritan, L., Nodari, L., Mazzoli, C., Milano, A., Russo, U., 2006.Influence of firing conditions on ceramic products: experimental study on clay rich in organic matter. Appl. Clay Sci. 31, 1–15.
Meyvel, S., Sathya, P., Velraj, G., 2012.Thermal characterization of archaeological pot sherds recently excavated in Nedunkur, Tamilnadu, India. Cerâmica 58, 338–341. Moropoulou, A., Bakolas, A., Bisbikou, K., 1995.Thermal analysis as a method of
character-izing ancient ceramic technologies. Thermochim. Acta 2570, 743–753.
MTA Turkey, official website, 2013a,http://www.mta.gov.tr/v2.0/turkiye_maden/il_ maden/pdf_2010/batman.pdf(26.11.2013).
MTA Turkey, official website, 2013b,http://www.mta.gov.tr/v2.0/turkiye_maden/il_ maden/pdf_2010/diyarbakir.pdf(26.11.2013).
MTA Turkey, official website, 2013c,http://www.mta.gov.tr/v2.0/turkiye_maden/il_ maden/pdf_2010/mardin.pdf(26.11.2013).
Nodari, L., Marcuz, E., Maritan, L., Mazzoli, C., Russo, U., 2007.Hematite nucleation and growth in thefiring of carbonate-rich clay for pottery production. J. Eur. Ceram. Soc. 27, 4665–4673.
Perez-Arantegui, J., Larrea, A., Molera, J., Pradell, T., Vendrell-Saz, M., 2004.Some aspects of the characterization of decorations on ceramic glazes. Appl. Phys. A Mater. Sci. Pro-cess. 79, 235–239.
Postgate, J.N., 1994.Early Mesopotamia: Society and Economy at the Dawn of History. re-print ed. Routledge, London.
Riccardi, M.P., Messiga, B., Duminuco, P., 1999.An approach to the dynamics of clayfiring. Appl. Clay Sci. 15, 393–409.
Rice, P.M., 1987.Pottery Analysis: A Sourcebook. University of Chicago Press, Chicago. Saffer, M., 1979.Aboriginal Clay Resource Utilization of the Georgia Coast (M.A. thesis)
Department of anthropology, University of Florida, Gainesville.
Shepard, A.O., 1985.Ceramics for the Archaeologist. Braun-Brumfield, Inc., Ann Arbor Originally published 1956, Publication No. 609 Carnegie Institution of Washington, Washington, D.C.
Shoval, S., 2003.Using FT-IR spectroscopy for study of calcareous ancient ceramics. Opt. Mater. 24, 117–122.
Shoval, S., Yofe, O., Nathan, Y., 2003.Distinguishing between natural and recarbonated calcite in oil shale ashes. J. Therm. Anal. Calorim. 71, 883–892.
Striova, J., Lofrumento, C., Zoppi, A., Castellucci, E.M., 2006.Prehistoric Anasazi ceramics studied by micro-Raman spectroscopy. J. Raman Spectrosc. 37, 1139–1145. Trindade, M.J., Dias, M.I., Coroado, J., Rocha, F., 2009.Mineralogical transformations of
cal-careous rich clays withfiring: a comparative study between calcite and dolomite rich clays from Algarve, Portugal. Appl. Clay Sci. 42, 345–355.
Van der Weerd, J., Smith, G.D., Firth, S., Clark, R.J.H., 2004.Identification of black pigments on prehistoric Southwest American potsherds by infrared and Raman microscopy. J. Archaeol. Sci. 31, 1429–1437.
Wilhelm, G, 1989. The Hurrians (Translated by Jennifer Barnes), Aris & Phillips Ltd, Teddington House, Warminster, Wiltshire, BA12 8PQ, England, 132 pp.https:// opus.bibliothek.uni-wuerzburg.de/files/7301/Wilhelm_OPUS_7301.pdf(Access date: 04.12.2015).