An Analysis of the Long-Run Performance of Turkish IPOs
Mustafa Serhat Ataoğuz
107621007
ISTANBUL BILGI UNIVERSITY
INSTITUTE of SOCIAL SCIENCES
MASTER of SCIENCE in FINANCIAL ECONOMICS
Under Supervision of
Sina Erdal
An Analysis of the Long-Run Performance of Turkish IPOs
Submitted by
Mustafa Serhat Ataoğuz
107621007
Approved by
Assoc. Prof. Dr. Ege Yazgan
:
Assoc. Prof. Dr. Orhan Erdem
:
Supervisor Mr. Sina Erdal
:
Approval Date
: 17 June 2009
Number
of
Pages
:
39
Keywords:
1) IPOs
2) Turkish IPO Long-run Performance
3) Long-run Underperformance
4) Abnormal Return
5) ISE 100 Index
Anahtar Kelimeler:
1) Halka Açılmalar
2) Halka Açılan Türk Şirketlerinin Uzun Vadeli Hisse Senedi
Performansı
3) Uzun Vadeli Hisse Performansı
4) Relatif Getiri
Abstract
In this dissertation I show that the companies issuing stock for the first time in Istanbul Stock Exchange (ISE) during the November 1999 - February 2006 period are, on the average, worse performers than the market itself, for the three-year period since their offerings. The universe of 58 initial public offerings (IPOs) is analysed and their three-year holding period returns and their abnormal returns for the same period are calculated. The results show that an investor on average obtains a return that is less than that of the market for three years when he invests in IPOs. In other words, a strategy of shorting IPO stocks and going long the ISE 100 Index generates a positive abnormal return. The average raw return of the 58 IPOs that are analysed is only 5.37 percent where the average ISE 100 Index return for the same period is 32.05 percent. That is, the average IPO abnormal return during the three years after issuing is -26.69 percent. After categorizing sample IPOs by industry I find that although stocks belonging to ISE National Financials and ISE National Services do have positive raw returns, no industry category can produce positive abnormal returns. Furthermore, the time dependence of the long-run performance of IPOs is also documented. In fact, the classification of IPOs with respect to their issue year illustrates that stocks offered in 1999, 2003, 2004, and 2005 have positive raw returns whilst only the ones issued in 1999 and 2005 can generate positive
Özet
Bu tez Istanbul Menkul Kıymetler Borsası’nda Kasım 1999 - Şubat 2006 dönemi içinde halka arz edilen şirketlerin uzun dönemdeki performanslarını incelemektedir. 58 şirketlik bir örneklemin kullanıldığı çalışmada başlıca bulgumuz halka arzların 3 yıllık performanslarının IMKB100’ün aynı dönemdeki performansından daha düşük olduğudur. Yani halka yeni arz edilen şirketlerin hisselerini halka arz gününde açığa satıp IMKB100 endeksine yatırım yapan bir yatırımcının 3 yıl sonunda getirisi ortalamada pozitiftir. İncelenen 58 şirketin üç yıllık ortalama getirisi %5,37, aynı dönemdeki IMKB100 endeksi ortalama getirisi ise %32,05 olmuştur. Dolayısıyla halka arzların relatif getirisi eksi %26,69’dur. Halka arzları sektörlere göre sınıflandırdığımızda IMKB Ulusal Mali ve IMKB Ulusal Hizmetler hisselerinin pozitif getiriler sağlamasına rağmen hiçbir sektöre ait hissenin IMKB100’ün üzerinde pozitif bir getiri sağlayamadığını görmekteyiz. Bu çalışmada ayrıca halka arzların uzun dönemli performanslarının halka arz yılıyla olan ilişkisini de incelemekteyiz. Halka arz edilme yıllarına göre gruplandırıldıklarında 1999, 2003, 2004 ve 2005 yıllarında borsaya giren şirketlerin saf getirileri pozitifken sadece 1999 ve 2005’tekiler yatırımcılarına IMKB100 ortalamasının üzerinde kazandırmışlardır.
Acknowledgements
I would like to express my deepest gratitude and appreciation to my thesis supervisor Mr. Sina Erdal, who has stood by me the whole time, given me immediate feedback and support. Without his guidance and persistent help this dissertation would not have been possible.
I also feel obligated to express my high regards for Asst. Prof. Dr. Orhan Erdem since he has been so helpful and contributory from the first day of my masters level studies.
Table of Contents
List of Tables...viii
List of Figures...ix
1. Introduction...1
2. Review of Literature...2
3. Data and Methodology...5
3.1. The Initial Public Offerings (IPO) Sample...5
3.2. Calculating Raw Returns...5
3.3. Comparison with the ISE 100 Index as a Benchmark - Finding the Abnormal Returns and the Wealth Relative...9
4. Time Series Evidence on IPOs...11
4.1. Buy-and-Hold (Raw) Returns on IPOs...11
4.1.1. Raw Returns Sorted by Industries...14
4.1.2. Raw Returns Sorted by Year-of-Issue...18
4.2. ISE 100 Index Return...20
4.3. Abnormal Returns on IPOs...25
4.3.1. Abnormal Returns Sorted by Industries...29
4.3.2. Abnormal Returns Sorted by Year-of-Issue...32
4.4. Wealth Relative...33
4.4.1. Wealth Relatives for Industries...34
5. Conclusion...36 Bibliography...38
List of Tables
Table Page
1 One Way Tabulation of Raw Returns on IPOs...12
2 Raw Returns on IPOs...13
3 IPO Raw Returns Sorted by Industry...16
4 IPO Raw Returns Sorted by Issue Year...19
5 One Way Tabulation of ISE 100 Index...22
6 ISE 100 Index Returns...23
7 One Way Tabulation of Abnormal Returns...26
8 Abnormal Returns on IPOs...27
9 Abnormal Returns Sorted by Industry...30
10 Abnormal Returns Sorted by Issue Year...32
11 Wealth Relatives Sorted by Industry...34
List of Figures
Figure Page
1 Histogram of Raw Returns on IPOs...12
2 Annual Volume of IPOs...18
3 Histogram of ISE 100 Index...21
1. Introduction
Issuing stocks to the public for the first time and entering the stock market plays an important role for a company’s financing. The main idea behind a public offering is to raise capital. Because when investors buy the shares they provide the company with a solid amount of capital that is not supposed to be paid back. All the company has to do is give the investors a part of its profits. In addition, the company saves time and resources since it does not have to look for lenders and negotiate with them. That’s why many firms decide to go public at a certain point in their life.
Throughout the last decade, Istanbul Stock Exchange has been growing rapidly and more firms are expected to go public in the near future. Every time a company issues equity people anticipate large initial returns and consequently feel the urge to invest in these initial public offerings. But is it really wise to do so for long-term benefits or is the positive initial return just a false impression? In this dissertation I examine the performance of a sample of 58 Turkish IPOs coming to market between November 1999 and February 2006 and examine whether they are good or lousy investments in the long-run. First, I explain the data and methodology in Chapter 3 and then I give the time series evidence on IPO performance in Chapter 4 and finish with a summary of findings.
2.
Review of Literature - The International Evidence on IPO
Performance
Numerous studies have examined the long-run performance of initial public offerings around the globe. Almost all have concluded that IPOs tend to have negative long-term excess returns, relative to various benchmarks. In other words, stocks that are just coming to market seem to be overvalued for long-term investors.
Uhlir (1989), who studies 97 German firms that went public between 1977 and 1987, finds that their average long-term abnormal return is -7.41 percent. In his study of 1526 American (US) IPOs for the 1975 - 1984 period, Ritter (1991) finds that these stocks have lower returns than a set of matching, non-issuing firms. In fact, only 5 of the 36 monthly averaged matching firm adjusted abnormal returns are positive and the cumulative abnormal return (CAR) at the end of the three years is -29.13 percent.
In a paper examining IPO performance in South America, Aggarwal, Leal, and Hernandez (1993) follow a sample of 62 Brazilian IPOs from 1980 - 1990, 36 Chilean IPOs from 1982 - 1990, and 44 Mexican IPOs from 1987 - 1990. They report that Brazilian stocks, excluding the initial return, which is the return attained on the first day of issue, have an average three-year abnormal return of -47 percent and a wealth relative, which is the end-of-period wealth from
holding a set of IPOs divided by the end-of-period wealth from holding a set of matching firms, of 0.67. Likewise, one who has invested on Chilean IPOs would earn 23.7 percent less than the market. Mexican IPOs have an average abnormal return of -19.6 percent.
After inspecting 42 Swiss initial public offerings issued between 1983 and 1989, Kunz and Aggarwal (1994) mention that the long-term performance of these IPOs is limited to a -6.1 percent excess return, excluding the initial day return.
Ritter and Loughran (1995) examine both initial public offerings and seasoned equity offerings. With a sample of 4753 US companies issuing stock between 1970 and 1990, they report that the average 3-year buy-and-hold return for matching firms is 35.3 percent while that of the IPOs is only 8.4 percent. In other words, the abnormal return for the IPOs is -26.9 percent. In addition, the three-year wealth relative is 0.80.
In his analysis of 143 New Zealand IPOs in the period of 1979 - 1987, Firth (1997) reports that the CAR turns negative after the twelfth month.
Ljungqvist (1997) calculates the average three-year market adjusted return for a total number of 189 German IPOs coming to market between the years 1970 and 1993 as less than -12 percent.
Houge and Loughran (1999) find that 393 US bank stocks that went public in 1983 - 1991 have negative returns in the long-run.
Kooli and Suret (2004) examine a sample of 445 Canadian IPOs issued between 1991 and 1998 and discover not only that the sample has an average
return that is 24.66 percentage points less than that of the control firms, but also that their CAR is lower, too.
Sevim and Akkoc (2006) analyze 185 Turkish IPOs for the period of 1990 to 1999 and discover that the CAR at the end of the third year is -15.26 percent. They also state that only the banking, holding & investment, tourism, and chemical - petroleum - plastic stocks have positive CARs after 36 months. After examining the Turkish banking sector, Unlu (2006) states that these IPOs tend to have negative abnormal returns for the first two years after issue, but positive ones after three years.
In their study of Malaysian IPOs coming to market between 1980 and 1995, Jelic, Saadouni, and Briston (2001) state that the IPOs actually did have statistically significant positive returns in the long-run, that is three years after the issue.
In light of these international findings, one can be clear that most IPOs around the world are unable to extend their high initial returns to the long-term and have low or most of the time negative market adjusted returns.
3. Data and Methodology
3.1. The Initial Public Offerings (IPO) Sample
I use a sample of 58 companies that went public in Turkey between November 1999 and February 2006. The data on these IPOs come from two online sources. The price series of the stocks and the price series of the ISE 100 Index are obtained from the official website of Garanti Bankası for financial markets which is http://www.paragaranti.com/pages/hisse.jsp. The data for the dividend payments, rights issues, bonus stock issues, stock splits, the classification of IPOs according to their industries, and the general information about delisted stocks are obtained from the official website of Istanbul Stock Exchange.1
3.2. Calculating Raw Returns
I use the closing price of a stock on its first day of trading as the initial price. The main reason behind this decision of excluding the initial return is the fact that an ordinary investor is usually not able to buy shares of an IPO at the offering price. I also determine the holding period as three years, following prior studies of IPO long-run performance. To find holding period returns, I assume that any dividend payments within the 3-year window are reinvested in
the shares of the company at the closing price on the dividend payment date. I also make sure that stock splits, rights issues, and bonus issues are taken into account when calculating three-year raw returns.
To make things clear, here is a more detailed explanation of how I calculate the holding period returns. For stocks with no dividends, rights issues, or bonus issues, the 3-year holding period return is found simply by using the closing prices on the first day of issue and the closing price on the third anniversary of the issue. That is,
3 0 0 p p r p − = , where
r : return for the stock,
0
p : closing price of the stock on the issue day,
3
p : closing price of the stock on the third anniversary of the issue.
For stocks with any one of rights issues, bonus issues, stock dividends, and cash dividends I find the 3-year return by using the amounts of wealth at the start and at the end of the holding period. To illustrate,
3 0 3 3 0 0 0 1 * * * w w p s p s r w p s 1 − − = = , where
r : return for the stock,
0
3
w : amount of wealth at the end of the holding period,
0
p : closing price of the stock on the issue day,
3
p : closing price of the stock on the third anniversary of the issue,
1
s : total number of stocks owned at the beginning of the holding period,
3
s : total number of stocks owned at the end of the holding period.
So, in order to find the amounts of wealth at the start and at the end of the holding period, one needs to know the number of stocks owned at that point in time. Below, I try to explain how I calculate that number for various types of stocks.
For stocks with stock dividends,
1 * ds s t s =d s− , where ds
s : the number of stocks acquired with the stock dividend,
s
d : stock dividends rate,
1
t
s− : the number of stocks owned before the stock dividend. Thus, the total number of stocks owned after the stock dividend is
(
)
1 1 1 1 * * 1 . t t ds t s t t s s s s s d s s d − − − − = + = + = +For stocks with cash dividends,
c dc d d s p = ,
where
dc
s : the number of stocks acquired with the cash dividend,
c
d : cash dividend,
d
p : closing price of the stock on the day of subscription.
For stocks with bonus issues,
1 * ib b t s =i s− , where ib
s : the number of stocks acquired with the bonus issue,
b
i : bonus issue rate,
1
t
s− : the number of stocks owned before the bonus issue. Thus, the total number of stocks owned after the bonus issue is
(
)
1 1 1 1 * * 1 . t t ib t b t t b s s s s i s s i − − − − = + = + = +For stocks with rights issues,
1 * ir r t s =i s− , where ir
s : the number of stocks acquired with the rights issue,
r
i : rights issue rate,
1
t
But these stocks that are acquired with the rights issue are not for free. So, I assume that their cost is compensated by selling the same stock for the closing price on the day of subscription. To clarify, the total number of stocks owned after the rights issue is found as
1 1 * 1 , ir t t ir t ir t r t t s s s s p s s i s p − − − = + − = + − where ir t s
p : the number of shares sold in order to compensate for the cost of ones acquired through the rights issue.
3.3. Comparison with the ISE 100 Index as a Benchmark – Finding the Abnormal Returns and the Wealth Relative
I also compare the raw returns of initial public offerings with the return on the ISE 100 Index as a benchmark. For each IPO, the corresponding ISE 100 Index return is calculated for exactly the same period as the first three years since the issue. For instance, the corresponding ISE 100 Index return for the stock GSD Holding (GSDHO), which was first issued to the market on 11 November 1999, is calculated by using the closing prices of the ISE 100 Index on 11 November 1999 and 11 November 2002. Finally, the substitution of ISE 100 Index return from the raw IPO return gives us the abnormal return for the IPO. To illustrate,
, , 100, i t i t XU t AR =r −r , where , i t
AR : the abnormal return of stock i, for period t,
,
i t
r : the return of stock i, for period t,
100,
XU t
r : the return of ISE 100 Index, for period t.
I also calculated the wealth relatives for IPOs as a second indication of long-term performance. Wealth relative can be defined as
1 average 3-year raw return on IPOs 1 average 3-year return on ISE 100 WR= +
+ ,
where
4. Time Series Evidence on IPOs
In the following sections, I present the 3-year raw returns of the sample of 58 IPOs and the classification of these raw returns not only by industry, but also by issue year. Next, I present the ISE 100 Index return that is helpful for calculating the abnormal returns of IPOs. I also present the abnormal returns and their classification with respect to the companies’ industries and issue years. Finally, the 3-year wealth relative for IPOs is calculated and analyzed, as with abnormal returns, by industry and issue year. In addition, each section includes the elementary analysis of its components, performed by using the software E-Views 5.0.
4.1. Buy-and-Hold (Raw) Returns on IPOs
In Table 2, I report the 3-year holding period returns for the 58 sample firms. Looking at this table, one can see that 23 out of 58, or 60 percent of initial public offerings have positive returns.
The histogram of the raw returns in Figure 1 shows that the mean of the returns is 5.37 percent while the median is -24.56 percent. The maximum 3-year return any IPO has attained is 458.37 percent and the minimum is -100 percent.
0 2 4 6 8 10 12 14 -1 0 1 2 3 4 Series: RET Sample 1 58 Observations 58 Mean 0.053711 Median -0.245600 Maximum 4.583698 Minimum -1.000000 Std. Dev. 1.067867 Skewness 2.278318 Kurtosis 8.776385 Jarque-Bera 130.8131 Probability 0.000000
Figure 1. Histogram of Raw Returns on IPOs
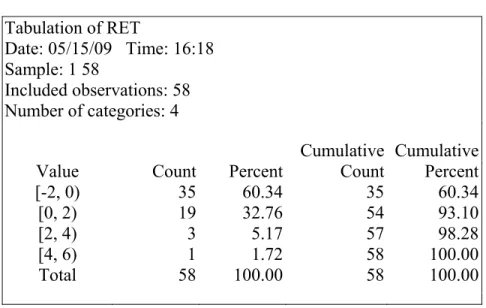
Using the one-way tabulation property of E-Views which is displayed in Table 1, one can see that the majority of positive returns are concentrated in the 0 percent to 200 percent interval. There are only four stocks with returns more than 200 percent and only one with a return exceeding 400 percent.
Table 1. One Way Tabulation of Raw Returns on IPOs
Tabulation of RET Date: 05/15/09 Time: 16:18 Sample: 1 58 Included observations: 58 Number of categories: 4 Cumulative Cumulative
Value Count Percent Count Percent
[-2, 0) 35 60.34 35 60.34
[0, 2) 19 32.76 54 93.10
[2, 4) 3 5.17 57 98.28
[4, 6) 1 1.72 58 100.00
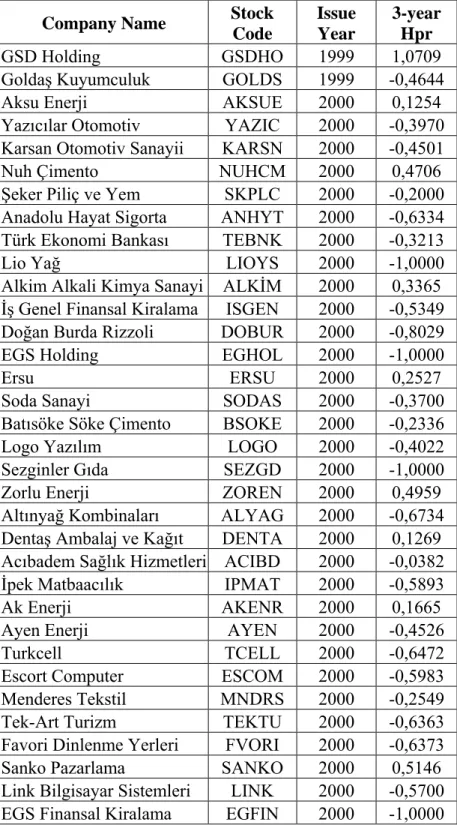
Table 2. Raw Returns on IPOs
Company Name Stock Code Issue Year 3-year Hpr GSD Holding GSDHO 1999 1,0709
Goldaş Kuyumculuk GOLDS 1999 -0,4644
Aksu Enerji AKSUE 2000 0,1254
Yazıcılar Otomotiv YAZIC 2000 -0,3970 Karsan Otomotiv Sanayii KARSN 2000 -0,4501
Nuh Çimento NUHCM 2000 0,4706
Şeker Piliç ve Yem SKPLC 2000 -0,2000 Anadolu Hayat Sigorta ANHYT 2000 -0,6334 Türk Ekonomi Bankası TEBNK 2000 -0,3213
Lio Yağ LIOYS 2000 -1,0000
Alkim Alkali Kimya Sanayi ALKİM 2000 0,3365 İş Genel Finansal Kiralama ISGEN 2000 -0,5349 Doğan Burda Rizzoli DOBUR 2000 -0,8029
EGS Holding EGHOL 2000 -1,0000
Ersu ERSU 2000 0,2527
Soda Sanayi SODAS 2000 -0,3700
Batısöke Söke Çimento BSOKE 2000 -0,2336
Logo Yazılım LOGO 2000 -0,4022
Sezginler Gıda SEZGD 2000 -1,0000
Zorlu Enerji ZOREN 2000 0,4959
Altınyağ Kombinaları ALYAG 2000 -0,6734 Dentaş Ambalaj ve Kağıt DENTA 2000 0,1269
Acıbadem Sağlık Hizmetleri ACIBD 2000 -0,0382 İpek Matbaacılık IPMAT 2000 -0,5893
Ak Enerji AKENR 2000 0,1665
Ayen Enerji AYEN 2000 -0,4526
Turkcell TCELL 2000 -0,6472
Escort Computer ESCOM 2000 -0,5983 Menderes Tekstil MNDRS 2000 -0,2549 Tek-Art Turizm TEKTU 2000 -0,6363 Favori Dinlenme Yerleri FVORI 2000 -0,6373 Sanko Pazarlama SANKO 2000 0,5146 Link Bilgisayar Sistemleri LINK 2000 -0,5700 EGS Finansal Kiralama EGFIN 2000 -1,0000
Table 2. Raw Returns on IPOs (continued)
Company Name Stock Code
Issue Year
3-year Hpr Arena Bilgisayar ARENA 2000 -0,8149
Alkim Kağıt ALKA 2000 0,7646
Galatasaray GSRAY 2002 0,1674
Beşiktaş BJKAS 2002 -0,3788
Metemtur Otelcilik ve Turizm METUR 2002 0,1185
Koza Davetiye KOZAD 2003 1,9274
Gersan Elektrik GEREL 2003 -0,1199
Fenerbahçe FENER 2004 1,0717
Desa Deri DESA 2004 -0,3802
Burçelik Vana BURVA 2004 -0,2363
Türk Traktör TTRAK 2004 2,2181
Doğuş Otomotiv DOAS 2004 0,0142
İndeks Bilgisayar Sistemleri INDES 2004 0,3466 Şeker Finansal Kiralama SEKFK 2004 -0,0680 Plastikkart Akıllı Kart PKART 2004 0,4667
Denizbank DENIZ 2004 4,5837
AFM Uluslararası Film AFMAS 2004 0,2967
Trabzonspor TSPOR 2005 2,7477
Bim Birleşik Mağazalar BIMAS 2005 3,3570 Anel Telekomünikasyon ANELT 2005 0,1493
Türkiye Vakıflar Bankası VAKBN 2005 -0,5686 Mert Gıda Giyim MRTGG 2005 -0,7496 Reysaş Lojistik RYSAS 2006 -0,7952 Datagate Bilgisayar DGATE 2006 -0,6553
4.1.1. Raw Returns Sorted by Industries
In this section, I report the results of sorting sample IPOs by industry. According to this sorting, one can see that 10 of the 58 IPOs are of the ISE
industry, 18 of them are ISE National Services, and 8 of them belong to the ISE National Technology. Table 3 illustrates the 3-year raw returns of the IPOs belonging to each aforementioned sector.
Table 3. IPO Raw Returns Sorted by Industry
Stock
Code Industry
3-yr HpAR GSDHO ISE NATIONAL FINANCIALS 0,4856 YAZIC ISE NATIONAL FINANCIALS -0,1337
ANHYT ISE NATIONAL FINANCIALS -0,4109 TEBNK ISE NATIONAL FINANCIALS -0,0770
ISGEN ISE NATIONAL FINANCIALS -0,0924
EGHOL ISE NATIONAL FINANCIALS -0,6040 EGFIN ISE NATIONAL FINANCIALS -1,0907
SEKFK ISE NATIONAL FINANCIALS -2,0105
DENIZ ISE NATIONAL FINANCIALS 3,0887
VAKBN ISE NATIONAL FINANCIALS -0,2339 GOLDS ISE NATIONAL INDUSTRIALS -0,1409 KARSN ISE NATIONAL INDUSTRIALS -0,2569 NUHCM ISE NATIONAL INDUSTRIALS 0,6930
SKPLC ISE NATIONAL INDUSTRIALS 0,0224 LIOYS ISE NATIONAL INDUSTRIALS -0,5979 ALKİM ISE NATIONAL INDUSTRIALS 0,7386 DOBUR ISE NATIONAL INDUSTRIALS -0,3604
ERSU ISE NATIONAL INDUSTRIALS 0,6487
SODAS ISE NATIONAL INDUSTRIALS -0,0492 BSOKE ISE NATIONAL INDUSTRIALS 0,1844 SEZGD ISE NATIONAL INDUSTRIALS -0,5986 ALYAG ISE NATIONAL INDUSTRIALS -0,3547 DENTA ISE NATIONAL INDUSTRIALS 0,4771
IPMAT ISE NATIONAL INDUSTRIALS -0,3417 MNDRS ISE NATIONAL INDUSTRIALS -0,0277 ALKA ISE NATIONAL INDUSTRIALS 0,6389
KOZAD ISE NATIONAL INDUSTRIALS -1,0738 GEREL ISE NATIONAL INDUSTRIALS -2,9945 DESA ISE NATIONAL INDUSTRIALS -1,9155
BURVA ISE NATIONAL INDUSTRIALS -2,1166 TTRAK ISE NATIONAL INDUSTRIALS 0,6766 MRTGG ISE NATIONAL INDUSTRIALS -0,4495
Table 3. IPO Raw Returns Sorted by Industry (continued)
Stock
Code Industry
3-yr HpAR AKSUE ISE NATIONAL SERVICES 0,5340
ZOREN ISE NATIONAL SERVICES 0,8146
ACIBD ISE NATIONAL SERVICES 0,2243
AKENR ISE NATIONAL SERVICES 0,4448
AYEN ISE NATIONAL SERVICES -0,1598
TCELL ISE NATIONAL SERVICES -0,3908
TEKTU ISE NATIONAL SERVICES -0,5449
FVORI ISE NATIONAL SERVICES -0,5247
SANKO ISE NATIONAL SERVICES 0,1761
GSRAY ISE NATIONAL SERVICES -1,2545
BJKAS ISE NATIONAL SERVICES -1,8007
METUR ISE NATIONAL SERVICES -1,7701
FENER ISE NATIONAL SERVICES -0,2966
DOAS ISE NATIONAL SERVICES -1,7293
AFMAS ISE NATIONAL SERVICES -1,1638
TSPOR ISE NATIONAL SERVICES 2,0043
BIMAS ISE NATIONAL SERVICES 3,1168
RYSAS ISE NATIONAL SERVICES -0,3752
LOGO ISE NATIONAL TECHNOLOGY -0,0240 ESCOM ISE NATIONAL TECHNOLOGY -0,4361 LINK ISE NATIONAL TECHNOLOGY -0,6607
ARENA ISE NATIONAL TECHNOLOGY -0,9406 INDES ISE NATIONAL TECHNOLOGY -1,3426 PKART ISE NATIONAL TECHNOLOGY -0,9384 ANELT ISE NATIONAL TECHNOLOGY 0,0712 DGATE ISE NATIONAL TECHNOLOGY -0,2353
According to table Table 3, two sectors have positive returns on average and two sectors have negative returns on average. The mean return of ISE National Financials is 11.31 percent and the mean return of ISE National Services is 30.5 percent. On the other hand, ISE National Industrials have an average raw return
of -6.5 percent and ISE National Technology stocks’ return is -25.98 percent. Thus, it seems that the 3-year performance of IPOs depend on industry. Companies in the sub-sectors of ISE Services such as electricity, tourism and sports have higher returns than other IPOs in general. Moreover, technology-related firms have the lowest average returns.
4.1.2. Raw Returns Sorted by Year-of-Issue
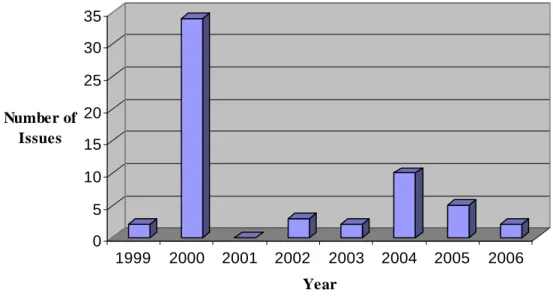
Figure 2 shows the volume of IPOs for each year during the 1999-2006 period. It is noteworthy that the sample is dominated by firms that went public in 2000, the year before the Turkish economic crisis.
0 5 10 15 20 25 30 35 Number of Issues 1999 2000 2001 2002 2003 2004 2005 2006 Year
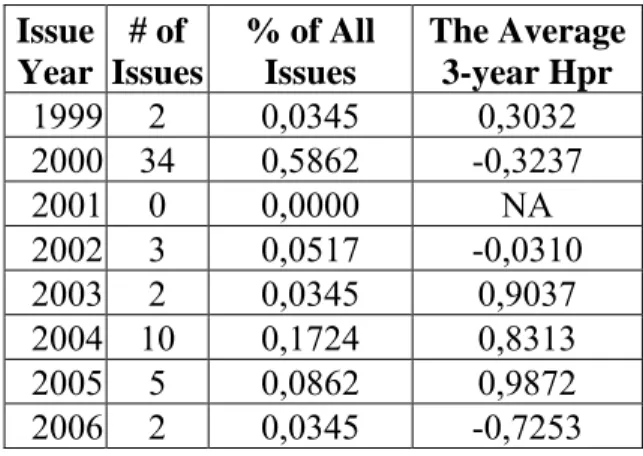
Sorting the raw returns of IPOs with respect to their issue years, as illustrated in Table 4, allows us to see that stocks issued in 2000 make up almost 60% of all offerings between 1999 and 2006. The second most active year seems to be 2004 with ten IPOs. 2005 follows it with five, and 2002 with three IPOs. In 1999, 2003, and 2006 the number of new issues is two for each. In 2001, no companies went public at the ISE.
Table 4. IPO Raw Returns Sorted by Issue Year
Issue Year # of Issues % of All Issues The Average 3-year Hpr 1999 2 0,0345 0,3032 2000 34 0,5862 -0,3237 2001 0 0,0000 NA 2002 3 0,0517 -0,0310 2003 2 0,0345 0,9037 2004 10 0,1724 0,8313 2005 5 0,0862 0,9872 2006 2 0,0345 -0,7253
Furthermore, 4 out of 7 years with at least one IPO have positive returns. One can also see that the stocks coming to market in 2005 have an average 3-year holding period return of 98.72 percent. The years 2006 and 2007 also seem to have been lucrative for IPO investors since stocks issued in 2003 and 2004 have average raw returns of 90.37 percent and 83.13 percent respectively. The other positive average return of 30.32 percent belongs to the IPOs of the year 1999.
Stocks issued in years 2000, 2002, and 2006 have the negative average raw returns of -32.37 percent , -3.1 percent, and -72.5 percent respectively.
These numbers can be interpreted in a couple of ways. The third year of holding period of the IPOs that went public before 2003, coincides with the ongoing effect of the 2001 crisis and the plummetting of the stock market. That’s why the IPOs of 2000 have negative returns.
On the other hand, one can say that because of the 2001 economic crisis, there were many firms that went public in 2003 for relatively cheap prices. So it was easier for them to score big returns. In addition, the third year of holding period of the IPOs coming to market in 2004 and 2005 coincides with the mortgage related stock market bubble that burst in late 2008. Since the prices in the market were so high during 2007 and early 2008, these stocks gained big returns on the average.
4.2. ISE 100 Index Return
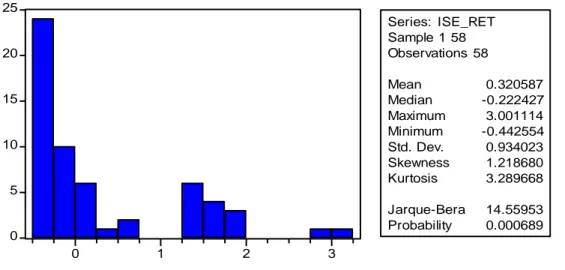
The histogram of the ISE 100 Index returns, illustrated in Figure 3, shows that the mean of the returns is 32.06 percent while the median is -22.24 percent. The maximum 3year return that is attained is 300.11 percent and the minimum is -44.25 percent.
0 5 10 15 20 25 0 1 2 3 Series: ISE_RET Sample 1 58 Observations 58 Mean 0.320587 Median -0.222427 Maximum 3.001114 Minimum -0.442554 Std. Dev. 0.934023 Skewness 1.218680 Kurtosis 3.289668 Jarque-Bera 14.55953 Probability 0.000689
Figure 3. Histogram of ISE 100 Index
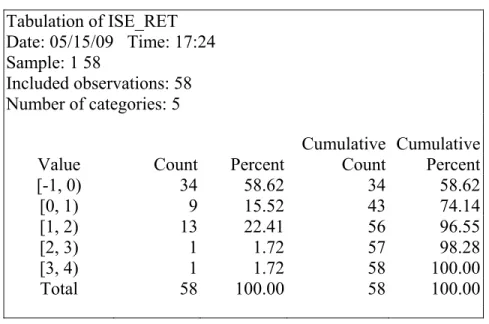
Using the one-way tabulation property of E-Views which is displayed in Table 5, one can see that 34 out of 58 returns, that is about 59 percent of all, are in the interval of -100 percent to zero percent. There are 9 returns between zero to 1 percent. The interval of 100 percent to 200 percent includes 13 returns while the number of returns over 200 percent is only 2.
Table 5. One Way Tabulation of ISE 100 Index Tabulation of ISE_RET Date: 05/15/09 Time: 17:24 Sample: 1 58 Included observations: 58 Number of categories: 5 Cumulative Cumulative
Value Count Percent Count Percent
[-1, 0) 34 58.62 34 58.62 [0, 1) 9 15.52 43 74.14 [1, 2) 13 22.41 56 96.55 [2, 3) 1 1.72 57 98.28 [3, 4) 1 1.72 58 100.00 Total 58 100.00 58 100.00
In Table 6, one can observe the ISE 100 Index returns for three-year periods corresponding to the initial public offerings.
Table 6. ISE 100 Index Returns Stock Code Date of IPO Issue ISE 100 Return in the Same Period GSDHO 11.11.1999 0,5853 GOLDS 28.12.1999 -0,3236 AKSUE 04.01.2000 -0,4086 YAZIC 17.02.2000 -0,2633 KARSN 21.02.2000 -0,1932 NUHCM 24.02.2000 -0,2224 SKPLC 24.02.2000 -0,2224 ANHYT 24.02.2000 -0,2224 TEBNK 28.02.2000 -0,2443 LIOYS 02.03.2000 -0,4021 ALKİM 02.03.2000 -0,4021 ISGEN 28.03.2000 -0,4426 DOBUR 28.03.2000 -0,4426 EGHOL 30.03.2000 -0,3960 ERSU 30.03.2000 -0,3960 SODAS 20.04.2000 -0,3208 BSOKE 03.05.2000 -0,4180 LOGO 08.05.2000 -0,3783 SEZGD 11.05.2000 -0,4014 ZOREN 25.05.2000 -0,3187 ALYAG 25.05.2000 -0,3187 DENTA 08.06.2000 -0,3502 ACIBD 15.06.2000 -0,2625 IPMAT 30.06.2000 -0,2476 AKENR 07.07.2000 -0,2783 AYEN 05.07.2000 -0,2928 TCELL 11.07.2000 -0,2565 ESCOM 20.07.2000 -0,1622 MNDRS 27.07.2000 -0,2272 TEKTU 10.08.2000 -0,0914 FVORI 31.08.2000 -0,1126 SANKO 05.10.2000 0,3384 LINK 26.10.2000 0,0907 EGFIN 26.10.2000 0,0907
Table 6. ISE 100 Index Returns (continued) Stock Code Date of IPO Issue ISE 100 Return in the Same Period ARENA 02.11.2000 0,1257 ALKA 02.11.2000 0,1257 GSRAY 20.02.2002 1,4219 BJKAS 20.02.2002 1,4219 METUR 23.07.2002 1,8886 KOZAD 20.02.2003 3,0011 GEREL 14.05.2003 2,8746 FENER 20.02.2004 1,3684 DESA 06.05.2004 1,5352 BURVA 17.05.2004 1,8803 TTRAK 11.06.2004 1,5416 DOAS 17.06.2004 1,7435 INDES 24.06.2004 1,6891 SEKFK 23.07.2004 1,9425 PKART 19.08.2004 1,4051 DENIZ 01.10.2004 1,4950 AFMAS 19.10.2004 1,4605 TSPOR 15.04.2005 0,7433 BIMAS 15.07.2005 0,2402 ANELT 13.09.2005 0,0781 VAKBN 18.11.2005 -0,3347 MRTGG 16.12.2005 -0,3002 RYSAS 10.02.2006 -0,4201 DGATE 10.02.2006 -0,4201
4.3. Abnormal Returns on IPOs
For abnormal return calculations on IPOs I use the ISE 100 Index as the benchmark.
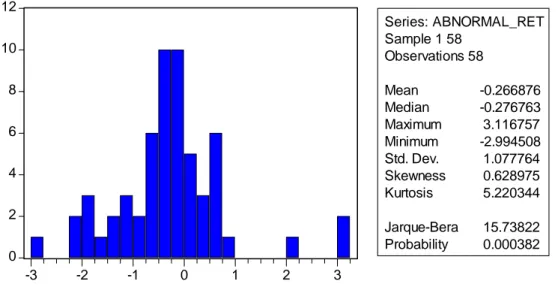
Looking at Table 8, one can see that only 18 out of 58 initial public offerings have positive abnormal returns. This makes up approximately only 31 percent of all the IPOs in the period of November 1999 and February 2006.
The histogram of the abnormal returns in Figure 4 shows that the mean of the returns is -0.2669 that is -26.69 percent while the median is -27.68 percent. The maximum excess return any IPO has attained is 311.67 percent and the minimum is -299.45 percent. 0 2 4 6 8 10 12 -3 -2 -1 0 1 2 3 Series: ABNORMAL_RET Sample 1 58 Observations 58 Mean -0.266876 Median -0.276763 Maximum 3.116757 Minimum -2.994508 Std. Dev. 1.077764 Skewness 0.628975 Kurtosis 5.220344 Jarque-Bera 15.73822 Probability 0.000382
Using the one-way tabulation, as illustrated in Table 7, one can see that 90 percent of all excess returns are concentrated in the -200 percent to 200 percent interval. There are only six stocks with abnormal returns outside of this interval. Moreover, 37 out of 52 abnormal returns in this interval are negative ones.
Table 7. One Way Tabulation of Abnormal Returns
Tabulation of ABNORMAL_RET Date: 05/16/09 Time: 13:18 Sample: 1 58 Included observations: 58 Number of categories: 4 Cumulative Cumulative
Value Count Percent Count Percent
[-4, -2) 3 5.17 3 5.17
[-2, 0) 37 63.79 40 68.97
[0, 2) 15 25.86 55 94.83
[2, 4) 3 5.17 58 100.00
Table 8. Abnormal Returns on IPOs Stock Code 3-year Raw Return on IPOs ISE 100 Return in the Same Period Abnormal Return on IPOs GSDHO 1,0709 0,5853 0,4856 GOLDS -0,4644 -0,3236 -0,1409 AKSUE 0,1254 -0,4086 0,5340 YAZIC -0,3970 -0,2633 -0,1337 KARSN -0,4501 -0,1932 -0,2569 NUHCM 0,4706 -0,2224 0,6930 SKPLC -0,2000 -0,2224 0,0224 ANHYT -0,6334 -0,2224 -0,4109 TEBNK -0,3213 -0,2443 -0,0770 LIOYS -1,0000 -0,4021 -0,5979 ALKİM 0,3365 -0,4021 0,7386 ISGEN -0,5349 -0,4426 -0,0924 DOBUR -0,8029 -0,4426 -0,3604 EGHOL -1,0000 -0,3960 -0,6040 ERSU 0,2527 -0,3960 0,6487 SODAS -0,3700 -0,3208 -0,0492 BSOKE -0,2336 -0,4180 0,1844 LOGO -0,4022 -0,3783 -0,0240 SEZGD -1,0000 -0,4014 -0,5986 ZOREN 0,4959 -0,3187 0,8146 ALYAG -0,6734 -0,3187 -0,3547 DENTA 0,1269 -0,3502 0,4771 ACIBD -0,0382 -0,2625 0,2243 IPMAT -0,5893 -0,2476 -0,3417 AKENR 0,1665 -0,2783 0,4448 AYEN -0,4526 -0,2928 -0,1598 TCELL -0,6472 -0,2565 -0,3908 ESCOM -0,5983 -0,1622 -0,4361 MNDRS -0,2549 -0,2272 -0,0277 TEKTU -0,6363 -0,0914 -0,5449 FVORI -0,6373 -0,1126 -0,5247 SANKO 0,5146 0,3384 0,1761 LINK -0,5700 0,0907 -0,6607 EGFIN -1,0000 0,0907 -1,0907
Table 8. Abnormal Returns on IPOs (continued) Stock Code 3-year Raw Return on IPOs ISE 100 Return in the Same Period Abnormal Return on IPOs ARENA -0,8149 0,1257 -0,9406 ALKA 0,7646 0,1257 0,6389 GSRAY 0,1674 1,4219 -1,2545 BJKAS -0,3788 1,4219 -1,8007 METUR 0,1185 1,8886 -1,7701 KOZAD 1,9274 3,0011 -1,0738 GEREL -0,1199 2,8746 -2,9945 FENER 1,0717 1,3684 -0,2966 DESA -0,3802 1,5352 -1,9155 BURVA -0,2363 1,8803 -2,1166 TTRAK 2,2181 1,5416 0,6766 DOAS 0,0142 1,7435 -1,7293 INDES 0,3466 1,6891 -1,3426 SEKFK -0,0680 1,9425 -2,0105 PKART 0,4667 1,4051 -0,9384 DENIZ 4,5837 1,4950 3,0887 AFMAS 0,2967 1,4605 -1,1638 TSPOR 2,7477 0,7433 2,0043 BIMAS 3,3570 0,2402 3,1168 ANELT 0,1493 0,0781 0,0712 VAKBN -0,5686 -0,3347 -0,2339 MRTGG -0,7496 -0,3002 -0,4495 RYSAS -0,7952 -0,4201 -0,3752 DGATE -0,6553 -0,4201 -0,2353
4.3.1. Abnormal Returns Sorted by Industries
In this part, I report the results of sorting the IPO abnormal returns by industry. Table 9 illustrates the 3-year abnormal returns of the IPOs for each industry represented in the sample.
According to Table 9, long-run underperformance is present in all of the four industry groupings, even though in Table 3 we had two industries with positive raw returns. In the case of abnormal returns, the mean return of ISE Financials is -10.79 percent, the mean return of ISE Industrials is -32.72 percent. Furthermore, ISE Services have an average excess return of -14.97 percent and ISE Technology stocks’ abnormal return is -56.33 percent. Consequently, the industry to which an IPO firm belongs should not really matter for an investor since all the sectors have negative average abnormal returns.
Table 9. Abnormal Returns Sorted by Industry
Stock
Code Industry
3-yr HpAR GSDHO ISE NATIONAL FINANCIALS 0,4856
YAZIC ISE NATIONAL FINANCIALS -0,1337
ANHYT ISE NATIONAL FINANCIALS -0,4109
TEBNK ISE NATIONAL FINANCIALS -0,0770
ISGEN ISE NATIONAL FINANCIALS -0,0924
EGHOL ISE NATIONAL FINANCIALS -0,6040
EGFIN ISE NATIONAL FINANCIALS -1,0907
SEKFK ISE NATIONAL FINANCIALS -2,0105
DENIZ ISE NATIONAL FINANCIALS 3,0887
VAKBN ISE NATIONAL FINANCIALS -0,2339
GOLDS ISE NATIONAL INDUSTRIALS -0,1409
KARSN ISE NATIONAL INDUSTRIALS -0,2569
NUHCM ISE NATIONAL INDUSTRIALS 0,6930
SKPLC ISE NATIONAL INDUSTRIALS 0,0224
LIOYS ISE NATIONAL INDUSTRIALS -0,5979
ALKİM ISE NATIONAL INDUSTRIALS 0,7386
DOBUR ISE NATIONAL INDUSTRIALS -0,3604
ERSU ISE NATIONAL INDUSTRIALS 0,6487
SODAS ISE NATIONAL INDUSTRIALS -0,0492
BSOKE ISE NATIONAL INDUSTRIALS 0,1844
SEZGD ISE NATIONAL INDUSTRIALS -0,5986
ALYAG ISE NATIONAL INDUSTRIALS -0,3547
DENTA ISE NATIONAL INDUSTRIALS 0,4771
IPMAT ISE NATIONAL INDUSTRIALS -0,3417
MNDRS ISE NATIONAL INDUSTRIALS -0,0277
ALKA ISE NATIONAL INDUSTRIALS 0,6389
KOZAD ISE NATIONAL INDUSTRIALS -1,0738
GEREL ISE NATIONAL INDUSTRIALS -2,9945
DESA ISE NATIONAL INDUSTRIALS -1,9155
BURVA ISE NATIONAL INDUSTRIALS -2,1166
TTRAK ISE NATIONAL INDUSTRIALS 0,6766
MRTGG ISE NATIONAL INDUSTRIALS -0,4495
Table 9: Abnormal Returns Sorted by Industry (continued)
Stock
Code Industry
3-yr HpAR AKSUE ISE NATIONAL SERVICES 0,5340
ZOREN ISE NATIONAL SERVICES 0,8146
ACIBD ISE NATIONAL SERVICES 0,2243
AKENR ISE NATIONAL SERVICES 0,4448
AYEN ISE NATIONAL SERVICES -0,1598
TCELL ISE NATIONAL SERVICES -0,3908
TEKTU ISE NATIONAL SERVICES -0,5449
FVORI ISE NATIONAL SERVICES -0,5247
SANKO ISE NATIONAL SERVICES 0,1761
GSRAY ISE NATIONAL SERVICES -1,2545
BJKAS ISE NATIONAL SERVICES -1,8007
METUR ISE NATIONAL SERVICES -1,7701
FENER ISE NATIONAL SERVICES -0,2966
DOAS ISE NATIONAL SERVICES -1,7293
AFMAS ISE NATIONAL SERVICES -1,1638
TSPOR ISE NATIONAL SERVICES 2,0043
BIMAS ISE NATIONAL SERVICES 3,1168
RYSAS ISE NATIONAL SERVICES -0,3752
LOGO ISE NATIONAL TECHNOLOGY -0,0240
ESCOM ISE NATIONAL TECHNOLOGY -0,4361
LINK ISE NATIONAL TECHNOLOGY -0,6607
ARENA ISE NATIONAL TECHNOLOGY -0,9406
INDES ISE NATIONAL TECHNOLOGY -1,3426
PKART ISE NATIONAL TECHNOLOGY -0,9384
ANELT ISE NATIONAL TECHNOLOGY 0,0712
4.3.2. Abnormal Returns Sorted by Year-of-Issue
Sorting the initial public offerings with respect to their issue years, as illustrated in Table 10, leads to the conclusion that only 2 out of 7 years with at least one IPO, have positive abnormal returns. One can also see that the stocks coming to market in the year 2005 have an average 3-year abnormal return of 90.18 percent. The other positive average abnormal return of 17.24 percent belongs to the IPOs of the year 1999.
On the other hand, stocks issued in years 2000, 2002, 2003, 2004, and 2006 have not been able to make returns over the market. The biggest losers of all are the year 2003 with an average abnormal return of -203.41 percent and 2002 with -160.84 percent.
Table 10. Abnormal Returns Sorted by Issue Year
Issue Year # of Issues % of All Issues The Average Abnormal Return on IPOs 1999 2 0,0345 0,1724 2000 34 0,5862 -0,0906 2001 0 0,0000 NA 2002 3 0,0517 -1,6085 2003 2 0,0345 -2,0341 2004 10 0,1724 -0,7748 2005 5 0,0862 0,9018 2006 2 0,0345 -0,3052
Just like in the case of raw returns, one of the reasons of negative abnormal returns of IPOs coming to market in 2000 is the fact that by the third year, the stocks had not completely got rid of the effect of the 2001 crisis. Moreover, IPOs of 2003 and 2004 could not exceed the market returns. This is possibly a consequence of the fact that some of the IPOs, despite having positive raw returns, were unable to keep up with the irrepressible stock market. Finally, one can suggest that the mortgage crisis leading to the plummet of stock prices was the main reason behind the low performance of IPOs that were issued in 2006.
4.4. Wealth Relative
Another indication of IPO performance is the wealth relative. Wealth relative is the ratio of average gross returns on IPOs to that of the stock market. If the wealth relative is greater than 1.00, then one can say that IPOs are performing better than the ISE 100 Index. However, a wealth relative that is less than 1.00 is an indication of IPO underperformance.
The 3-year wealth relative for our sample of 58 IPOs is 0.7979 which is close to the one Ritter (1991) calculated as 0.88 and to the one Ritter and Loughran (1995) calculated as 0.80 for US IPOs. The wealth relative of 0.7979 shows that the Turkish IPOs of 1999-2006 have underperformed the ISE 100 Index for the same period.
I also find the wealth relatives for each sector grouping of IPOs in chapter 4.4.1, and for each issue year in chapter 4.4.2.
4.4.1. Wealth Relatives for Industries
In Table 11 are the wealth relatives for each sector grouping of IPOs. All the wealth relatives are less than 1.00 so one can say that all the sectors underperform the stock market. Such wealth relatives are already expected as the abnormal returns were found to be negative as shown in Table 9.
Table 11. Wealth Relatives Sorted by Industry
Industry Raw IPO Returns ISE 100 Index Return Wealth Relative ISE NATIONAL FINANCIALS 0,1131 0,2210 0,9116 ISE NATIONAL INDUSTRIALS -0,0649 0,2623 0,7408 ISE NATIONAL SERVICES 0,3050 0,4547 0,8971 ISE NATIONAL TECHNOLOGY -0,2598 0,3035 0,5679
4.4.2. Wealth Relatives for Issue Years
Table 12 below illustrates that the years 2000, 2002, 2003, and 2004 have 3-year wealth relatives that are less than 1.00 while only the 3-years 1999 and 2005 have positive ones, 1.15 and 1.83 respectively. In other words, as mentioned in
chapter 4.3.2., the IPOs of 1999 and 2005 have positive abnormal returns, which is equivalent to a wealth relative greater than 1.00.
Table 12. Wealth Relatives Sorted by Issue Year
Year Average Raw Return on IPOs Average ISE 100 Index Return Wealth Relative 1999 0,3032 0,1308 1,1524 2000 -0,3237 -0,2330 0,8819 2002 -0,0310 1,5775 0,3760 2003 0,9037 2,9379 0,4834 2004 0,8313 1,6061 0,7027 2005 0,9872 0,0854 1,8309 2006 -0,7253 -0,4201 0,4737
5. Conclusion
For a sample of 58 Turkish IPOs that went public between November 1999 and February 2006, I find that Turkish IPOs act in a similar way to international IPOs and underperform the stock market in the long-run. The 3-year average return of Turkish IPOs, excluding the initial return, is only 5.37 percent while that of the Istanbul Stock Exchange is 32.06 percent. This makes the average 3-year abnormal return of IPOs -26.69 percent. In addition, the wealth relative is only 0.7979 at the end of three years. In other words, an investor who bought each IPO at the closing price on the first day of issue and held it for three years would have only 0.7979 Turkish Liras relative to 1 Lira invested in the ISE 100.
Moreover, IPOs in certain industries such as ISE National Financials and ISE National Services have positive raw returns while ISE National Industrials and ISE National Technology stocks have negative returns. Though, the average abnormal returns of each and every one of these sector groupings is negative. Equivalently, they have wealth relatives all of which are less than 1.00.
Besides, sorting the abnormal returns by the issue years shows that only the IPOs coming to market in 1999 and 2005 have positive abnormal returns (17.24 percent and 90.18 percent respectively). The high excess return of 90.18 percent can be interpreted as a result of the high stock prices encouraged by the
stock market bubble that burst in late 2008, just before the end of the 3-year holding period of IPOs of the year 2005.
In brief, the long-term performance of IPOs has been a much studied subject all around the globe. Most of these research have concluded that IPOs are, in the long-term, underperformers. Thus, in our sample years, it appears that a simple investment strategy of shorting IPOs and going long the ISE 100 Index would be profitable for investors.
Bibliography
Aggarwal, Reena, Ricardo Leal, and Leonardo Hernandez, (1993). “The aftermarket performance of initial public offerings in Latin America -
New Issues Markets Special Issue”. Financial Management (Financial
Management Association).
Firth, Michael, (1997). “An analysis of the stock market performance of new issues in New Zealand”, Pacific-Basin Finance Journal, 5: 63-85.
Houge, Todd and Tim Loughran, (1999). “Growth fixation and the
performance of bank initial public offerings, 1983-1991”, Journal of
Banking & Finance, 23: 1277-1301.
Jelic, Ranko, Brahim Saadouni, and Richard Briston, (2001). “Performance of Malaysian IPOs: Underwriters reputation and management earnings
forecasts”, Pacific-Basin Finance Journal, 9: 457-486.
Kooli, Maher and Jean-Marc Suret, (2004). “The aftermarket performance of initial public offerings in Canada”, Journal of Multinational Financial
Management, 14: 47-66.
Kunz, Roger M. and Reena Aggarwal, (1994). “Why Initial Public Offerings are Underpriced: Evidence from Switzerland ”, The Journal of Banking
and Finance, 18: 705-723.
Ritter, Jay, (1991). “The Long-Run Performance of Initial Public Offerings”, Journal of Finance (March 1991), pp. 3-27.
Ritter, Jay and Tim Loughran, (1995). “The New Issues Puzzle”, The Journal of Finance, Vol. 50, No.1.
Sevim, Serafettin and Soner Akkoc, (2006). “Ilk Halka Arzların Uzun Vadeli Performansları ve Ucuz Fiyat Olgusu: Istanbul Menkul Kıymetler
Borsasi’nda Sektorel Karsilastirmali Bir Uygulama”, Dumlupinar
Universitesi Sosyal Bilimler Dergisi, 16: 117-122.
Uhlir, Helmut, (1989). “Going Public in F.R.G.”, in A Reappraisal of the Efficiency of Financial Markets, R.M. Guimaraes, B. Kingsman, and S. Taylor (eds.), New York, Springer-Verlang.
Unlu, Ulas, (2006). “Turkiye’de Ilk Defa Halka Arz Edilen Bankacilik Sektoru Hisse Senetlerinin Uzun Donem Fiyat Performanslari”, Erciyes
Üniversitesi Iktisadi ve Idari Bilimler Fakültesi Dergisi, 27, pp. 119-147.