17 April 2012
Dear Yusuf Alparslan Argun, Sukru Dursun and Mehmet Emin Argun,
Subject: Abstract acceptance for ISSD 2012
I am pleased to inform you that your co-authored abstract entitled “Indoor Air Quality of Some Social Areas in Konya City Center, Turkey” has been accepted for poster session at the International Symposium on Sustainable Development (ISSD 2012) to be held in Sarajevo, Bosnia and Herzegovina from 30 May-1 June 2012.
Looking forward to meeting you in Sarajevo Best Regards
Prof. Dr. Meliha Handzic
CENTER, TURKEY
Yusuf Alparslan Argun1, Sukru Dursun2,*, Mehmet Emin Argun2,*
1
MSc. Student, Aksaray University, Institute of Science, Environmental Engineering Dept.
2
Selcuk University, Engineering Faculty, Environ. Eng. Dep. 42003-Konya-Turkey [email protected]; [email protected].
* Corresponding Author
ABSTRACT:
Indoor activities, building characteristics and outdoor climatic conditions have all affected indoor environment air quality. Some peoples, especially young and unemployed persons spend on about 90 % of their times indoor environment. Indoor air quality has direct effect on human health. One of the most important parameter for indoor air quality is particulate matter (PM2.5).
Therefore, determination of personal exposure to particulate matter (PM2.5) in these areas
especially in café is predicted to be key role. Long exposure to particulate matters may lead to numerous diseases.
In this study, particulate matter was determined in different social areas at the morning and evening for 30-sec. intervals during 15 minutes. Study area is heavily urbanized by a lot of buildings and also surrounded by roads with intensive traffic circulation. It was concluded from this study that some parameters such as ventilation, people circulation, ceiling height, construction shape and floor level have affected the measured concentration of particulate matter. The analyses have evaluated by personal Particle Meter equipment. Different conditions of the cafes for the PM values are also evaluated. Maximum and minimum PM2.5 concentrations were
obtained as 3.485 µg/m3 for a Hubble-Bubble Cafe and 23 µg/m3 for a Book Store. Numbers of obtained data were found to be higher than the EPA’s standards for indoor environment. EPA established that PM concentration should be lower than 20 µg/m3 for indoors. Turkey has only outdoor air quality limitations for PM10 which is about 150 µg/m3 for long exposure and 300
µg/m3 for short exposure
Keywords: indoor air quality, particulate matter, human health.
INTRODUCTION
Indoor environment air quality is interacted and affected by the local outdoor air, specific building characteristics and indoor activities (Stranger et al., 2007; 2008). Peoples lived in the city center spend on about 90 % of their times indoor environment (Soysal and Demiral, 2007). Some peoples in Turkey especially young and unemployed persons spend most of their spare time at social areas such as cafe, coffeehouses, internet café, shopping stores and book stores. Therefore, determination of personal exposure to air pollution in these areas especially in café is predicted to be key role (Stranger et al., 2008). PM2.5 is generally identified as particulate matter
having diameter less than 2.5 µm which is mostly result of human activities, food cooking operations, diesel engine exhaust and dust from wood burning (Zheng et al., 2002). Long exposure to particulate matters may lead to some respiratory diseases changing from basic couch and allergy to more serious lung diseases namely pneumoconiosis (Jones et al., 2002; Kim et al., 2005).
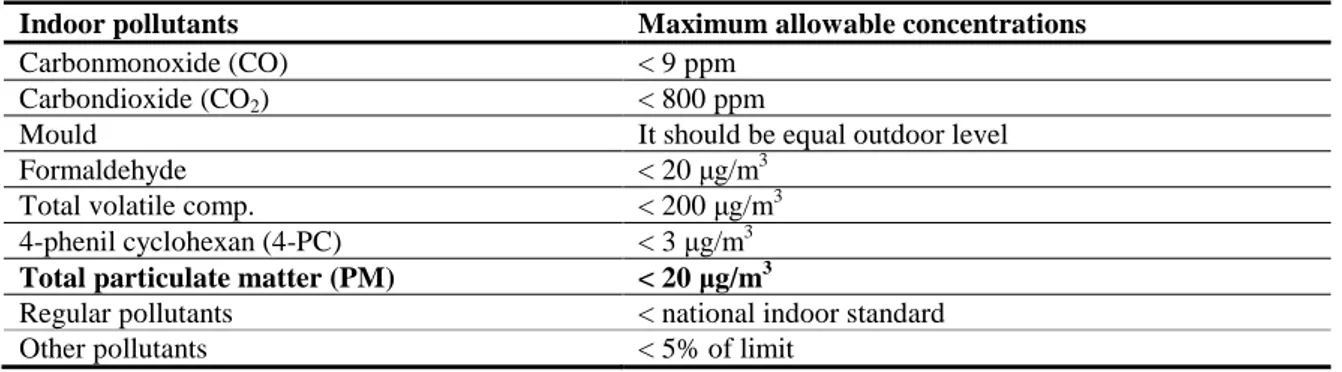
Establishment of certain PM limitation becomes a necessity for government. However, the PM limitations for indoor air quality have been newly established and a lot of governments have even no arrangement. Table 1 shows the EPA limitations for indoors and concluded that PM
concentration should be lower than 20 µg/m3 (EPA, 2001; Gonullu et al., 2002). Turkey has only outdoor air quality limitations for PM10 which is about 150 µg/m3 for long exposure and 300
µg/m3 for short exposure (Anon., 1986).
Table 1: Maximum indoor air quality limits according to EPA (EPA, 2001; Gonullu et al., 2002)
Indoor pollutants Maximum allowable concentrations
Carbonmonoxide (CO) < 9 ppm
Carbondioxide (CO2) < 800 ppm
Mould It should be equal outdoor level
Formaldehyde < 20 µg/m3
Total volatile comp. < 200 µg/m3 4-phenil cyclohexan (4-PC) < 3 µg/m3 Total particulate matter (PM) < 20 µg/m3
Regular pollutants < national indoor standard
Other pollutants < 5% of limit
Materials and Methods
Determination of particulate matter in 13 social areas at three different regions in the city center of Konya (Turkiye) was investigated. These areas are surrounded by roads with intensive buildings and traffic circulation. During each sampling period, PM2.5 concentrations were
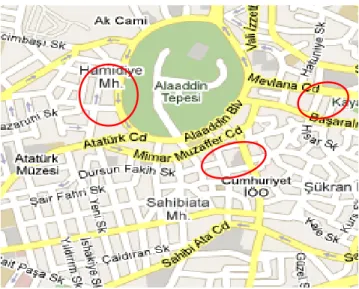
measured using a personal Particle Meter (personal Data RAM, pDR1200, MIE Inc., Bedford, MA, 2000) in the study areas. The obtained data recorded at 30-sec. intervals during 15 minutes (Turkish Standards for air sampling). The map of study areas is given in Figure 1. Table 2 also shows some information about measuring points.
Figure 1: The map of study areas in the city center of Konya
RESULTS AND DISCUSSIONS
Average and maximum PM2.5 concentration at the morning and evening periods are
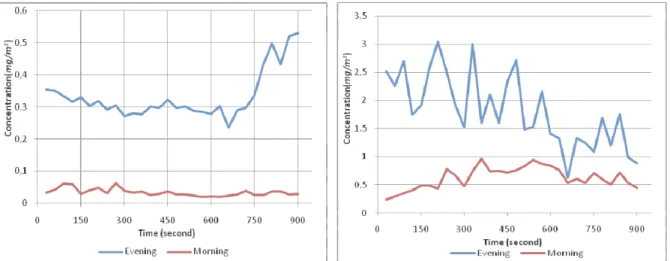
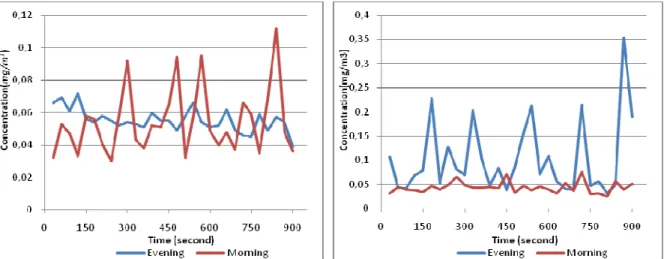
summarized in Table 3. Measuring point 1 is a pizza cafe where some types of pizzas, macaronis and other fast foods produced in. Average and maximum PM concentrations of this point were 34
µg/m3 and 112 µg/m3 at the morning and 338 µg/m3 and 575 µg/m3 at the evening, respectively (Figure 2). The probable reason of this relatively high PM level may be due uprising of adsorbed dusts from the sponge covering furniture and chairs by ventilation of the area. Some extra peak values were observed at the end of the evening measuring period probably due to dust of flour and entering some people group.
The highest levels among all measuring point were obtained in MP2, MP4 and MP8 as 3485, 1812 and 1208 µg/m3, respectively. These points are hubble-bubble (nargile in Turkish) cafe and therefore a lot of smokes might be present. The high values may be a result of these smokes. It was also concluded that sponge covering of furniture, hanging of carpets on the walls
and wavy structures of the cafe (MP2) caused to increase of PM concentration. Also, for MP 8, the basement conditions could decrease ventilation and altered PM concentrations.
Table 2: Physical conditions of measuring points
Measurin g Point (MP) Type of MP Approx area (m2) Ceiling Height (m) Number of floor Measuring floor
1 Pizza cafe 40 2.3 5 Ground
2 Hubble-bubble 100 2.4 5 Ground
3 Coffee house 90 2.8 6 1st floor
4 Hubble-bubble 80 3.0 6 Ground
5 Internet cafe 100 2.7 4 Ground
6 Coffee house 90 2.9 5 1st floor
7 Shop 200 3.5 5 Ground
8 Hubble-bubble 100 2.2 6 Basement
9 Coffee house 90 2.9 5 2nd floor
10 Tea house 30 3.0 5 Ground
11 Billiards saloon 160 3.1 2 1st flor
12 Book store 110 3.0 4 Ground
13 Restaurant 90 2.7 4 Ground
Table 3: Average and maximum PM2.5 concentration at the morning and evening periods for
each sampling point
Sampling Point
Morning measurement Evening Measurement
TWA (mg/m3) MAX (mg/m3) TWA (mg/m3) MAX (mg/m3)
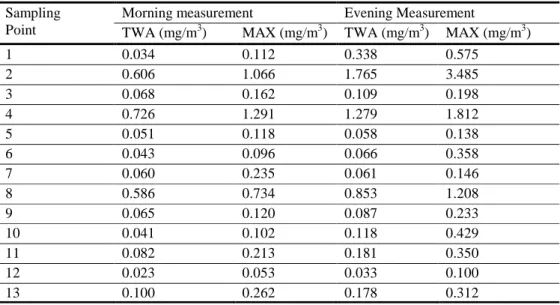
1 0.034 0.112 0.338 0.575 2 0.606 1.066 1.765 3.485 3 0.068 0.162 0.109 0.198 4 0.726 1.291 1.279 1.812 5 0.051 0.118 0.058 0.138 6 0.043 0.096 0.066 0.358 7 0.060 0.235 0.061 0.146 8 0.586 0.734 0.853 1.208 9 0.065 0.120 0.087 0.233 10 0.041 0.102 0.118 0.429 11 0.082 0.213 0.181 0.350 12 0.023 0.053 0.033 0.100 13 0.100 0.262 0.178 0.312
Figure 2: PM2.5 concentration of measuring point 1 (MP1) and 2 (MP2) at the morning and
evening periods.
Figure 3: PM2.5 concentration of (MP3) and (MP4) at the morning and evening periods.
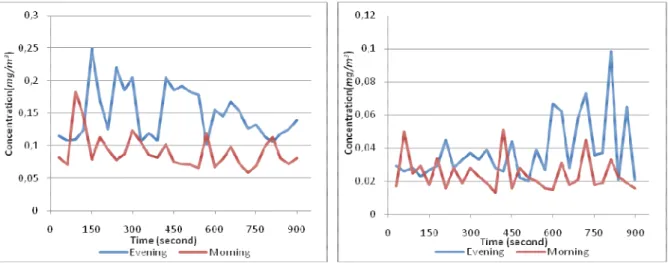
The measuring results obtained from the coffee houses (MP3, 5, 6, 9) were generally low levels according to hubble-bubble and pizza cafes although they were still a little higher than EPA’s limit for indoor PM concentration. The relatively low levels may be a result of good ventilation, wooden furniture and not smoking.
Figure 4: PM2.5 concentration of (MP5) and (MP6) at the morning and evening periods.
Figure 5: PM2.5 concentration of (MP7) and (MP8) at the morning and evening periods.
Shopping centers such as MP 7 and MP 12 are generally large, crowd and having huge human circulation during the day. Therefore, it may be expected that these types of areas have high particulate matter concentration. However, measuring results showed that good ventilation, high ceiling and clean conditions might lead to lower PM concentration.
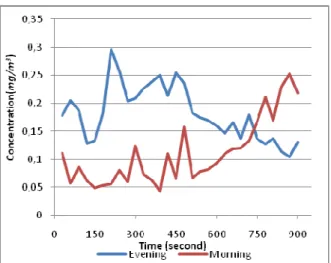
Billiards saloon (MP 11) had also high particulate matters according to measuring results such as 213 µg/m3 for morning and 350 µg/m3 for evening measurements. Playing billiards, backgammon, and cards by a lot of peoples caused to increase the PM concentration of this place. In a restaurant (MP 13), average and maximum particulate matter concentrations were 100
µg/m3 and 262 µg/m3 at the morning and 178 µg/m3 and 312 µg/m3 at the evening measurements, respectively. This may be due to cooking processes and high circulation of people during the day.
Figure 6: PM2.5 concentration of (MP9) and (MP10) at the morning and evening periods.
Figure 8: PM2.5 concentration of (MP13) at morning and evening periods.
CONCLUSION
Particulate matters (PM2.5) were determined in 13 different social areas at the morning and
evening. The major sources of the particles in the measuring points were obtained as hubble-bubble and tobacco smoke. Therefore, health effects of smoking at indoor environment were forced the government to arrange prohibitions against to stop smoking in indoor environment in Turkey.Some particle sources resulted from kitchen such as flour dust and cooking gas were also determined to be major source of particulate matter in the restaurants and pizza cafe. In addition, particle transport from outside via doors, windows or gaps of the building and therefore outdoor weather situation may have also effect on the particulate matter increase (Estekova et. al., 2010). It was also concluded from this study that some parameters such as ventilation, people circulation, ceiling height, construction shape and located floor have affected the measured concentration of particulate matter.
The author thanks the Selcuk University Research Fund (SU-BAP) for its financial support to symposium attendance.
REFERENCES
Stranger, M., Potgieter-Vermaak, S.S. and R. Van Grieken (2007) Comparative overview of
indoor air quality in Antwerp, Environ. Int., 33, 6.
Stranger, M., Potgieter-Vermaak, S.S. and R. Van Grieken (2008) Characterization of indoor air
quality in primary schools in Antwerp, Belgium, Indoor Air, 18, 454–463.
Soysal, A. and Demiral, Y. (2007) Kapalı Ortam Hava Kirliliği (in Turkish), TSK Koruyucu Hekimlik Bülteni, 6, 221-226.
Zheng, M., Cass, G.R., Schauer, J.J. and Edgerton, E.S. (2002) Source apportionment of PM2.5 in
the Southeastern United States using solvent-extractable organic compounds as tracers,
Environ Sci Technol, 36, 2361-2371.
Jones, T., Blackmore, P., Leach, M., Bérubé, K., Sexton K. and Richards, R. (2002)
Characterization of airborne particles collected within and proximal to an opencast coalmine: South Wales, U.K. Environmental Monitoring and Assessment, 75, 293–312.
Kim, J.H., Lim,D.H., Kim, J.K., Jeong S.J. and Son, B.K. (2005) Effects of Particulate Matter
(PM10) on The Pulmonary Function of Middle-School Children, J Korean Med Sci. 20,
42-45.
EPA (2001), Case Study Two: EPA’s Research Triangle Park Laboratory Facility.
Gonullu, M.T., Bayhan, H., Avşar, Y. and Arslankaya, E. (2002) YTÜ şevket sabancı kütüphane binası iç ortam havasındaki partiküllerin incelenmesi (In Turkish), Harran University
Anonymous (1986), Air Quality Control Regulation (In Turkish), Turkish Official Gazete No: 19269 and date: 2.11.1986.
Estekova, A., Stevulova, N. and Kubincova, L. (2010) Particulate matter investigation in indoor