Heating and cooling vehicle seat via air conditioner coils
Ali ATES, Eyub CANLI*Selcuk University, Mechanical Engineering Department, 42003 Konya, Turkey
Abstract. A real vehicle seat was modified in order to locate evaporator coils extended from a vehicle air conditioner system just beneath the back and cushion surfaces. The seat back and cushion surface temperatures were measured by several thermocouples. Air conditioner system was operated in heat pump and cooling modes for different compressor speeds. After steady operation of the air conditioner was attained, a live manikin sat to the seat and remained in sitting position for five minutes. The temperatures were recorded during the existence of the manikin and they were recorded for an additional five minutes after the manikin left the seat. The coils embedded under the seat surfaces were made of flexible hoses for the sake of usage due to the shape changing seat surfaces under the load of the manikin weight. Coils were in parallel configuration by the help of a distributer and collector. The temperatures of the seat surfaces were evaluated in respect of the thermal comfort and feasibility of the application. Air conditioner system was also monitored in respect of the COP and energy consumption values. At the instance of sitting, the transient response of the system is very significant due to the weight of the live manikin. However it settles quickly. Cooling was observed to be more realizable while heating seat surfaces had problems due to flow blockage. There were no significant discomfort issues due to the seat surface temperatures and the existence of the coils. The surface temperatures of the seat back exhibited differences from the seat cushion although the formations were same. The orientation of the coils and the weight of the passenger were concluded to be the reason for that. COP was found to be changing between 3 and 3.56 for cooling mode while the highest amount was found for 600 rev/min compressor speed in cooling operation. Heat pump operation had relatively higher COP values ranging between 3.31-3.64. 700 rev/min compressor speed gave the 3.64 COP value for heat pump operation. The difference between COP values of the working modes was concluded to be due to the seat coils and their effect on the additional pumping work. The potential of the application and possible field of studies were evaluated according to the conducted tests and the survey about the topic.
1 Introduction
Vehicle passenger comfort is both a commercial and a health issue. By the passing time, human needs are changing due to the life style that is experienced and past
luxuries become necessities. Thermal comfort
management of vehicle cabins can be regarded as one of these changing needs. It is highly important for companies and consumers to have a reliable thermal comfort system in their vehicles. However comfort sense is subjective and changes from passenger to passenger. This opens a new field of study alongside of the work for developing tools for thermal management. The new field is machine learning and control for taking or reducing the responsibility of passenger to arrange the proper conditions for thermal comfort in a vehicle cabin. Nevertheless, developing tools for thermal comfort and assessment of those tools are still very important since their outcomes will be used for modelling and controlling comfort conditions.
Commonly thermal comfort management in vehicles are using an air conditioner system for cooling and dehumidifying air. For heating, electrical resistances and
engine waste heat are being used. The main challenge here is the subjective comfort sense. It changes from person to person and the management depends passenger’s decisions most of the time. Since air is the fluid that transfers heat most of the time, establishing desired comfort conditions for all passengers is not an easy task. First of all, flow of the air is complex and the outlet guides are incapable of control for the whole volume. There is humidity control issue because moisture constantly produced by passengers and transported by air and ends up condensing at the evaporator surfaces of the air conditioner. Most of the vehicle air conditioner systems don’t have a moisture addition system in to air. Another issue that negatively affects the passenger comfort is the body surfaces facing seat surfaces. The temperature of these surfaces increases to a point that skin starts to produce sweat. The only way to transfer this matter is diffusion towards seat material. Even the seat has a design that enables evaporation from its surfaces, this would lead to uncontrolled cooling. Otherwise, the sweat that remains at the passenger seat interface would lead to additional unrest and may be odour and stains. If it could be
possible to arrange the seat surface to a certain temperature that enables avoiding the skin to sweat, this uncomforting factor can be eliminated. Therefore a thermal management system for seat surfaces with cooling ability can support the vehicle cabin thermal comfort management system. Some points relating to this approach are given below.
Convective cooling or heating can lead to diseases due to rapid temperature changes and dehumidification. So, conduction supported thermal management via the seat surfaces can reduce the load on the convective thermal management.
Although electrical resistances are good for surface heating, they cannot be used for cooling.
Air conditioner heat exchanger coils can be located under the seat surfaces for acting as evaporator and condenser according to the desired operation. Therefore seat surfaces can be cooled or heated. However the material of so called coils should deal the shape change of the seat surfaces due to the weight of the passenger. A flexible structure is needed.
Heating with condenser coils are more efficient than heating with electrical resistances in terms of consumed electricity and energy.
Each passenger can have different seat surface temperature thus can have comfort conditions to its own. (This point is also relevant for machine learning and control studies – with the aid of surface temperature, humidity and motion sensors).
Breathing seat surfaces can transport moisture but lead to uncontrolled cooling.
Moisture is reported to be a more significant factor on thermal comfort for passengers comparing to the seat surface temperatures [1]. Thermoelectrical cooling (Seebeck or Peltier
effect) is not a solution that is commercially accepted. It has some intrinsic problems for the application such as serial connection that can be easily damaged, rigid structure that can be broken due to the weight of the passenger, instant temperature rise of the cooled surface when the energy is shut down and etc. Also the cooled air still holds an important amount of humidity because the cooling temperature is still high for dehumidification and it may result in clammy feelings.
When convection cooling is supported conduction cooling, comfort management can be enhanced and personalized.
Thermal management of car seat surfaces with air conditioner systems has higher initial cost but lower energy consumption comparing to electrical resistances. Operational costs may play a significant role on deciding which to apply.
Seat thermal management is the only way to deal with passenger needs for open-to-environment vehicles and bikes.
The subject has also potential for scientific and engineering research although it can be regarded as an old topic. The advancement towards artificial intelligence and current tools available are encouraging for the development of a universal controller that can be applied to any car with a digital air conditioner unit. The air conditioner unit can also be supported by auxiliary equipment such as temperature, pressure, humidity and motion sensors. Internet of things approach can also feed such controller by collecting data of passenger thermal comfort conditions and can improve the controller in time. Some more remarks about this projection are given below.
Machine learning and control can be a
significant tool for thermal comfort
management for vehicles. Passenger linguistic statements, surface temperatures and humidity, and motion sensors can be used as input parameters to decide which operational conditions are proper and which values of operational parameters is to set.
To aid machine learning systems, mathematical models and correlations should be investigated for thermal management tools such as air conditioner coils embedded under seat surfaces. Also statistical tools such as Taguchi and ANOVA can be used to determine the significance of factors for mathematical models. There is a potential of novel heat exchanger
designs for using in or on the vehicle seats. Due to the usage in vehicles, refrigerants should
possess particular properties considering the possible car accidents or failures. These properties can be but not limited to incombustibility, non-toxic, non-corrosive, etc. CO2 is a promising refrigerant.
At this point, some recent reports in the literature can give an insight about the ongoing works. Ates et al. [2] used fuzzy logic tool box in Matlab software in order to interpolate and extrapolate data of a vehicle air conditioner system used for heating seats. They used compressor speed and time as input parameters and obtained seat surface temperatures as output parameters. Although their results suggest that the fuzzy machine can interpolate and extrapolate, using that fuzzy machine as a control tool seems not logical because it needs iteration of input parameters to get the desired output parameters. Additionally the input parameters are very case specific and it is hard to use the fuzzy machine on other systems. Still the work is an example for artificial intelligence for aiding thermal comfort in vehicle cabins.
It is a very hard task to convert qualitative responses of passengers to certain quantitative values in vehicle cabin thermal comfort issue. The common way is asking linguistic questions and then assigning some quantities for each answer. After processing a substantial amount of questionnaires, statistical tools are used to obtain quantitative results. An example is the report of Ohnaka
et al. [3]. Ten males were surveyed in their study to assess the solar irradiation on thermal comfort of seated passengers. Their answers to the tested cases are varied from slightly cool to extremely hot with 7 levels. They also asked questions for 9 different parts of the body and tried to get an overall result. However their results have substantial mean and standard deviation values.
In the work of Oi et al. [4], authors reported a vehicle seat heating system with electrical resistances for initial warm-up period. In their experimental work, four different environmental temperatures that are 5, 10, 15, or 20 oC tested for seat heating and without seat heating. They suggest that passenger can heat itself slightly only after 15 oC without heat seating. With heat seating, nearly 20 minutes should pass for reaching a seat surface temperature close to body temperature. It is also interesting that thermal sensation increases with time and this sensation is higher for lower environment temperatures even for the same surface temperatures. It is also reported that thermal comfort decreases as the time passes from a certain point, namely about 10 minutes.
The paper of Deng et al. [5] clearly shows that personal heating of a person heated from the seat surfaces increases thermal sensation and comfort while it also shows that there is a substantial deviation interval of the results. The levels of the deviation for thermal sensation and comfort of youths, elders and genders can be viewed from the work.
Alahmer et al. [6] used Berkeley and Fanger models to decide the effect of relative humidity on thermal sensation and comfort state of passengers in a vehicle for cooling and heating processes. This study is different from above examples since they used a thermal manikin and quantitative measurements to detect the comfort zones and thermal sensation. It is said that early stage of cooling necessitates low relative humidity values while steady operation of cooling needs a higher level of relative humidity. Vice versa can be said for the heating process.
As it will be seen in the final part of this paper, flexible tools for thermal management of the vehicle seats such as flexible rods, planes and tubes, are proposed for the sake of applicability and ergonomics. An example can be viewed in the paper of Park et al. [7]. They constitute a plane heater composed of graphite and carbon nanotube hybrid nanocomposite layer that can be used in heating vehicle seats.
The review paper of Zhang et al. [8] contains some examples of thermal management of vehicle seat though only one cooling work can be viewable. The rest are about heating the seat. The one work about cooling the
vehicle seat contains information about the
thermoelectrical cooling [9]. In the mentioned seat, Peltier plates and a blower is embodied to the vehicle seat. The main reason of this configuration is said to be the Electrical Vehicle which has difficulties having a conventional air conditioner system. The brand of the seat is reported as Amerigon.
Actually, thermoelectric devices (based on Seebeck effect; using thermocouples and electrical current to pump or absorb heat from a surface) can be seen a lot in
vehicle seat thermal management studies. One of them is reported from Elarusi et al. [10]. They utilized analytical means to determine an optimal design of a thermoelectric car seat thermal management tool. The element length, cross-section area and number of thermocouples are investigated. The thermoelectric is projected to be more apparent according to a presentation of Fairbanks [11]. The author proposed that thin film technology would boost the COP of thermoelectric by 2010. A CCSTM Vehicle Seat Application is also presented. Another thermoelectric seat cooling study is reported by Feher [12].
Feher also proposed a stirling engine for heating and cooling vehicle seat [13]. It is a novel and innovative way of approaching the topic. The author argue that the seat heating and cooling with Stirling engine has some superiorities to peltier systems. The device heat or cools the air and send it to the passenger through a pad having pores at the seat surfaces.
There are different tools for dealing with seat thermal management such as heat pipes [14] and hvac systems [15]. Actually the paper of Wolfe et al. [15] is the only work similar to the present paper encountered in the literature so far. But again it offers to supply conditioned air from hvac to a thermoelectrical device prior to the air pores of the seat. So it is not utilizing hvac coils directly for seat heating and cooling.
According to the conducted literature survey, two way usage (heating and cooling) of heat exchangers coils of a vehicle air conditioner system embedded into car seat have not been encountered as an experimental work. Therefore heating and cooling of a vehicle seat by using the heat exchanger coils of an air conditioner system is investigated experimentally in this work. The main aim is to see the system response to the passenger when he/she sits on the seat, the change of temperatures in time, the distribution of the temperatures according to the location on the seat, the operation of the air conditioner system while the cabin side heat exchanger is modified to extend towards the seat, the applicability of flexible hoses as heat exchanger coils embedded under seat surfaces. The experimental setup is described in detail and visuals are provided. The transient surface temperatures as well as the steady system performance values such as COP, transferred heat etc are given. Future projections, remarks and propositions are also presented in the conclusion section.
2
Experimental
equipment
and
procedure
A Renault Toros SW branded end of life passenger car cabin was selected as the test chamber. Normally those cars don’t have any air conditioner systems with refrigerants. They have relatively simple ventilation that circulates interior air of the vehicle cabin or mix it with ambient air. It can also circulate the air through a way to use a portion of the dissipated heat from the engine. Therefore a vehicle type air conditioner system was purchased and used. However the compressor was driven
by an electrical motor. The details and equipments of the air conditioner system are given below.
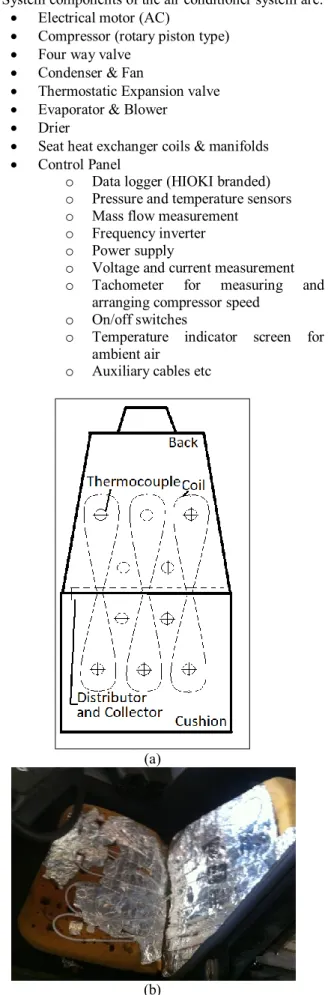
As heat exchanging part with the seat surfaces, flexible tubes were used as passages for the refrigerant. So the car seat was undressed, and tubes were placed on top of the damping material (a type of foam). To obtain a more uniform temperature distribution for the cushion and back surfaces, aluminium sheets were laid on the tubes. The refrigerant was distributed by a distributer manifold to the coils and then collected by a collector manifold. The only way to maintain and arrange the surface temperature is the speed of the compressor. 5 thermocouples were placed per each seat back and cushion surfaces. Two thermocouples were placed for distributor and collector manifolds. Totally 23 temperature measurements were done from different locations of the system and the remaining thermocouples different than the 10 on the seat surfaces were located at the inlet and outlet of the system parts such as compressor, expansion, heat exchanger. Additionally inlet and outlet pressures of the compressor and compressor speed were measured and recorded. The seat coil operation was changed to evaporator or condenser by using a four way valve. Heating experiments were done in cold season and cooling experiments were done in hot season. So there wasn’t any special air-conditioned volume surrounding the vehicle cabin but just a hangar. There was no direct sun light and an engine operation as a heat source. The compressor was driven by an electrical motor and the speed of the compressor was arranged by means of a frequency inverter. The frequency inverter changes the frequency of the grid electricity while the torque of the electrical motor remains almost constant. This is similar to most of the engine working intervals since the compressor only draws a very small amount of engine power (around 10%). Live manikins were used during experiments. Although their subjective opinions were asked, they are not included in this report.
The schematic seat and coils and a photograph of the modified seat after the experiments are given in Figure 1. Each surface has 3 coils and 5 thermocouples. Additional two thermocouples were placed to distributor and collector.
A schematic drawing of the air conditioner system is given in Figure 2. As it can be seen from the figure, a parallel line was drawn to distributor and collector for the seat while the original evaporator and blower was
maintained. Since the results are evaluated
comparatively and there is no significant heat source for the original evaporator and blower, this part is assumed to have no effect on the evaluation.
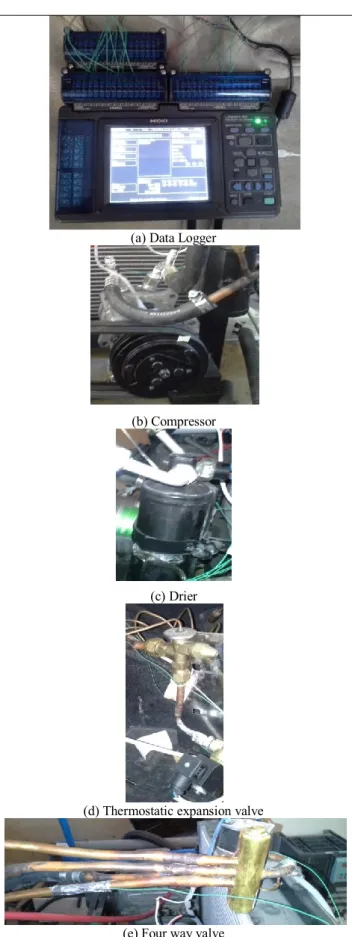
The images of the air conditioner and its control panel are given in Figure 3.
At the control panel, the two important equipments other than switches are the frequency controller and power supply. Power supply is used for supplying DC electricity to units such as pressure measurement, data logger and the indicator screen of ambient temperature. The pressure and temperature measurements are visible in the operation side image in Figure 3.
System components of the air conditioner system are: Electrical motor (AC)
Compressor (rotary piston type) Four way valve
Condenser & Fan
Thermostatic Expansion valve Evaporator & Blower
Drier
Seat heat exchanger coils & manifolds Control Panel
o Data logger (HIOKI branded) o Pressure and temperature sensors o Mass flow measurement
o Frequency inverter o Power supply
o Voltage and current measurement o Tachometer for measuring and
arranging compressor speed o On/off switches
o Temperature indicator screen for ambient air
o Auxiliary cables etc
(a)
(b)
Fig. 1. Modified vehicle seat (a) schematic view (b) photograph taken after the experiments
Fig. 2. Schematic air conditioner system
(a)
(b)
Fig. 3. Images of the air conditioner and its control panel (a) control side (b) operation side
Before each test, whole system was surveyed in order to check if there was any leak. Thermocouples again tested for their correct measurements before each test. Temperature data was collected per five seconds which corresponds to 0.2 Hz. Before each test for an arranged compressor speed, air conditioner first operated at idle conditions for five minutes. Then compressor speed was set and system was operated for ten minutes in order to ensure that system reaches its steady regime. Temperature measurement started after 10 minutes and recording continues for five minutes. A live manikin sat on the seat for five minutes. After the live manikin stood, recordings continued for additional five minutes. During the period when live manikin was sitting, the opinion of the live manikin about thermal comfort was asked. Tests were done for 12 compressor speeds starting from 500 rev/min to 1600 rev/min for 100 rev/min increments.
The cooling experiments were done in September, October and April 2014. Heating experiments were done in February and March 2014.
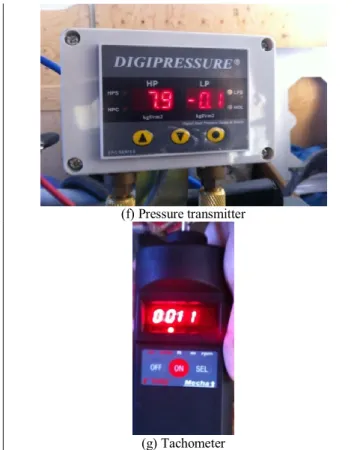
Images of the system components are given in Fig. 4.
(a) Data Logger
(b) Compressor
(c) Drier
(d) Thermostatic expansion valve
(f) Pressure transmitter
(g) Tachometer Fig. 4. System components
2.1. Data reduction
The mechanical work transmitted to the compressor from the electrical motor is calculated as below.
𝑊𝑒̇ = 𝑉 · 𝐼 · 𝑐𝑜𝑠 𝜙 · √3 · 𝜂𝑒𝑙 (1)
Here We denotes the power. V is voltage, I is current
in ampere, cos ϕ was read as 0.82 from the plate of the electrical engine and it is a factor against the work to be done due to the phase difference between the voltage and current emerging from the loads on the grid. ηel is the
efficiency of the electrical motor and taken as 0.85 catalogue value.
The ideal and real charts of pressure versus enthalpy and temperature versus entropy are given in Figure 5. The cycle points are indicated in these charts and they are needed to understand remaining data reduction equations.
The mechanical work done by the compressor in unit time, gathered and dissipated heats are given below respectively.
𝑊̇𝑐= 𝑚̇(ℎ2− ℎ1) (2) 𝑄̇𝐿= 𝑚̇(ℎ1− ℎ3) = 𝑚̇(ℎ1− ℎ4) (3) 𝑄̇𝐻= 𝑄̇𝐿+ 𝑊̇𝑐 (4)
At this point, Coefficient of Performance (COP) for heating and cooling are given below according to the above definitions.
Fig. 5. Idea and real P-h and T-s charts 𝐶𝑂𝑃𝐻=𝑊̇𝑄̇𝐻
𝑘𝑜𝑚𝑝. (5)
𝐶𝑂𝑃𝐶 =𝑊̇𝑘𝑜𝑚𝑝.𝑄̇𝐿 (6)
2.2. Uncertainty of the measurements and data
For a calculated dependent value R, independent variablesx1, x2, … xnand uncertainty values w1, w2, … wn
,
uncertainty of each independent variable has an effect on the accumulated uncertainty. Therefore, multiplication of partial derivatives of R according to each independent variable with uncertainties of each independent variable can be summed in order to calculate total uncertainty. This approach can be expressed mathematically as in (7).
1 2 2 2 2 1 2 1 2 R n n R R R w w w w x x x (7) The calculated uncertainties for each compressor speed are given in Table 1.
Table 1. Uncertainties for each compressor speed Rev/min Wc (%) (%) QL (%) QH COP(%) H COP(%) C 500 3.812 1.524 1.176 0.484 0.391 600 3.734 1.543 1.176 0.457 0.359 700 3.813 1.530 1.174 0.472 0.389 800 3.732 1.529 1.167 0.449 0.375 900 3.651 1.515 1.153 0.425 0.355 1000 3.578 1.527 1.153 0.408 0.345 1100 3.503 1.523 1.143 0.385 0.335 1200 3.573 1.518 1.141 0.389 0.343 1300 3.574 1.517 1.140 0.387 0.343 1400 3.432 1.527 1.133 0.354 0.309 1500 3.368 1.528 1.130 0.344 0.300 1600 3.433 1.529 1.136 0.358 0.309
Although the uncertainty values are given here, the comparative evaluation of the temperature results and performance values of the air conditioner system do not necessarily need uncertainty values of the results because uncertainty values are important where the quantitative values are directly needed. For instance, if a heat exchanger dimensions would be determined according to experimental results, then uncertainty plays a significant role in order to be sure that the dimensions consider and cover the uncertain amount. However a comparative evaluation considers the trends most of the time. Nevertheless, Table 1 can give an idea about the experimental setup.
3
Results
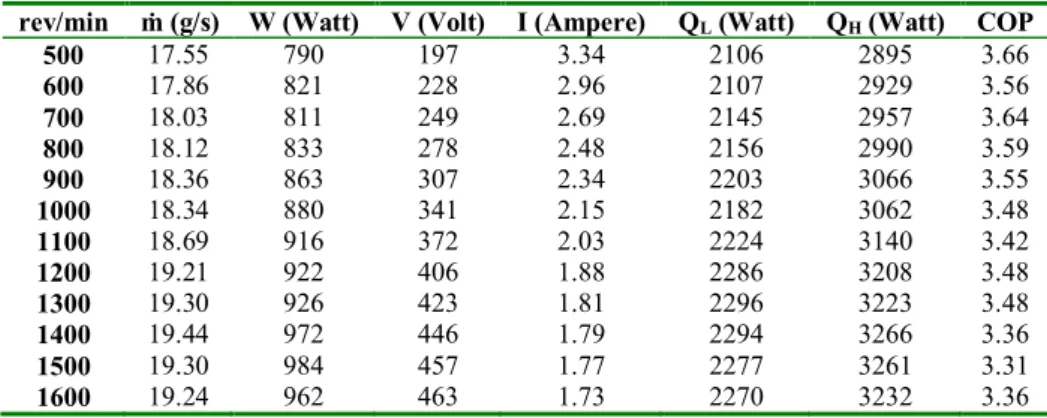
Air conditioner performance indicators are given in tabular form for heating and cooling respectively in Table 2 and Table 3. For the examined air conditioner, revolutions between 500-700 seem proper for maximum COP. About 3 kW heating and 2 kW cooling can be done by using this air conditioner system. However it should not be forgotten that the seat coils are a parallel addition to the original evaporator/condenser heat exchanger. So these capacities are total capacities, not just the heat transferred from the seat surfaces. Otherwise the passenger would be burned or freeze at the contact surfaces. To assess the heating and cooling at the seat surfaces, temperature graphics are provided in the following part.
It is seen that mass flow rate increases only about 9-17% while the compressor speed is three folds. The mechanical work is therefore increases very similar to the mass flow rate but with a higher manner; about 21-27%. The increases are higher for cooling process. Evaluating all this together, and given that electrical power is consumed by mass flow rate times the unit compressing work which is a product of pressure and specific volume; the higher portion of the energy is spent to increase the pressure. Since the installation is designed for an operational pressure there should be a bypass to protect the system from high pressure (a mechanism or plain geometrical tolerances). So, three fold compressor speed doesn’t change the system performance at the same ratio. Although the increasing compressor speed increases the transferred heat, the spent power increases more due to the inreversibilities and the aforementioned bypass, and COP values decreases with increasing compressor speed.
The electrical power that is consumed during the tests directly effects the COP values since this power was used in calculation of the COP. Again, results are evaluated comparatively not quantitatively, so this approach does not lead to a misinterpretation in trends. Two significant reasons can come into mind to explain the difference between COP values of heating and cooling. First one is ambient temperature and the second one is the modified heat exchanger in the cabin side which has extended towards the seat. But before, assuming that the temperature differences same, it is already known that the cooling mode of an air conditioner has less COP value than the heating mode. In
ideal side, for instance a Carnot machine, Carnot refrigerator has 1 unit lower COP than the Carnot heat pump for same higher and lower temperatures. In the present work, the difference in COPs are about 0.2. The uncertain COP amount is about 0.05. Considering the seasonal differences and changes in the ambient air, it can be said that effects of the heat exchanger modifications on the COP values cannot be justified and revealed with these results.
The mass flow rate changes between 17.55 g/s and 19.24 g/s for heating process when the compressor speed changes between 500 rev/min and 1600 rev/min. The power consumed by the electrical motor increases from 790 W to about 970 W due to the increased compressor speed. To arrange the revolution of the electrical motor, inverter raises the voltage. The voltage increase also compensates the decrease in ampere since the ampere values decreases with increasing compressor speed. This may be due to the increasing phase changing frequency which shortens the time for the electrical current to flow. Dissipated heat for the heating process changes between 2895 W and 3232 W while heat drawn from the environment changes between 2016 W and 2277 W. Approximately 3.5 folds of the electrical power is pumped as heat with this system. The heat portion of the seat coils in this pumped heat amount couldn’t be calculated because only temperature was measured and mass flow rate, pressure and surface area for that circuit are unknown. Nevertheless, temperature values in the following part are evaluated for heating process, therefore it can be said that this evaluation reduces the absence of the knowledge about the heat portion of the seat. For cooling process, the change intervals are; 15.39 g/s and 18.92 g/s for mass flow rate, 585 W and 795 W for power, 169 V and 415 V for voltage, 2.86 A and 1.48 A for the electrical current, 2031 W and 2421 W for cooling power, 2616 W and 3216 W for heat dissipation.
The temperature measurements from the seat surfaces for heating and cooling processes at the highest COP values are given in Figure 6. This figure is prepared in order to show the temperatures versus time at different temperature measurement locations.
According to Figure 6, it is seen that point 5 temperature measurement had lower temperatures before the live manikin sat on the cushion comparing to the other four points. The difference is about 5 oC. Point 2
and 3 had the highest temperatures prior to the manikin. Point 4 and 1 are close but lower than 2 and 3. Although it is known that the manikin sits after 300 seconds have passed from the initiation of the data collection, manikin can also be detected in the graphic by the instant change of the trends. When the manikin sits on the cushion, there is an intensive heat transfer from cushion to the manikin and the surface temperature drops. This happens in seconds. Then the manikin plays a role similar to a heat insulation and surface temperature increases to a maximum. It can be said that the system couldn’t reach the steady state completely at this specific case. It is also seen that the temperature difference of the temperature measurements decreases when the manikin sits on the cushion. By taking this into consideration and also considering the instant changes in temperature when
manikin sits and stands up, it can be concluded that the weight of the manikin blocks the coils, so the main temperature rise of the surface is due to the insulation
and heat generation of the manikin. The remaining 5 minutes justifies this.
Table 2. Air conditioner indicator values for heating process
rev/min ṁ (g/s) W (Watt) V (Volt) I (Ampere) QL (Watt) QH (Watt) COP
500 17.55 790 197 3.34 2106 2895 3.66 600 17.86 821 228 2.96 2107 2929 3.56 700 18.03 811 249 2.69 2145 2957 3.64 800 18.12 833 278 2.48 2156 2990 3.59 900 18.36 863 307 2.34 2203 3066 3.55 1000 18.34 880 341 2.15 2182 3062 3.48 1100 18.69 916 372 2.03 2224 3140 3.42 1200 19.21 922 406 1.88 2286 3208 3.48 1300 19.30 926 423 1.81 2296 3223 3.48 1400 19.44 972 446 1.79 2294 3266 3.36 1500 19.30 984 457 1.77 2277 3261 3.31 1600 19.24 962 463 1.73 2270 3232 3.36
Table 3. Air conditioner indicator values for cooling process
rev/min ṁ (g/s) W (Watt) V (Volt) I (Ampere) QL (Watt) QH (Watt) COP
500 15.39 585 169 2.86 2031 2616 3.47 600 16.17 603 199 2.51 2150 2750 3.56 700 16.69 667 227 2.42 2136 2804 3.20 800 17.27 673 255 2.19 2193 2867 3.26 900 18.16 708 282 2.11 2324 3032 3.28 1000 18.10 724 306 1.97 2298 3022 3.17 1100 18.44 774 341 1.89 2323 3098 3.00 1200 18.63 782 371 1.76 2347 3130 3.00 1300 18.79 795 397 1.66 2386 3175 2.99 1400 18.92 794 409 1.61 2421 3216 3.05 1500 18.39 775 413 1.56 2354 3126 3.03 1600 18.05 741 415 1.48 2310 3050 3.10
(a) 500 rev/min heating cushion temperatures (COP=3.66) (c) 600 rev/min cooling cushion temperatures (COP=4.56)
(b) 500 rev/min heating back temperatures (COP=3.66) (d) 600 rev/min cooling back temperatures (COP=4.56) Fig. 6. Point temperature measurements of the seat for heating and cooling at the highest COP values
It is seen that back temperatures for heating process yields a more uniform temperature distribution among the temperature measurement points. The effect of the manikin is strong on the point 1 temperature measurement comparing to the other points. Back heating slowly works except the point 1. Again the manikin acts like an insulation and its load on the coils reduces the circulation through the coils. It can be justified from the point that the manikin stands up. When the coils are compressed due to the weight of the manikin, the refrigerator charge is higher for the rest of the system and thus condenser temperatures increases. So, when manikin stands up, back surface increases suddenly and then starts to drop. Using seat coils as a condenser seems problematic due to the compression by the weight of the manikin. Since condenser is in the high pressure side of the system and refrigerant changing state to an incompressible form, narrower channels negatively and highly affect the operation and the aim. This evaluation can be justified by examining the cooling process temperature results. In the cooling process, temperature measurements again jumps with the manikin but the temperature readings are almost flat for five minutes which indicates that cooling works and maintains the surface temperature. The cushion part in cooling process starts with about 9 °C prior to the manikin. As the point five temperature measurement exhibits a relatively ineffective operation in heating process, it also has 5 °C high temperature value prior to the manikin comparing to the remaining temperature measurement points. That part of the cushion either has less coil surface or the coil part has less refrigerant charge due to the distribution. When live manikin sits on the cushion, surface temperatures increase about 10 oC and remain almost same till five minutes pass. This can only be achieved by a heat transfer from the manikin towards the coils since the manikin generates heat. Therefore it can be concluded that the gaseous form refrigerant can pass through the coils and realize a cooling effect better than the heating process where refrigerant should condense and exit the coils in liquid form. The pressure due to the weight of the manikin may lead to the early condensation of the refrigerant in heating process and compressed channels puts a high resistance for the liquid flow making most of the refrigerant follow the other path to the internal heat exchanger. On the other hand, since cooling can be observed in the figure, compression due to the manikin weight cannot avoid evaporation and flow in the cushion coils. In the interval between the instant that the manikin stands and the test is finished, the surface temperatures of the cushion part are barely reaches their temperature values prior to the manikin. While this shows a very weak (not powerful) cooling is at stake, it can aid avoiding instant surface temperature changes for passengers which can otherwise be found inappropriate in the absence of a machine controller. Point 2, 3 and 4 are the highest temperature measurements in the cushion part from the manikin, so it is thought that they are located in the central part of the cushion. Point one and point five temperature measurements are rather at the sides. The first distribution should be done to the coil
close to the point 1 temperature measurement. It is also interesting to see that cooling temperature measurements are more stable than the heating process. This is seen as evidence to the flow problem in heating process. The back temperatures for cooling process have higher temperatures prior to the manikin comparing to the cushion temperatures. The vertical positions of the coil may reduce the refrigerant charge to the back coils. Although coils near to the point 4 and five has temperatures about 5 °C prior to the manikin, the rest was changing between 13-15 °C. It is thought that coils near point 4 and 5 temperature measurements are about the end of the distributer, so refrigerant coming from other coils before these ones has the chance to evaporate better. The manikin increases the back temperatures about 7 °C and the surface temperatures rise for about 2 °C during the sitting of the live manikin. This means a poorer cooling comparing to the cushion part of the seat for the back part. In the back part, point 2, 3 and 4 are the most effected temperature measurements from the manikin suggesting that these are also at the central part of the back surface and the remaining temperature measurements (point 1 and 5) are located at the sides. Similar to the cushion part, temperatures of the back part also return to the initial values after the manikin stands but with a temperature deviation about 1 °C. Since it is known that the ambient air is hotter than the seat surfaces in the cooling process, it is ensured that there is cooling by the coils.
Figure 7 is given in order to show how back and cushion average temperatures change versus time and compressor speeds for heating and cooling processes. For back temperatures in heating process, prior to the manikin, higher compressor speeds seems more favourable in heating and can resist to the ambient temperature as they exhibited a flat change or increase slightly. By saying higher compressor speeds, 1000 rev/min can be regarded as the limit. The rise of the average temperature of the surface after the manikin sits, are about the same, about 2 oC which indicates that the
rise in the temperature is due to the thermal insulation because of the manikin. The compressor speeds 1000 rev/min and higher heat the back surfaces and resist to the ambient temperature after the manikin stands. Temperature fluctuations along the time can be observed in back temperatures however cushion temperatures revealed a more stable temperature read indicating that there are flow disturbances in the coils of back part of the seat in heating process. The cushion part temperatures show that heating is less effective comparing to the back part though the compressor speed increases the temperature, concluding from the test period prior to the manikin. The live manikin increases the temperature about 2-4 oC on the cushion surfaces and
temperature continues to rise for 2 oC as the manikin
continues to sit on the cushion. When manikin stands, there is an instant temperature increase for a short time indicating that a surge of the refrigerant occurs. Then temperature starts to decrease to a point close to its initial value.
(a) Heating process back temperatures (c) Cooling process back temperatures
(b) Heating process cushion temperatures (d) Cooling process cushion temperatures Fig. 7. Average cushion and back temperatures changing with time and compressor speeds for heating and cooling processes
For the cooling process in the back part of the seat, there is a real temperature difference between lower and higher compressor speeds if the 900 rev/min compressor speed is taken as the limit. The difference is about 6 oC. By the effect of the manikin, an additional 6 oC increase is realized approximately for all compressor speeds. The back surface temperatures slightly increase while manikin is sitting; about 2 oC. 5 minutes seems insufficient for surface temperatures to return their initial temperature at the back part. Cushion part for the cooling process seems more effective. The initial temperatures are lower comparing to the back part. Cooling continues as the manikin sits on the cushion and the temperatures decrease around 1 oC. After manikin stands, the cushion temperatures manage to reach their initial values and the difference between compressor speeds become very small. The two groups of compressor speeds are visible at this period. Again 900 rev/min can be regarded as a limit in growing compressor speeds.
The drawings from these results and additional evaluations according to the literature survey are given in the conclusion section.
4 Conclusion
Thermal comfort management of passengers in vehicles is rather a complex topic since thermal comfort is a subjective concept. The common systems for thermal comfort management in vehicles are highly depending on passenger itself. Air conditioners and electrical resistances are commonly used. Air is the fluid to
regulate the thermal management and due to its intrinsic properties such as turbulence and compressibility, topic is open for engineering studies.
This work first surveys the field and then focuses on the management of seat surface temperatures by heat exchanger coils extended from an air conditioner unit. The feasibility of the application in terms of surface temperatures and air conditioner operation is investigated.
In the following, the main drawings from the results are listed. Then some remarks and propositions on the subject are given for future studies in general topic.
Conclusions about the results are:
The weight of the passenger compresses the coils embedded into the seat surfaces and the diameter of the coils decrease causing flow problems; especially in heating process. This
flow disturbances cause temperature
fluctuations. Liquid flow blocked more due to this compression.
When the coil dimension and size are insufficient for adequate condensation or evaporation, the parallel coils contacting a single distributor and collector act like coils in serial connection. In other words, heating and cooling changes from coil to coil and temperature distribution changes in the surface from first coil to the last coil. In a working parallel configuration, it would yield a similar temperature distribution alongside the coils.
Compressor speeds above 900 rev/min have better performance in cooling process in terms
of surface temperatures. For heating,
compressor speeds above 1000 rev/min resulted better heating surface temperatures. These are thought to be due to the line pressure in the distributor by the increased compressor speeds. Cooling process performed better than the heating process with same tools in respect of the seat surface temperatures although the air conditioner performance values show a different picture. This is thought to be due to the better flow of the gaseous refrigerant during the evaporation. In heating, high pressures leads condensation prior to coils and liquid form refrigerant cannot pass through the coils. The air conditioner performance indicators such
as COP can be misleading for the seat application. The COP values decrease as the compressor speed increases. However, the
applicable temperature distributions are
obtained by higher compressor speeds due to the needed pressure levels in seat coils. Since cooling observed more effectively at the seat comparing to the heating and cooling COP values are lower for cooling comparing to the heating, it can be said that working extended coils from the main heat exchanger lowers the efficiency of the air conditioner system due to additional pumping power requirement and low heat conducting materials of the flexible coils. An additional interface can be used between air
conditioner heat exchangers and the heat surfaces for conduction thermal management of the seat in order to overcome the compression problem of the coils. Metal heat conductors or any innovative material with flexible and elastic properties can be an alternative.
Some provisions about the topic are listed below: Machine learning and control methods can be
applied for vehicle cabin and seat thermal comfort management studies. Passenger linguistic statements, surface temperatures and humidity, and motion sensors can be used as input parameters. As decisions, compressor speed, expansion rate, valve controls and on/off controls can be taken.
For determining effects of operational parameters and equipment types, statistical tools as well as mathematical formulation can be used alongside of experiments. By this way, mathematical models and correlations can be
generated for aiding machine control
algorithms.
CO2 is a possible candidate for research due to
its properties against hazardous events.
Novel heat exchanger designs integrated to and embedded in the seat can be studied. Solid flexible and/or elastic rods, sheets, heat pipes,
nano-agent reinforced fabrics are some candidates.
A multidisciplinary wide survey including ergonomics, material and fabric sciences,
thermodynamics, statistics and artificial
intelligence can supply a comprehensive work towards an universal machine control.
Authors would like to acknowledge the financial support of Selcuk University Scientific Projects Coordinatorship (S.U. BAP) with 11401028 and 18701552 numbered project.
References
1. F.C. Babalik, T.G. Cengiz, Muhendis ve Makina 45, 539, 22-32 (2004) (in Turkish)
2. A. Ates, K. Dincer, E. Canli, S. Ata, APJES 5, 3, pp. 82-94, (2017)
3. T. Ohnaka, S. Hodder, K. Parsons, Environmental Ergonomics, pp. 305-311 (2005)
4. H. Oi, K. Tabata, Y. Naka, A. Takeda, Y. Tochihara, Applied Ergonomics, 43 (2012)
5. Q. Deng, R. Wang, Y. Li, Y. Miao, J. Zhao, Science of the Total Environment, 578 (2017)
6. A. Alahmer, M. Omar, A.R. Mayyas, A. Qattawi, Building and Environment, 48 (2012)
7. H.K. Park, S.M. Kim, J.S. Lee, J.-H. Park, Y.-K. Hong, C.H. Hong, K.K. Kim, Synthetic Metals, 203 (2015)
8. Z. Zhang, J. Wang, X. Feng, L. Chang, Y. Chen, X. Wang, Renewable and Sustainable Energy Reviews,
91 (2018)
9. C. Chan, K. Chau, Ind Electron IEEE Trans, 44 (1997)
10. A. Elarusi, A. Attar, H. Lee, Journal of Electronic Materials, 46, 4 (2017)
11. J. Fairbanks, 10th Diesel Engine Emissions Reduction Conference San Diego, California (2004) 12. S. Feher, SAE Technical Papers Series, 931111
(1993)
13. S. Feher, SAE Technical Papers Series, 9806661 (1998)
14. T. Hendricks, SAE Technical Paper, 2002-01-1970 (2002)
15. N. Wolfe, X. Mu, L. Huang, P. Kadle, SAE Technical Paper, 2007-01-1193 (2007)