1School of Health and Environmental Studies, Hamdan Bin Mohammad Smart University, Dubai, United Arab Emirates (Correspondence to S. Hamidi: [email protected]). 2Department of Health Management, İstanbul Medipol University, Istanbul, Turkey 3Department of Health Care Administration, The William G. McGowan School of Business, King’s College, Wilkes-Barre, Pennsylvania, United States of America.
4Department of Restorative Dentistry, Faculty of Dentistry, Zirve University, Gaziantep, Turkey.
Received: 05/02/15; accepted: 11/10/15
Examining health care spending trends over a
decade: the Palestinian case
S. Hamidi,1 H.Ö. Narcı,2 F.Akinci 3 and O. Nacakgedigi 4
ABSTRACT An analysis was made of recent health care spending patterns in the occupied Palestinian territory, in order to inform future health policy-making and planning. Data were obtained from the national health accounts for the period 2000–2011. The current level of resource allocation to the health care sector is higher than in many developed countries and is not sustainable. The private sector represents the largest source of health financing (61%) and the burden falls disproportionally on individual households, who account for 63% of private health care expenditure. Key recommendations include: building capacity in the government sector to reduce the outsourcing of health services; modifying inequitable financing mechanisms to reduce the burden on households; and allocating more resources for health promotion and disease prevention programmes. Reorientation of the health system is also needed in terms of reducing the share of spending on inpatient services in favour of more day surgery, outpatient and home-based services.
ةينيطسلفلا ةلالحا :تاونس شرع ىدم لىع ةيحصلا ةياعرلا لىع قافنلإا تاهاتجا ةسارد
يجيجاكان رونأ ،يزنكا يزوف ،سيران ينجسوأ رجاه ،ةدياحم رماس تاــسايسلا عاــنص ماــعإ ةــَيْغُب ةــلتحلما ةينيطــسلفلا ضيارلأا في ةــيحصلا ةــياعرلا ىــع قاــفنلإا طاــنأ ثدــحلأ لــيلتح يرــجأ دــقل :ةــصلالخا نأ دــجو ثــيح .2011-2000 ةرــفلل ةــينطولا ةــيحصلا تاباــسلحا نــم تاــنايبلا ىــع لوــصلحا مــتو .لبقتــسلما في اــله طــيطختلاو ةــيحصلا عاــطقلا لــثميو .ةمادتــسم رــغو ةــمدقتلما نادــلبلا نــم رــثك في هــيلع وــه اــمم ىــعأ ةــيحصلا ةــياعرلا عاــطقل ةــصصخلما دراوــملل لياــلحا ىوتــسلما % 63 يــطغت )سرلأا( يــتلاو ،بــسانتم رــغ وــحن ىــع يدرــف لكــشب سرلأا ىــع ءبــعلا عــقيو ،)% 61( يــحصلا لــيومتلل ردــصم رــكأ صاــلخا رداــصمب ةناعتــسلاا نــم دــحلل يــموكلحا عاــطقلا في رداوــك ءاــنب :لمــشت ةيــسيئرلا تاــيصوتلا نإ .ةــصالخا ةــيحصلا ةــياعرلا ىــع قاــفنلإا نــم دراوــلما نــم دــيزلما صــيصتخو ،سرلأا نــع ءبــعلا فــيفختل ةــفصنلما رــغ لــيومتلا تاــيلآ لــيدعتو ،ةــيحصلا تاــمدلخا لاــمج في ةــيجراخ ىــع قاــفنلإا ةــصح لــيلقت ةــيحان نــم يــحصلا ماــظنلا هــيجوت ةداــعإ لىإ ةــجاح كاــنه نأ اــك .ضارــملأا نــم ةــياقولاو ةــحصلا زــيزعت جــمارل .ةــيلزنلما تاــمدلخاو ينــيجرالخا ضىرــلما تاــمدخو دــحاولا موــيلا ةــحارج تاــمدخ نــم دــيزلما حــلاصل ينــيلخادلا ضىرــلما ةــياعر تاــمدخExamen des tendances en matière de dépenses de soins de santé au cours des dix dernières années : le cas palestinien
RÉSUMÉ Une analyse a été faite des tendances récentes des dépenses en soins de santé dans le territoire palestinien occupé afin de guider l'élaboration des politiques et la programmation en matière de santé. Les données ont été obtenues à partir des comptes nationaux de la santé pour la période allant de 2000 à 2011. Le niveau actuel d’allocation de ressources au secteur de soins de santé est supérieur à celui de nombreux pays développés et ne s'inscrit pas dans la durée. Le secteur privé représente la source la plus importante de financement de la santé (61 %) et la charge pèse de manière disproportionnée sur les ménages individuels qui participent à hauteur de 63 % aux dépenses de soins de santé privées. Les recommandations clés sont les suivantes : renforcer les capacités du secteur public afin de réduire l’externalisation des services de santé ; modifier les mécanismes de financement inéquitables pour réduire la charge pesant sur les ménages ; et allouer davantage de ressources aux programmes de prévention des maladies et de promotion de la santé. Il est aussi nécessaire de réorienter les dépenses du système de santé pour réduire la part allouée aux services d'hospitalisation et augmenter celle de la chirurgie ambulatoire, des consultations externes et des soins à domicile.
Introduction
The occupied Palestinian terri-tory (OPT) consists of 2 geographically separated areas, West Bank and Gaza Strip, administered by the Palestinian National Authority across 16 governo-rates. Covering an area of about 6860 km2 (6500 km2 in West Bank and 360 km2 in Gaza Strip), the OPT comprises a very densely populated country, with more than 650 inhabitants per square kilometre. The total population of the OPT in 2013 was about 4 485 459 (50.8% male and 49.2% female), with 41% of inhabitants under 15 years of age (1).
The life expectancy at birth in the OPT was reported to be 72.6 years in 2013, having increased by 10.4 years between 1980 and 2013 (2). Gross
national income per capita increased during the same period by about 45% to reach US$ 5168 purchasing power par-ity, although it did not increase mono-tonically over this period (2). The crude
death rate decreased from 4.1 in 1993 to 2.5 per 1000 people in 2013 and the infant mortality rate also fell from 32 to 18.8 per 1000 live births between 1993 and 2013 (2).
When compared with neighbouring countries such as Jordan and Egypt, the OPT shows good results in terms of health workforce indicators. However, the indicators lie well below average of the Organisation for Economic Co-operation and Development (OECD) countries. Over the past 2 decades the number of physicians per capita in the OPT increased substantially to reach 24 per 10 000 people, compared with 26 in Jordan and 28 in Egypt, but it remains well below the OECD average of 32 per 10 000 people. There were about 25 nurses per 10 000 people in 2013, much less than the average of 87 in the OECD countries, and even below the average 40 in Jordan and 35 per 10 000 in Egypt. The total bed capacity in the OPT was 5619 beds in 2013, which can be translated into 13 beds per 10 000
people, well below the OECD average of 48, and below the average of 18 in Jor-dan and 17 per 10 000 people in Egypt.
The Palestinian Ministry of Health (MoH) is the main entity responsible for governing, regulating and delivering health care services in the OPT. Four major providers share the responsibil-ity of health care provision: the MoH, the United Nations Relief and Works Agency for Palestine Refugees in the Near East (UNRWA), various nongov-ernment organizations and the private sector. Primary health care centres throughout the Palestinian governo-rates have expanded from 454 centres in 1994 to 750 in 2012, a 65.2% increase. The MoH is the main primary health care provider, operating 61.3% of the total primary care centres (3).
Second-ary and tertiSecond-ary care is provided mainly in the MoH and private sector.
For effective health policy develop-ment and planning, it is critically impor-tant to analyse the current health care spending and utilization patterns and the key determinants of these patterns. Unfortunately, there are very few pub-lished studies analysing and describing the patterns of spending and utilization of health services in the OPT. Further increases in government spending on health occurred after 2006, in line with the vision of the MoH to promote the health of Palestinians and to aid the poorest members of the population (4). Between 2000 and 2006, MoH
allocations represented between 8% and 11% of total public funds (5). In
2013, the budget of the MoH (US$ 531 million) accounted for about 13% of the overall government budget (US$ 3900 million). The expansion of public sector expenditure on contracted specialty care services, and on health workforce and pharmaceuticals, contributed signif-icantly to the overall rise in government sector health spending (6). Despite the
adoption of several measures to ration-alize operational health expenditure, spending reached 15% above the year-end budget target (7).
The MoH budget for 2008 was US$ 322 million. According to the Health sector review report 2007, almost half of
public funds (49%) were directed to hospitals compared with only 29% for primary health care (8). A study
con-ducted by Younis et al. in 2008 found that government hospitals spent about 37% of their budget on salaries, 27% on drugs, 27% on overheads and 8% on other expenses. About 75% of the hospital expenditure was on inpatient care and 25% on outpatient care. The average costs of outpatient visits and inpatient days were US$ 13.0 and US$ 90.0 respectively (4). In another
study conducted at Rafidya govern-ment hospital, Younis et al. found that the major component of the total costs was workforce salaries, at an average of 54%, followed by drugs 17%, operating costs 10%, capital costs 9% and other expenses 10% (9).
Given the limitations of the stud-ies summarized above, and in order to inform future health policy-making and planning, the main purpose of this study was to analyse health care spend-ing patterns in the OPT over the pe-riod 2000–11. Specifically, we aimed to analyse the following: total health care expenditure by source of finance, by function and by provider; government spending by function and by provider; private spending by function and by provider; private out-of-pocket spend-ing by function and by provider; and non-profit institutions serving house-holds expenditure by function and by provider.
Methods
Data sourceThe data utilized in the study were published jointly by the MoH and Pal-estinian Central Bureau of Statistics in the Palestinian national health accounts from 2000 to 2011. National health accounts are a powerful health policy tool that describe how much a country
spends on health, and map out in detail the sources and uses of health care ex-penditure (10). The method is designed
to give a comprehensive description of resource flows in a health system, showing where resources come from and how they are used. National health accounts help both health and social planners to identify health policy issues, develop policy interventions and moni-tor the impact of interventions.
We analysed the total average health care spending in the OPT over the pe-riod 2000–11, and the annual trends, by source of funding, by type of health care function and by type of health care provider. Among funding sources we focused on private household out-of-pocket payments.
The Palestinian Central Bureau of Statistics adopts a number of measures to ensure data quality and coverage. However, despite these measures, some problems and challenges remained in the development of coverage and the comprehensiveness of the data. This was primarily because health expendi-ture covered by the OPT excluded those parts of Jerusalem which were occupied in 1967 and the Gaza Strip, due to the lack of detailed data from its sources.
Definition of key study constructs
To address the research objectives of the study, all constructs used includ-ing sources of finance, functions and providers were defined in accordance with the definitions of the Palestinian Central Bureau of Statistics (11). The
Bureau has adopted the System of health accounts 2000 developed by the OECD
(12).
Total health expenditure
Total health expenditure measures the value of outlays for the final consump-tion of health care goods and services and for the production of certain ac-tivities defined as health acac-tivities. It is broken down into 2 entities. The first
is the current expenditure incurred for health care goods and services, such as inpatient curative care; medical goods dispensed to outpatients and admin-istration; and insurance. The second is gross capital formation in health care industries. Expenditures for gross capi-tal formation are those that add to the stock of resources of the health care system and last more than an annual accounting period. Capital formation in terms of up-to-date equipment and the availability of essential supplies bolster the quality of care provided by health facilities, improve results in diagnostic and treatment services and contribute to the long-term sustainability of service provision (12). In the case of the OPT,
total health expenditure includes gross capital formation in health care indus-tries, but only at an aggregated amount, thus missing data on gross capital for-mation by funding sources. Therefore, the study was able to use total health expenditure data composed of current health expenditure in all the analyses (13–15).
Funding source
There are 3 main sources of finance for the health system of the OPT: public; private; and the rest of the world.
The government acts as the main public financing source. It comprises all institutional units of central and local government including the MoH and Military Health Services via the Minis-try of Finance. Non-profit institutions that are controlled and mainly financed by government units are also included.
Private sources include private insur-ance enterprises, private household out-of-pocket expenditure and non-profit institutions serving households, none of which belong to the government sector. Private insurance enterprises comprise all private insurance companies. Private household out-of-pocket is the direct payments (formal and informal) of households to health care providers, whose primary intent is to contribute to the restoration or to the enhancement
of the health status of individuals or population groups. Out-of-pocket expenditure exclude payments made by enterprises which deliver medical and paramedical benefits, mandated by law or not, to their employees. Non-profit institutions serving households comprise non-profit institutions which provide goods or services to households free or at prices that are not economi-cally significant.
The “rest of the world” category rep-resents the list of projects that support the health sector as registered in the Ministry of Planning. These projects cover primary and secondary health care activities from a variety of donors. The projects also fund special vertical programmes, such as the tuberculosis programme and maternal and child health, and capital infrastructure estab-lishments.
Function
The functional categories used in this study comprised only health care func-tions and, due to lack of data, excluded health-related functions such as capital formation, environmental health, and research and development in health.
The health care functions analysed here included: inpatient curative care; outpatient curative care; medical goods dispensed to outpatients; prevention and public health services; and other. The “other” category included services of rehabilitative care; inpatient long-term nursing care; ancillary services to health care; and prevention and public health services.
Provider type
Hospitals were classified according to type: general hospitals; mental health and substance abuse hospitals; and specialized hospitals.
Statistical analysis
The data were analysed using Stata,
ver-sion 12, and Microsoft Excel. Descriptive
statistics were used to show the health care spending trends during the study period. To examine the relationship
between current health expenditure per capita and GDP per capita, a regression analysis was performed using the natural log of current health expenditure as the dependent variable over the study years and the natural log of GDP as the inde-pendent variable. Bar charts were used to present the data broken down into: current health expenditure per capita, current health expenditure by fund-ing source, current health expenditure by health care provider, current health expenditure by health care function, and private health expenditure.
Results
Trends in current health expenditure as a share of GDP
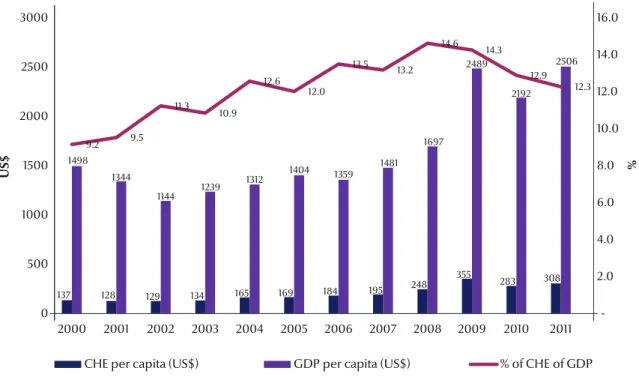
Figure 1 presents the current health expenditure and its share of the GDP across the study years. Current health expenditure in the OPT increased from US$ 384 million in 2000 to US$ 1201 million in 2011. Current health expenditure per capita grew from US$ 137 in 2000 to US$ 308 in
2011, a 125% increase, while GDP per capita increased from US$ 1498 to US$ 2506 over the same period, a 67% increase. Although GDP per capita decreased from 2000 to 2002, it increased on a regular basis after 2002 until 2010. Current health expenditure per capita decreased from 2000 until 2003, and then increased from the year 2003 onwards. However, the total health expenditure as a percentage of GDP, at current prices, increased from about 9% in 2000, to peak at nearly 15% in 2008, and then decreased to 12% in 2011.
The results of regression analysis (F = 43, P = 0.0001, adjusted R2 = 80%)
showed that there was a strong positive relationship between GDP per capita and current health expenditure per capita (Figure 2). If GDP increased by 1.2%, current health expenditure would increase by 1%. In other words, if the OPT faced serious financial sustainability problems, then health care utilization would be highly likely to suffer.
Trends in total health expenditure
Analysis by financing source
Over the period 2000–11, the govern-ment sector contributed on average about 36% of health funding, private households out-of-pocket expenditure contributed 39%, and non-profit in-stitutions serving households, includ-ing UNRWA, contributed on average about 22% of the total health expendi-ture. Direct contributions by the rest of the world to funding health services during the same period averaged about 3%, as shown in Figure 3.
Government expenditure consti-tuted about 36% of total per capita ex-penditure with a range of 31% to 41%. Government expenditure per capita in-creased by 142% from US$ 45 in 2000 to US$ 109 in 2011. Health expenditure on outsourcing health services outside MoH also increased from US$ 60 in 2005 to US$ 132 million in 2011, and to US$ 147 million is 2013. In 2013, about 26% of the MoH budget was spent on health services outsourced from other providers. About 50% of this amount
Figure 1 Current health expenditure (CHE) by funding source in the occupied Palestinian territory over the years 2000–2011 (GDP = gross domestic product)
137 128 129 134 165 169 184 195 248 355 283 308 1498 1344 1144 1239 1312 1404 1359 1481 1697 2489 2192 2506 9.2 9.5 11.3 10.9 12.6 12.0 13.5 13.2 14.6 14.3 12.9 12.3 2.0 4.0 6.0 8.0 10.0 12.0 14.0 16.0 0 500 1000 1500 2000 2500 3000 2000 2001 2002 2003 2004 2005 2006 2007 2008 2009 2010 2011
CHE per capita (US$) GDP per capita (US$) % of CHE of GDP
U
was spent on 4 main services including oncology, haematology, neurosurgery and cardiac catheterization.
Analysis by function
As shown in Figure 4, the analysis of current health expenditure for the dif-ferent health care functions showed that on average 25%, 37%, 18% and 21%
was spent on inpatient curative care, outpatient curative care, medical goods dispensed to outpatients and other services respectively. Health expendi-ture for prevention and public health services (covered in the “other” cat-egory) ranged between 6% and 12% of current health expenditure. The level of spending on medical goods dispensed
to outpatients (about 18% of the cur-rent health expenditure) may indicate insufficient availability of medicines in the government sector.
Analysis by provider
The breakdown of current health expenditure by types of provider showed that hospitals accounted for Figure 2 Relationship between current health expenditure (CHE) per capita and gross domestic product (GDP) per capita in the occupied Palestinian territory over the years 2000–2011
32.7 30.7 32.4 36.7 40.1 38.4 35.5 35.5 36.7 36.1 36.3 35.3 65.5 67.6 62.2 61.7 58.9 58.0 58.4 61.5 61.1 60.9 61.6 63.6 1.8 1.7 5.4 1.6 1.0 3.6 6.1 3.1 2.2 3.0 2.1 1.1 0 25 50 75 100 2000 2001 2002 2003 2004 2005 2006 2007 2008 2009 2010 2011 % o f C H E Year
Public sources Private sources Rest of the world
Figure 3 Current health expenditure (CHE) by funding source in the occupied Palestinian territory over the years 2000–2011
350 300 250 200 150 100 50 0
GDP per capita (US$)
CHE per capita in (US$)
1 1.2 1.4 1.6 1.8 2 2.2 2.4 2.6 1498,137 1344,1281144,129 1239,1341312,165 1404,169 1359,184 1481,195 1697,248 1816,259 2192,283 2506,308 CHE Predicted CHE
about 36% of current health expendi-ture (Figure 5). Providers of ambulatory care recorded a rise in primary health care services between 2000 and 2011, including outpatient activities and independent outpatient clinics of hos-pitals. The value of health expenditure
for this category accounted for 28% of current health expenditure. Retail sales and other providers of medical goods accounted for 17% of current health expenditure. Total expenditure by pro-viders on nursing and residential care facilities in all sectors in the OPT was
equivalent to about 3% of current health expenditure. Expenditure on general health administration and insurance companies accounted for 9% of cur-rent health expenditure, and “other” accounted for 11% of current health expenditure (Figure 5). 20.8 19.5 19.1 30.1 28.2 27.2 23.4 26.1 32. 24.9 24.3 21.3 41.5 42.5 41.7 37.8 37.4 38.4 35.6 33.3 33.6 29.6 30.8 37.1 17.4 21.2 18.6 18.4 18.7 19.1 15.6 19.7 13.3 15.3 17. 15.9 20.3 16.8 20.6 13.7 15.7 15.3 25.4 20.9 21.1 30.2 27.9 25.7 0 25 50 75 100 2000 2001 2002 2003 2004 2005 2006 2007 2008 2009 2010 2011 % of C H E Year
Inpatient curative care Outpatient curative care Medical goods dispensed to outpatient Other Figure 4 Current health expenditure (CHE) by funding source in the occupied Palestinian territory over the years 2000–2011
40.0 35.1 35.7 36.5 37.2 34.1 40.7 31.5 33.0 36.0 34.5 35.1 31.1 31.9 29.0 30.3 29.4 30.0 24.9 28.3 25.0 22.1 23.2 28.6 17.0 20.8 17.4 18.1 18.1 16.9 14.3 18.8 12.7 14.5 16.2 15.6 5.2 6.3 5.1 4.7 5.5 5.4 6.0 8.6 12.1 15.0 15.0 13.2 6.7 5.9 12.8 10.4 9.8 13.6 14.1 12.8 17.2 12.4 11.1 7.5 0.0 25.0 50.0 75.0 100.0 2000 2001 2002 2003 2004 2005 2006 2007 2008 2009 2010 2011 % o f CH E Year Other
General health administration and insurance Retail sales and other providers of medical goods
Providers of ambulatory health care Hospitals
Figure 5 Current health expenditure (CHE) by health care provider in the occupied Palestinian territory over the years 2000–2011
Trends in government expenditure
Analysis by function
Analysis of government spending on dif-ferent types of health care revealed that, on average over the decade, inpatient curative care constituted 59% of ex-penditure, outpatient curative care 26%, prevention and public health services 14% and other types of care 1%.
Analysis by provider
Analysis by type of provider showed that hospitals accounted for 58% of government expenditure, public clin-ics outpatient care centres 17%, health administration and insurance 14% and other 12%. Over 40% of government payments to hospitals were made to general hospitals. Nearly all the pay-ments included in the “other” category were made to the rest of the world.
Trends in private expenditure
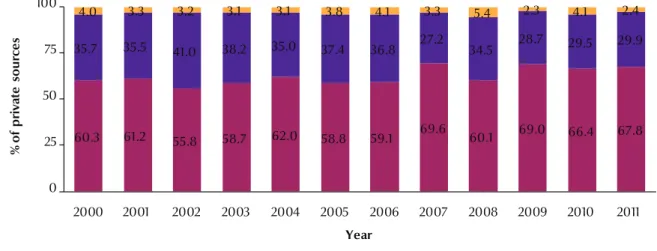
During 2000–11, the per capita private expenditure increased from US$ 90 to US$ 196 (117%). Given that private sources contributed disproportion-ately to the financing of the health care system—on average 61% of all health expenditure—further breakdown of private sources was made to analyse the extent of household contributions
(Figure 6). On average across 2000–11, household health expenditure reached 63% of all private sources, non-profit institutions serving households 34% and private insurance enterprises 4%. During the same period, expenditure per capita of private insurance enter-prises increased from US$ 3.5 to US$ 5 (29%), expenditure per capita of house-hold out-of-pocket increased from US$ 54 to US$ 133 (145%) and expenditure per capita of non-profit institutions in-creased from US$ 32 to US$ 59 (82%).
Trends in private households’ out-of-pocket expenditure
Households contributed on average 39% of current health expenditure in the period 2000–11, which, despite the large public health infrastructure in the OPT, comprised the largest source of financing. Household out-of-pocket expenditure per capita increased from US$ 54 in 2000 to US$ 133 in 2011, a 145% increase.
Analysis by function
The average out-of-pocket health ex-penditure analysed by health function was as follows: outpatient curative care 27%, non-classified services of curative care 17%, medical goods dispensed to outpatients 42% and other 14%. An
increase in the out-of-pocket expendi-ture covered in the “other” category was due largely to the inclusion of health administration and insurance costs starting from 2007. The out-of-pocket contribution for inpatient curative care accounted for less than 1%, except in 2007 when it was nearly 6%. Overall, the out-of-pocket expenditure for prevention and public health services accounted for about 1%.
Analysis by provider
On average, the out-of-pocket house-hold health expenditure on different types of providers were as follows: hospi-tals 18%, providers of ambulatory health care 31%, retail sales and other provid-ers of medical goods 42%, and other 9%. All the payments made to hospitals in all years were to general hospitals. At least 40% of the out-of-pocket spending made to ambulatory care providers was accounted for by for-profit private clin-ics outpatient care centres. The main reason for the rise of payments to pro-viders in the “other” category, especially after 2007, was the addition of health administration and insurance payments to the out-of-pocket expenses.
Figure 6 Breakdown of private health care expenditure in the occupied Palestinian territory over the years 2000–2011 60.3 61.2 55.8 58.7 62.0 58.8 59.1 69.6 60.1 69.0 66.4 67.8 35.7 35.5 41.0 38.2 35.0 37.4 36.8 27.2 34.5 28.7 29.5 29.9 4.0 3.3 3.2 3.1 3.1 3.8 4.1 3.3 5.4 2.3 4.1 2.4 0 25 50 75 100 2000 2001 2002 2003 2004 2005 2006 2007 2008 2009 2010 2011 % of pr iv at e so ur ce s Year
Private household out-of-pocket expenditure Non-profit institutions serving households Private insurance enterprises
Trends in private non-profit institutions serving households expenditure
Expenditure per capita of non-profit institutions increased from US$ 32 in 2000 to US$ 59 in 2011, an 82% increase.
Analysis by function
When analysed by health care func-tion, the expenditure on non-profit institutions serving households were as follows: inpatient curative care 12%, outpatient curative care 80%, and other 8%. The notable increase in expenditure in the “other” category during the years 2008–10 was due mainly to health ad-ministration and insurance payments.
Analysis by provider
On average, spending on non-profit institutions serving households to dif-ferent health care providers were as follows: hospitals 36%, nursing and residential care facilities 13%, outpa-tient care clinics provided by UNRWA 24%, outpatient care clinics provided by non-profit institutions serving house-holds 9% and other 18%. Almost all the payments to hospitals were made to general hospitals. Payments to offices of physicians rose notably, especially in the years 2006–08 when there was a major decrease in payments to outpatient care centres provided by non-profit institu-tions serving households.
Discussion
Our results show that households and government bear the heaviest burden of funding of health services in the OPT. This raises issues such as accessibility, inequity, health finance sustainability and allocative efficiency in terms of re-turn on investment in health and the opportunity cost of that investment, and the need to consider possible reallocation of resources to other sec-tors to maximize return. Several other significant findings from our study are discussed below.
High level of government spending on health services
Government health expenditure in-creased markedly from 2000 to 2011, which can be attributed to increasing salaries to finance unplanned and exces-sive health sector employment, cost of pharmaceuticals and outsourced health services. The total health expenditure as a percentage of GDP, at current prices, was about 12.3% in 2011. Total health expenditure per capita was US$ 308 in 2011 and the government’s contribu-tion to this was about 40%. Government expenditure per capita increased from US$ 45 in 2000 to US$ 109 in 2011, a 142% increase. This was despite the Palestinian fiscal crisis which affected the ability of MoH to secure supplies for its hospitals and clinics, resulting in severe shortages in essential medicines (16).
A recent assessment of the MoH showed that its salary budget had risen over 2000–05 from US$ 48 million in 2000 to US$ 83 million in 2005 (17).
Health expenditure on outsourcing health services increased 10-fold from 2000 to 2005 (US$ 6 million to US$ 60 million). A total of 30 000 cases were re-ferred outside of MoH facilities in 2005, costing over USUS$ 60 million, of which 40% were spent in neighbouring countries. The MoH specifically states “there are enormous hidden financial and social costs to the families of those referred abroad; costs that put some families in debt or are only affordable for the better off.” (18).
About 85% of this amount was spent on curative care and only 14% on pre-vention and public health services. Our results also showed that about a quar-ter of the MoH budget was spent on health services outsourced from other providers, and about half of the budget was spent on salaries. The expanding salaries expenditure will have reduced the funds available for operating costs, which is likely to have adversely affected health utilization, quality outcomes, al-locative efficiency and health finance
sustainability. Donors have financed the bulk of capital investments in the past decade, and hence government budget allocations to capital investment were minimal. The high degree of depend-ence on donor funding, which is includ-ed within the government budget, raises serious doubts about the sustainability of several key programmes.
Health services outsourced by the MoH constitute a significant part of the national health budget. Health ex-penditure on outsourced services have been on the rise (from US$ 60 in 2005 to US$ 147 million in 2013), reducing funds available for operating costs. The increasing level of outsourced services is not fiscally sustainable. Outsourced services referred abroad are also more complicated than local referrals, and thus more expensive than those pro-vided by Palestinian health care insti-tutions (19). The MoH has initiated
reform efforts to improve the equity and efficiency of the overall referral system. The referral process is currently central-ized under the authority of the General Directorate for Health Insurance, and is subjected to clear and stringent eligibil-ity criteria. The MoH would be advised to weigh the costs of this investment, and its ability to attract highly skilled health professionals, against the benefits of purchasing these services from out-side providers with existing capacity in the future. The MoH needs to provide well-developed health facilities and suf-ficient skill-mix of human resources. It should also develop its contracting capacity to better manage the health needs of the population.
Government hospitals consumed about 59% of the MoH budget, yet ap-pear to be inferior to private hospitals in terms of efficiency and quality. To enhance the ability of hospitals to tackle the financial sustainability issue, there must be a division between finance and provision. Transformation of the current government health insurance scheme into a separate agency which controls its own financial resources
could encourage competition among government and private providers and improve quality and efficiency.
High level of spending on curative care and hospital services
Over the period 2000–11, the OPT spent on average about 61% of total current health expenditure on cura-tive inpatient and outpatient care. This percentage was even higher in the government sector, at about 85% of the government health expenditure. Spending on inpatient curative services was the highest costing component, at 49% of current health expenditure, and 59% of government expenditure. In-patient care is highly labour-intensive and expensive. Injuries due to conflict-related trauma contribute to this high percentage because they require spe-cial programmes with a much higher average cost as compared with pro-grammes for the general population. This reduces the resources available for preventive and general care. On the other hand, over the same period, the share of total OPT spending on preventive and public health services was 7.7%, and the share of government spending on preventive and public health services was 14.0%. The private sector has low occupancy rates because they are more expensive than public hospitals. Underutilized hospitals are inefficient since a large portion of hos-pital costs are fixed, and the cost per patient is much higher.
There is little doubt that curative care is not as cost-effective as relatively inexpensive preventive services. It has been shown that investing in a well-defined package of evidence-based clinical preventive services is effective in preventing disease and offers very good economic value (20). It is therefore
sug-gested that deliberate efforts be taken to shift resources in the OPT from curative to preventive services. Policy-makers involved with health promotion should re-evaluate levels of current spending
in the health sector in order to be sure about future financial sustainability and return on investment. Health promo-tion and disease prevenpromo-tion efforts should be implemented by diverting additional resources.
Reorientation of the health system is needed also in terms of reducing the share of spending on inpatient services in favour of more day surgery, outpa-tient and home-based services. The payment methods for hospitals also play a major role in this shift. The way hospitals are currently organized and financed encourages excessive hospital utilization. Government hospitals in the OPT are reimbursed using global budget payment arrangements, which reward hospitals for doing more and which provide weak incentives for cost containment. Revision of hospital pay-ment systems to include capitation and diagnosis-related groups are some pos-sible options.
High level of out-of-pocket expenditure by households
The private sector accounted for the largest share of health funding in the OPT —about 61% of total cur-rent health expenditure. Remarkably, households bore most of this cost, as they contributed about 63% of private spending, exceeding the contribution of the government to health. The results showed that on average over the study period, households contributed 39% of current health expenditure, which is the largest source of financing. Households’ out-of-pocket expenditure per capita increased from US$ 54 in 2000 to US$ 133 in 2011, a 145% increase.
The World Bank has reported that the poorest population quintile of the OPT spent 40% of their income on medical expenses; a staggering financial burden (5). The burden on
individual households should be re-duced by a modified financing system. Global evidence indicates that it is difficult to achieve universal coverage and a high level of financial protection
if out-of-pocket payments are higher than 30% of current health expenditure (21). The OPT is on the borderline,
where about one-third of the burden of financing the health system falls pri-marily on households. A reduction in out-of-pocket payments would be an additive advantage as the OPT plans to moves towards universal coverage.
Our results also showed that on av-erage about 42% of the amount spent by households was spent on pharmaceuti-cals. Despite measures by the MoH to improve the efficiency of the pharma-ceutical sector—by training physicians, using generic drugs, introducing an essential medicines list, enforcing phar-maceutical pricing policy and regulating the retail pharmacy market to prevent self-prescribing of drugs—the problem of high pharmaceutical prices is evident in both the government and private sec-tors, and households bear the greatest cost. The domestic pharmaceutical in-dustry can produce about 700 different medicines, which satisfies the expecta-tions of half of Palestinians (22).
How-ever, there is a lack of real competition in the domestic pharmaceutical market (6). The MoH procures
pharmaceuti-cals as 7 times higher than international procurement prices (6). Besides, access
of the OPT to the neighbouring Arab markets, which could have provided medications at lower prices, is hindered by the trade restrictions of the Paris protocols, part of the Oslo Accords with Israel. Moreover, the shared customs system prevents the international phar-maceutical industry from implementing differential pricing for the OPT. The OPT national health accounts provide limited data on the cost of pharmaceuti-cals and other durable and non-durable medical products. Therefore, this study was unable to perform further analyses to address the issue of pharmaceutical expenditure, especially from the per-spective of households.
This article was an attempt to analyse health care spending patterns in the OPT to inform future health
References
1. Health status in Palestinian areas. Annual report. Ramallah: Palestinian Ministry of Health; 2013.
2. State of Palestine. In: Human development report 2014. Sustaining human progress: reducing vulnerabilities and building resilience. New York: United Nations Development Programme; 2014.
3. National health strategy 2014–2016. Ramallah: Palestinian Min-istry of Health; 2014.
4. Younis MZ, Jaber S, Mawson AR, Hartmann M. Estimating the unit costs of public hospitals and primary healthcare cent-ers. Int J Health Plann Manage. 2013 Oct-Dec;28(4):320–32. PMID:23125096
5. Health systems assessment report. Palestinian health sector reform and development project: the flagship project. Ramal-lah: Palestinian Ministry of Health; 2008.
6. Reforming prudently under pressure. Health financing reform and the rationalization of public sector health expenditure. In: West Bank and Gaza update: July 2009. More than just money. Washington (DC): World Bank; 2008. p 4.
7. Fiscal challenges and long term economic costs: economic monitoring report to the Ad Hoc Liaison Committee. Wash-ington (DC): World Bank; 2013.
8. Sabri N. Palestinian health sector review. 2007 (Available at SSRN: http://papers.ssrn.com/sol3/papers.cfm?abstract_ id=2364063, accessed 16 December 2015).
9. Younis MZ, Jabr SF, Plante C, Forgione DA. Estimation of health care costs and cost recovery: the case of Rafidya hospital in Palestine. J Health Care Finance. 2013 Summer;39(4):44–54. PMID:24003761
10. Guide to producing national health accounts: with special applications for low-income and middle-income countries. Geneva: World Health Organization; 2003 (http://www. who.int/health-accounts/documentation/English_PG.pdf, accessed 30 October 2015).
11. Households health expenditure survey 2004. Ramallah: Pales-tinian Central Bureau of Statistics; 2004.
12. A system of health accounts for international data. Paris: Organization for Economic Cooperation and Development; 2000.
13. National health accounts 2000–2008. Main findings. Ramal-lah: Palestinian Central Bureau of Statistics; 2011.
14. National health accounts 2009. Main findings. Ramallah: Pal-estinian Central Bureau of Statistics; 2010.
15. National health accounts 2010. Main findings. Ramallah: Pales-tinian Central Bureau of Statistics; 2011.
16. Palestinian Economic Bulletin. Issue 74, November 2012. London: The Portland Trust; 2012. (http://www.portlandtrust. org/publications/peb/issue-74-november-2012, accessed 30 October 2015).
17. West Bank and Gaza public expenditure review. Washington (DC): World Bank. 2007.
18. National health strategy 2011–2013. Ramallah: Palestinian Min-istry of Health; 2010.
19. Pavignani ER. F. Mirrors and mirages: Interpretations of the multiform, trans-border Palestinian healthcare system. Co-penhagen: Copenhagen School of Global Health; 2011. 20. Woolf SH, Husten CG, Lewin LS, Marks JS, Fielding JE, Sanchez
EJ. The economic argument for disease prevention: dis-tinguishing between value and savings. Washington (DC): Partnership for Prevention; 2009 (https://www.prevent.org/ data/files/initiatives/economicargumentfordiseasepreven-tion.pdf, accessed 30 October 2015).
21. Health financing strategy for the Asia Pacific Region (2010– 2015). Geneva: World Health Organization; 2009.
22. Schoenbaum M, Afifi A, Deckelbaum R. Strengthening the Pal-estinian health system. Santa Monica (CA): Rand Corporation; 2005 (http://www.rand.org/content/dam/rand/pubs/mono-graphs/2005/RAND_MG311-1.pdf, accessed 30 October 2015).
policy-making and planning. It is also an invitation to other researchers in the field to apply quantitative techniques to measure and provide a deeper insight into how health services are financed and organized. However, there is a need for additional research on health ex-penditure patterns in the OPT. Only this kind of understanding can help us to ensure that we are moving forward
in our journey to enhance the efficiency and sustainability of the health system in the OPT.
Key messages
• Health policy-makers in the OPT should reassess the current spend-ing levels in the health care sector to
ensure future financial sustainability and return on investment.
• Current financing mechanisms should be modified to reduce the bur-den on individual households. • More resources should be allocated
for health promotion and disease pre-vention programmes.
Funding: None.