Histogram Analysis Parameters
Apparent Diffusion Coefficient
for Distinguishing High and
Low-Grade Meningiomas: A
Multicenter Study
Alexey Surov*,†, Daniel T Ginat‡, Tchoyoson Lim§, Teresa Cabada¶, Ozdil Baskan#, Stefan Schob**, Hans Jonas Meyer†, Georg Alexander Gihr††, Diana Horvath-Rizea††, Gordian Hamerla**, Karl Titus Hoffmann** and Andreas Wienke‡‡ *
Department of Radiology, Martin-Luther-University Halle-Wittenberg, Germany;†Department of Diagnostic and Interventional Radiology, University of Leipzig, Germany; ‡University of Chicago, Pritzker School of Medicine, Chicago, IL, USA;§Department of Neuroradiology, National Neuroscience Institute, Singapore;¶Servicio de Radiologia, Hospital de Navarra, Pamplona, Spain;#Department of Radiology, School of Medicine, Istanbul Medipol University, Istanbul, Turkey;**Department of Neuroradiology,
University of Leipzig;†Clinic for Neuroradiology,
Katharinenhospital Stuttgart, Stuttgart, Germany;‡‡Institute of Medical Epidemiology, Biostatistics, and Informatics, Martin-Luther University Halle-Wittenberg, Halle, Germany
Abstract
Low grade meningiomas have better prognosis than high grade meningiomas. The aim of this study was to measure apparent diffusion coefficient (ADC) histogram analysis parameters in different meningiomas in a large multicenter sample and to analyze the possibility of several parameters for predicting tumor grade and proliferation potential. Overall, 148 meningiomas from 7 institutions were evaluated in this retrospective study. Grade 1 lesions were diagnosed in 101 (68.2%) cases, grade 2 in 41 (27.7%) patients, and grade 3 in 6 (4.1%) patients. All tumors were investigated by MRI (1.5 T scanner) by using diffusion weighted imaging (b values of 0 and 1000 s/mm2). For every lesion, the following parameters were calculated: mean ADC, maximum ADC, minimum ADC, median ADC, mode ADC, ADC percentiles P10, P25, P75, P90, kurtosis, skewness, and entropy. The comparison of ADC values was performed by Mann–Whitney-U test. Correlation between different ADC parameters and KI 67 was calculated by Spearman's rank correlation coefficient. Grade 2/3 meningiomas showed statistically significant lower ADC histogram analysis parameters in comparison to grade 1 tumors, especially ADC median. A threshold value of 0.82 for ADC median to predict tumor grade was estimated (sensitivity = 82.2%, specificity = 63.8%, accuracy = 76.4%, positive and negative predictive values were 83% and 62.5%, respectively). All ADC parameters except maximum ADC showed weak significant correlations with KI 67, especially ADC P25 (P =−.340, P = .0001).
Translational Oncology (2018)11, 1074–1079
Introduction
Meningioma is the most frequent intracranial tumor in adults with a prevalence of 13–26% of all intracranial neoplasms and an annual incidence of 6 per 100 000 population[1]. According to the world health organization (WHO), there are three subgroups of meningi-omas: low grade tumors (grade 1), moderately differentiated lesions (grade 2), and high grade or malignant tumors (grade 3)[1]. Most frequently (about 90%), WHO grade 1 tumors occur, whereas WHO www.transonc.com
Address all correspondence to: Professor MD Alexey Surov, Department of Diagnostic and Interventional Radiology, University Hospital of Leipzig, Liebigstrasse 20, 04103 Leipzig, Germany.
E-mail:[email protected]
Received 21 April 2018; Revised 23 June 2018; Accepted 25 June 2018
© 2018 The Authors. Published by Elsevier Inc. on behalf of Neoplasia Press, Inc. This is an open access article under the CC BY-NC-ND license (http://creativecommons.org/licenses/by-nc-nd/4.0/). 1936-5233/18
grade 2 are in 5–7%, and anaplastic variants (WHO grade 3) represent 1–3%[1].
Magnetic resonance imaging (MRI) plays an important role in diagnosis of meningioma and in surgical planning and/or evaluation of postoperative status. Besides diagnostic role, MRI, especially diffusion weighted imaging (DWI) can also characterize meningiomas and predict their behavior. For example, some previous reports suggested that a
quantified parameter of DWI, namely apparent diffusion coefficient (ADC) can differentiate low grade from high grade meningiomas[2–5]. It has been shown that grade 1 lesions had higher ADC values in comparison to grade 2 and/or 3 tumors [2–5]. Furthermore, also a threshold ADC value was proposed for distinguishing grade 1 and 2/3 tumors with a sensitivity of 72.9%, specificity of 73.1%, positive and negative predictive values of 54.1% and 86.1%, respectively[5].
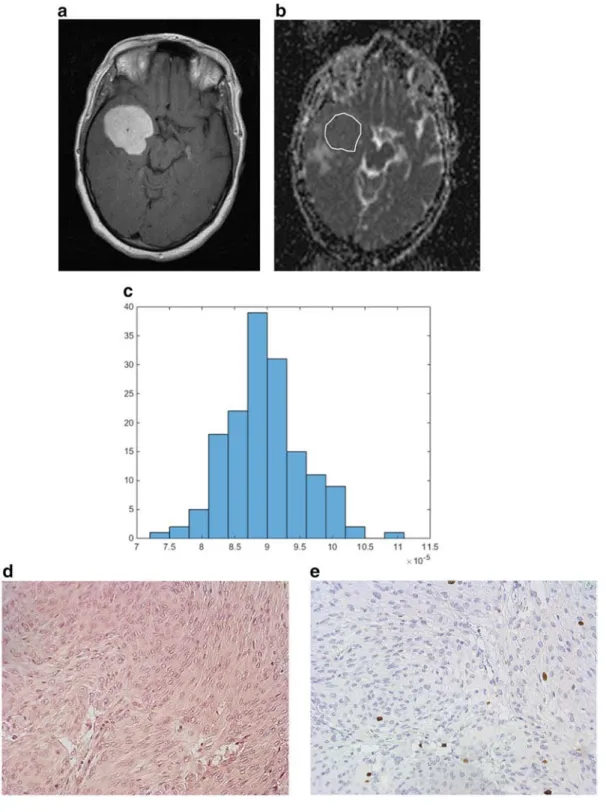
Figure 1. ADC histogram analysis parameters of a grade 1 meningioma. a. T1 weighted image after intravenous administration of contrast medium showing a right temporal meningioma. b. ADC map of the tumor with a ROI. c. ADC histogram. The histogram analysis parameters (× 10−3mm2s−1) are as follows: ADCmin= 0.74, ADCmean= 0.89, ADCmax= 1.09, P10 = 0.83, P25 = 0.86, P75 = 0.93, P90 =0.98, median = 0.9, mode = 0.9, kurtosis = 3.25, skewness = 0.24, and entropy = 2.97. d. Histopathological investigation after tumor resection: meningothelial meningioma (hematoxilin&eosin staining). e. KI 67 index of the tumor is 5% (MIB staining).
In the previous studies, ADC was acquired by drawing of a region of interest (ROI) through the largest cross-section of the tumor and the mean ADC value within a ROI was estimated[2–5].
Nowadays, a novel approach of ADC measure, namely histogram analysis, is described in the literature[6]. Using this method, a broad spectrum of ADC values can be estimated: mean ADC, maximum ADC, minimum ADC, median ADC, mode ADC, and different ADC percentiles, as well and statistical parameters like kurtosis, skewness, and entropy[7]. Presumably, ADC histogram analysis parameters may be more sensitive than“conventional” ADC values in prediction of tumor grading and proliferation potential in meningiomas.
Therefore, the purpose of the present study was to measure of ADC histogram analysis parameters in different meningiomas in a large multicenter sample and to analyze the possibility of use of several parameters for predicting tumor grade and proliferation potential. Material and Methods
Patients and Tumors
This retrospective study was initiated by the department of radiology of the Martin-Luther-university Halle-Wittenberg and has been approved by the Institutional (Ethic Committee of the Medical Faculty, Martin-Luther-university, study code: 2014–99). All methods were performed in accordance with the relevant guidelines and regulations. Because of the retrospective nature of this study, informed consent was waived.
For this study, data from 7 radiology departments were acquired retrospectively, including the following centers:
- Department of Radiology, Martin-Luther-University Halle-Wittenberg, Germany;
- Department of Radiology, University of Chicago, Pritzker School of Medicine, Chicago, IL, USA;
- Department of Neuroradiology, National Neuroscience Institute, Singapore;
- Clinic for Neuroradiology, Katharinen Hospital Stuttgart, Stuttgart, Germany;
- Servicio de Radiologia, Hospital de Navarra, Pamplona, Spain; - Department of Radiology, School of Medicine, Istanbul Medipol
University, Istanbul, Turkey;
- Department for Neuroradiology, University Hospital Leipzig, Leipzig, Germany;
The primary sample consisted of 219 tumors. Inclusion criteria were as follows:
- primary tumors, - tumor sizeN10 mm, - available ADC maps,
- available data about tumor grade, - available data about expression of KI 67.
Overall, 71 tumors were excluded because the following reasons: 11 lesions were recurrent tumors, for 19 meningiomas no ADC maps were available, no tumor grading was given for 7 tumors, 9 meningiomas were smaller than 10 mm in diameter and could not be identified on ADC maps, finally, ADC maps showed significant artifacts in 25 tumors.
Therefore, our study comprised 148 meningiomas in 148 patients (94 women, 54 men; mean age 52.2 ± 14.0 years, range, 5–91 years). All 148 meningiomas were surgically resected and analyzed histopathologically. Tumor grading was classified according to the World Health Organization
[1]. Grade 1 lesions were diagnosed in 101 (68.2%) cases, grade 2 in 41 (27.7%) patients, and grade 3 in 6 (4.1%) patients.
ADC Histogram Measurement
In each case the identified meningioma was investigated by MRI (1.5 T scanner) by using DWI (multi-shot echo-planar-imaging sequence with b values of 0 and 1000 s/mm2).
ADC images of the included tumors were saved in DICOM format and processed offline with custom-made Matlab-based application (The Mathworks, Natick, MA) on a standard windows system according to our previous description[7]. In every case, polygonal regions of interest (ROI) were manually drawn on the transferred ADC maps along the contours of the primary tumor on each slice (whole lesion measure). ROIs were placed to avoid cystic and necrotic areas as well as large vessels of the tumors. All measurements were performed by one radiologist (A.S., 15 years radiological experience). The position of the ROIs was verified using postcontrast T1 weighted images (Figure 1, A and B). The following parameters were calculated: mean ADC (ADCmean), maximum ADC (ADCmax), minimum ADC (ADCmin), median ADC (ADCmedian), mode ADC (ADCmode). Furthermore, ADC percentiles: 10th (P10 ADC), 25th (P25 ADC), 75th (P75 ADC), and 90th (P90 ADC), as well histogram-based characteristics of the ROIs - kurtosis, skewness, and entropy– were also estimated (Figure 1C)[7].
Statistical Analysis
For statistical analysis the SPSS statistical software package was used (SPSS 17.0, SPSS Inc., Chicago IL, USA). All measurement were non-normally distributed according to Kolmogorov–Smirnov-test. Continu-ous variables were described by mean value, median and standard deviation. Categorical variables were given as relative frequencies. The comparison of ADC values between high and low grade tumors was performed by Mann–Whitney -U tests where the p-values are adjusted for multiple testing (Bonferroni correction). The correlation between different ADC parameters and KI 67 values was calculated by Spearman's rank correlation coefficient (p). Sensitivity, specificity, negative and positive predictive values, accuracy, and area under the curve were calculated for the diagnostic procedures. Thresholds were chosen to maximize the Youden index. A P-value of less than 0.05 was considered to be statistically significant.
Results
ADC Values and Tumor Grading
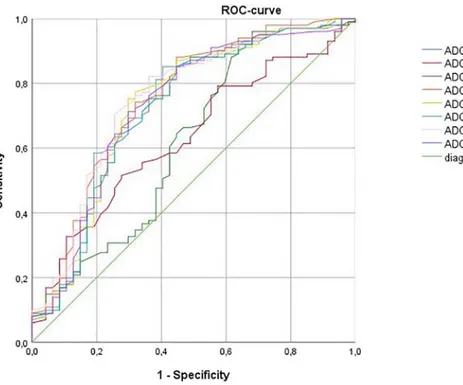
Grade 2/3 meningiomas showed statistically significant lower ADC histogram analysis parameters in comparison to grade 1 tumors (Table 1). On the next step, different ADC values were checked for possibility to distinguish grade 1 from grade 2/3 lesions. Receiver operating characteristic (ROC) analysis (Figure 2 and Table 2) showed that ADC median was more sensitive in comparison to other parameters.
Table 1. Comparison of ADC Histogram Analysis Parameters Between Grade 1 and Grade 2/3 Tumors
Parameters Grade 1 Grade 2/3 P values
ADCmean 0.99 ± 0.74 0.86 ± 0.23 0.004 ADCmin 0.75 ± 0.89 0.59 ± 0.22 0.008 ADCmax 2.17 ± 3.00 1.51 ± 0.62 0.009 ADC P10 0.94 ± 1.00 0.76 ± 0.21 0.001 ADC P25 1.06 ± 1.26 0.81 ± 0.21 0.004 ADC P75 1.21 ± 1.45 0.95 ± 0.26 0.005 ADC P90 1.40 ± 1.80 1.25 ± 1.00 0.07 ADCmedian 1.00 ± 1.59 0.81 ± 0.22 0.001 ADCmode 1.19 ± 1.55 0.85 ± 0.22 0.003 Kurtosis 8.11 ± 8.92 7.96 ± 9.51 0.52 Skewness 1.05 ± 1.27 1.08 ± 1.17 0.74 Entropy 3.57 ± 1.26 3.65 ± 0.89 0.77
Using Youden index a threshold value of 0.82 for ADCmedian was identified. This threshold yielded a sensitivity of 82.2%, a specificity of 63.8%, and an accuracy of 76.4%. The positive and negative predictive values were 83% and 62.5%, respectively.
KI 67 Status
The level of the proliferation index Ki 67 was available for all 148 patients. The mean value of KI 67 expression was 6.84 ± 6.67%, range 1–38%, and median value of 5%. Most of histogram analysis parameters showed significant correlations with KI 67 expression ranging from P =−.34 (P = .0001) for ADC p25 to P = −.263 (P = .001) for ADC P90 (Table 3).
Next, ROC analysis was performed for differentiating tumors with high proliferative potential from tumors with low expression of KI 67 using ADC values (Table 4). Based on the results, ADC P25 was selected for further analysis.Table 5shows ROC analysis parameters for ADC P25 using different threshold values of KI 67 expression. Discussion
This is the first multicenter study that evaluates relationships between ADC histogram analysis parameters and tumor grade/proliferation activity in meningioma.
According to the literature, ADC histogram analysis parameters can reflect different histopathological features in several tumors[8–11]. It has also been shown that ADC histogram analysis parameters were more sensitive in comparison to widely used mean and/or minimal ADC
Table 3. Correlation Coefficients Between ADC Histogram Analysis Parameters and Expression of KI 67 in Meningioma
Parameters Correlation coefficients
ADCmean P = −.322 (P = .0001) ADCmin P = −.209 (P = .011) ADCmax P =−.054 (P = .513) ADC P10 p = −.322 (P = .0001) ADC P25 p = −.340 (P = .0001) ADC P75 P = −.314 (P = .0001) ADC P90 p = −.263 (P = .001) ADCmedian P = −.329 (P = .0001) ADCmode P = −.333 (P = .0001) Kurtosis P = .072 (P = .384) Skewness P = .115 (P = .165) Entropy P = .083 (P = .315)
Significant correlations are highlighted in bold.
Table 2. Area Under the Curve for Different ADC Histogram Analysis Parameters as Predictor of Tumor Grade
Parameters Area Under the Curve
ADCmean 0.733 ADCmin 0.63 ADCmax 0.62 ADC P10 0.749 ADC P25 0.73 ADC P75 0.72 ADC P90 0.72 ADCmedian 0.751 ADCmode 0.73
Figure 2. Receiver operating characteristic (ROC) curves for ADC histogram analysis parameters in distinguishing grade 1 meningiomas from grade 2/3 tumors.
Table 4. Area Under the Curve for Different ADC Histogram Analysis Parameters as Predictor of KI 67 Expression
Parameters Area Under the Curve
ADCmean 0.635 ADCmin 0.588 ADCmax 0.496 ADC P10 0.628 ADC P25 0.647 ADC P75 0.635 ADC P90 0.607 ADCmedian 0.638 ADCmode 0.646
values [9–11]. For instance, in thyroid cancer, several parameters correlated statistically significant with expression of tumor suppressor protein p53 [9]. Furthermore, in cervical cancer, ADC histogram analysis parameters can predict lymph node metastases: nodal-positive tumors showed statistically significant lower ADC percentiles (10th, 25th, 50th, 75th, 90th), as well ADCmin, ADCmean, ADCmedianand ADCmode values in comparison to nodal-negative carcinomas [10]. Finally, ADC histogram analysis parameters were associated with expression of p53, proliferation index KI 67, epidermal growth factor receptor and with programmed cell death protein PD1[11]. Overall, the reported data suggest that ADC histogram analysis is a sensitive instrument to predict tumor behavior in several malignancies.
The present study showed that also in meningioma parameters of ADC histogram analysis can reflect relevant histopathological features. As shown, grade 2/3 meningiomas had statistically significant lower several ADC values in comparison to grade 1 tumors. These results confirmed our previous investigations [5]. Moreover, two parameters, namely ADCmedianand ADC P10 were more sensitive in comparison to other ADC values and can distinguish grade 1 meningiomas from grade 2/3 tumors with higher sensitivity than those previously reported for ADC mean [5]. Recently, it has been shown that entropy of ADC values may be used for prediction of tumor grade in meningioma[12]. Our results did not confirm these data.
Furthermore, our study identified that several ADC histogram analysis parameters correlated weakly with KI 67 expression. KI 67 is a non-histone, nuclear protein synthesized throughout the whole cell cycle except the G0 phase and it is one of numerous proliferation markers that play a significant role in meningiomas[1]. For example, meningiomas that recur tend to have higher KI 67 expression than those that do not[1]. Our finding is in agreement with previous reports, which also observed weak-to-moderate correlations between ADC, namely ADCmean, and KI 67 [2,13]. However, the present study showed that ADC P25 may better predict tumors with high proliferation activity than other parameters.
As reported previously, prediction of tumor grade of meningiomas based on imaging findings is very important[5,14,15]. Meningioma is the most frequent intracranial tumor and is often an incidental finding on imaging. Therefore, it is relevant to know what tumor grade is present [5,14]. Furthermore, it is also crucial for surgical planning[14]. Similarly, it is of importance to differentiate tumors with high and low proliferation activity. Previously, numerous studies attempted to build scores to predict tumor grade in meningioma based on different imaging modalities [15–18]. Especially MRI findings were in focus of the investigations. The analyses included MRI characteristic like enhancement intensity, tumor associated brain edema, and tumor shape[15]. For example, in the study of Lin et al. a score, which included patient's age, tumor-brain interface, tumor enhancement, and capsular enhancement, was proposed[15]. However, these analyses are investigator-dependent. Furthermore, the reported scores had low sensitivity and/or specificity.
Ultimately, ADC histogram analysis can serve as a quantitative imaging biomarker that can be implemented in routine clinical practice.
In conclusion, ADC histogram analysis can be used for prediction of tumor grade and proliferation potential of meningioma. In particular, ADCmedian can differentiate grade 1 meningioma from grade 2/3 tumors and ADC P25 may help to identify tumors with high proliferation activity.
Conflict of Interest There are no conflicts of interest. Additional Information Competing Interests statement.
The authors declare no competing interests. Author Contributions
1. Conceptualization: AS
2. Data curation: AS, DTG, TL, TC, OB, GAG, DHR, GH 3. Formal analysis: AS, AW, KTH
4. Investigation: AS, SS, HJM. 5. Methodology: AS, HJM, AW. 6. Project administration: AS. 7. Resources: AS, HJM, SS. 8. Software: HJM, AS, SS. 9. Supervision: KTH, AS. 10. Validation: AS, HJM, SS. 11. Visualization: SS, AS, HJM. 12. Writing– original draft: AS.
13. Writing– review & editing: KTH, SS, AS, TL, TC, OB, GAG, DHR, GH.
References
[1] Whittle IR, Smith C, Navoo P, and Collie D (2004). Meningiomas. Lancet 363, 1535–1543.
[2] Surov A, Gottschling S, Mawrin C, Prell J, Spielmann RP, Wienke A, and Fiedler E (2015). Diffusion weighted imaging in meningioma: prediction of tumor grade and association with histopathological parameters. Transl Oncol 8, 517–523.
[3] Hakyemez B, Yildirim N, Gokalp G, Erdogan C, and Parlak M (2006). The contribution of diffusion-weighted MR imaging to distinguishing typical from atypical meningiomas. Neuroradiology 48, 513–520.
[4] Nagar VA, Ye JR, Ng WH, Chan YH, Hui F, Lee CK, and Lim CC (2008). Diffusion-weighted MR imaging: diagnosing atypical or malignant meningiomas and detecting tumor dedifferentiation. AJNR Am J Neuroradiol 29, 1147–1152.
[5] Surov A, Ginat DT, Sanverdi E, Lim CC, Hakyemez B, Yogi A, Cabada T, and Wienke A (2016). Use of diffusion weighted imaging in differentiating between malignant and benign meningiomas. A multicenter analysis. World Neurosurg 88, 598–602.
[6] Just N (2014). Improving tumour heterogeneity MRI assessment with histograms. Br J Cancer 111, 2205–2213.
[7] Meyer HJ, Leifels L, Schob S, Garnov N, and Surov A (2018). Histogram analysis parameters identify multiple associations between DWI and DCE MRI in head and neck squamous cell carcinoma. Magn Reson Imaging 45, 72–77.
[8] Takahashi M, Kozawa E, Tanisaka M, Hasegawa K, Yasuda M, and Sakai F (2016). Utility of histogram analysis of apparent diffusion coefficient maps obtained using 3.0 T MRI for distinguishing uterine carcinosarcoma from endometrial carcinoma. J Magn Reson Imaging 43, 1301–1307.
Table 5. Receiver Operating Characteristic (ROC) Analysis for ADC P25 as Predictor of KI 67 Expression
KI 67, % Threshold Values Sensitivity Specificity Area Under the Curve Positive Predictive Value Negative Predictive Value Accuracy
Ki67b 5% 0.78 0.806 0.519 0.647 0.581 0.764 0.649
Ki67b 10% 0.78 0.752 0.674 0.701 0.849 0.527 0.730
Ki67b 15% 0. 78 0.688 0.750 0.761 0.946 0.273 0.696
[9] Schob S, Meyer HJ, Dieckow J, Pervinder B, Pazaitis N, Höhn AK, Garnov N, Horvath-Rizea D, Hoffmann KT, and Surov A (2017). Histogram Analysis of Diffusion Weighted Imaging at 3T is Useful for Prediction of Lymphatic Metastatic Spread, Proliferative Activity, and Cellularity in Thyroid Cancer. Int J Mol Sci 18E821.
[10] Schob S, Meyer HJ, Pazaitis N, Schramm D, Bremicker K, Exner M, Höhn AK, Garnov N, and Surov A (2017). ADC Histogram analysis of cervical cancer Ai -Detecting Lymphatic Metastases-a Preliminary Study. Mol Imaging Biol 19, 953–962.
[11] Meyer HJ, Höhn AK, and Surov A (2018). Histogram Analysis of ADC in rectal cancer: associations with different histopathological findings including expression of EGFR, Hif 1alpha, VEGF, p53, PD 1, and KI 67. A preliminary study. Oncotarget 9(26), 18510–18517.
[12] Gihr GA, Horvath-Rizea D, Garnov N, Kohlhof-Meinecke P, Ganslandt O, Henkes H, Meyer HJ, Hoffmann KT, Surov A, and Schob S (2018). Diffusion Profiling via a Histogram Approach Distinguishes Low-grade from High-grade Meningiomas, Can Reflect the Respective Proliferative Potential and Progesterone Receptor Status. Mol Imaging Biol.https://doi.org/10.1007/s11307-018-1166-2.
[13] Surov A, Meyer HJ, and Wienke A (2017). Correlation between apparent diffusion coefficient (ADC) and KI 67 in different tumors: A Meta-Analysis. Part 1: ADCmean. Oncotarget 8, 75434–75444.
[14] Chamoun R, Krisht KM, and Couldwell WT (2011). Incidental meningiomas. Neurosurg Focus 31E19.
[15] Lin BJ, Chou KN, Kao HW, Lin C, Tsai WC, Feng SW, Lee MS, and Hueng DY (2014). Correlation between magnetic resonance imaging grading and pathological grading in meningioma. J Neurosurg 121, 1201–1208.
[16] Hsu CC, Pai CY, Kao HW, Hsueh CJ, Hsu WL, and Lo CP (2010). Do aggressive imaging features correlate with advanced histopathological grade in meningiomas? J Clin Neurosci 17, 584–587.
[17] Kawahara Y, Nakada M, Hayashi Y, Kai Y, Hayashi Y, Uchiyama N, Nakamura H, Kuratsu J, and Hamada J (2012). Prediction of high-grade meningioma by preoperative MRI assessment. J Neurooncol 108, 147–152.
[18] Hashiba T, Hashimoto N, Maruno M, Izumoto S, Suzuki T, Kagawa N, and Yoshimine T (2006). Scoring radiologic characteristics to predict proliferative potential in meningiomas. Brain Tumor Pathol 23, 49–54.