Kastamonu Eğitim Dergisi
Kastamonu Education Journal
Ocak 2019 Cilt:27 Sayı:2
kefdergi.kastamonu.edu.tr
Teachers’ Computer Self-Efficacy Scale: Development and Validation
1Öğretmenler için Bilgisayar Öz-yeterlilik Ölçeği: Geliştirme ve Doğrulama
Polat ŞENDURUR
2, Soner YILDIRIM
3Abstract
The aim of the study is to develop a computer self-efficacy scale (CSES) to assess teachers’ computer self-effi-cacy beliefs in terms of technology integration. A valid and reliable instrument is a need for technology integration studies because computer self-efficacy has been shown as a generic variable in different technology adaptation studies. This scale provides with an alternative measurement for researchers through a major focus on technology integration related dimensions. 110 pre-service, and 115 in-service teachers participated in the study. Exploratory and confirmatory factor analyses, and reliability analyses indicated high validity and reliability of CSES. Five subs-cales were revealed and confirmed after EFA and CFA. Each factor has reliability coefficients higher that .89. All the results supported that CSES is an acceptable instrument to measure teachers’ computer self-efficacy beliefs
Keywords: self-efficacy, computer, technology, teacher, in-service, pre-service
Öz
Bu araştırmanın amacı, teknoloji entegrasyonu bağlamında öğretmenlerin bilgisayar öz-yeterlilik inançlarını ölç-mek için bir ölçek geliştirölç-mektir. Teknoloji adaptasyonu üzerine yapılan çalışmaların ve geliştirilen modellerin bir-çoğunda bilgisayar öz-yeterliliği genel bir değişken olarak gözlemlendiğinden, geçerliliği ve güvenirliği test edilmiş ölçme araçları teknoloji entegrasyonu çalışmaları için önemli bir gereksinimdir. Bu çalışmanın amacı araştırmacılar için odak noktası bilgisayar ve teknoloji entegrasyon boyutunda alternatif bir ölçme aracı sunmaktadır. Çalışmaya 110 öğretmen adayı ve 115 hizmet-içi öğretmen katılmıştır. Keşfedici ve onaylayıcı faktör analizleri, güvenilirlik ana-lizleri çalışma sonunda elde edilen bilgisayar öz-yeterlilik ölçeğin yüksek geçerlilik ve güvenilirliğe sahip olduğunu göstermiştir. Her bir alt boyut .89’un üzerinde geçerlilik düzeyine sahip beş alt boyut ortaya çıkarılmıştır. Sonuçlar ölçeğin öğretmenlerin öz-yeterlilik algılarını ölçmek için uygun olduğunu göstermektedir.
Anahtar Kelimeler: öz-yeterlilik, bilgisayar, teknoloji, öğretmen, hizmet içi, hizmet öncesi
1. This article is a part of doctoral dissertation.
2. Ondokuz Mayıs University, Samsun, Turkey ; https://orcid.org/0000-0003-2225-2359
Başvuru Tarihi/Received: 25.12.2017
Kabul Tarihi/Accepted: 30.10.2018
1. Introduction
The dramatic developments in technology have caused increases in both students’ and teachers’ use of computer technologies. While the 30-year old report published by American Library Association (1989) has been highlighting teachers’ role to educate people as information and technology literate, there are considerable number of initiatives today to increase teachers’ information and communication technology (ICT) proficiencies (Gil-Flores, Rodríguez-San-tero, & Torres-Gordillo, 2017; Hsu, 2010). It is not realistic to expect from ICT illiterate teachers to educate ICT literate students. On the other hand, being literate in computer, technology or information may not always guarantee to enhance literacy levels of students. In order to achieve that, teachers should be efficient and competent in using tech-nology for educational activities.
According to ICT Competency Frameworks for Teacher published by UNESCO (2011), teachers should have basic competencies related with ICT literacy. In addition, they should also be able to use those skills to manage curricula, and support classroom activities. From this perspective, ICT competencies of teachers can be divided into two; (i) basic ICT skills to use computers and (ii) other technologies for general purposes and advance ICT skills to promote teac-hing-learning processes in schools (Tınmaz, 2004; Toker, 2004; Markauskaite, 2007). The competency is directly related with the ICT literacy. Teachers’ lack of ICT literacy has been shown as a significant barrier to ICT integration by different studies (Stolle, 2008; Yalın, Karadeniz, & Şahin, 2007; Oktay, & Çakır, 2013; Paily, 2013; Leow, & Neo, 2014). Therefore, to measure and understand teachers’ ICT literacy is a vital issue to guarantee ICT integration. This situation has led the development of different instruments measuring teachers’ ICT literacy. For example, Markauskaite (2007) developed a questionnaire measuring ICT related capacities of teachers. Archambault, and Barnett (2010) constructed another ins-trument to assess the nature of technological pedagogical content knowledge of teachers. Kim, Jung, and Lee (2008) examined Korean ICT training programs and defined necessary ICT skills teachers should have. On the other hand, ICT literacy does not always provide intended results alone for the integration.
Today, we are witnessing important transformations in the system of education. In this new form of education, cre-ating interactive and student-centered learning environments constitutes an important part of this system, so teachers should be able to construct such environments. This requires mainly computer, technology, and information literacy skills. Nevertheless, being computer, technology or information literate is not enough to equip students with the same skills. According to Bandura (1993, p. 144), “people with low self-efficacy in a given domain, get shy away from difficult tasks, which they perceive as personal threats”. If integration of ICTs has the potential to contribute to the quality of education, there is a need to train ICT literate teachers with the feeling of self-efficacy.
Technology adaptation model developed by Hu, Clark, and Ma (2003) has shown that computer self-efficacy is a variable directly affecting teachers’ intention to use ICT. Teo (2009) developed another adaptation model with a similar intention. Despite the 6-year gap between these two studies, computer self-efficacy belief was defined as a decisive factor on teachers’ behavioral intention to use ICT for educational purposes. Inan and Lowher (2009) found that com-puter self-efficacy belief is among teacher beliefs, which significantly affect technology integration. There are other studies trying to investigate factors affecting technology integration or technology acceptance in schools by testing paths or models (Robinson, 2003; Mathews & Guarino, 2000; Karaca, 2011. In all these models, teachers’ computer self-efficacy beliefs have been defined as strong predictors of ICT presence in schools.
The number of studies to understand relationship between technology and education has been growing rapidly in Turkey due to countrywide project called FATİH, which aims both to increase and enhance the integration of technology into educational settings. Considerable amount of these studies is related with teachers’ computer self-efficacy beliefs. Cetin and Gungor (2014) investigated primary school teachers’ computer self-efficacy beliefs using a measurement developed by Sensoy (2004). Akgun, Akgun, and Simsek (2015) measured social science teacher candidates’ computer self-efficacy beliefs with the questionnaire created by Arslan (2006). Some other computer self-efficacy measurement instruments used in Turkey in last three years are the instruments of Murphy, Cover and Owen (1989); Compeau and Higgins (1995); Eastin and LaRose (2000); Moran and Hoy (2001); Wang, Ertmer and Newby (2004). In general, those instruments are not up to date. Majority of them are not specific to teachers’ computer self-efficacy beliefs, i.e. they focus on general self-efficacy beliefs.
Akkoyunlu, Orhan and Umay (2005) created a scale, which is specific to computer science teachers. Banoglu, Van-derlinde, and Yildiz (2015) were in a similar effort to check the validity and reliability of a self-efficacy scale for com-puter teachers. They worked with ICT pre-service teachers from three state universities of Turkey. They finalized their research with a 34-item computer self-efficacy scale for ICT teachers. Since these scales are only appropriate for
com-puter teachers, there is still a necessity for an up-to-date scale. For this reason this study aimed to develop a comcom-puter self-efficacy scale for teachers. Unlike other scales, the current one does not only focus on computer abilities of teac-hers, but also also emphasizes to measure teachers’ efficacy belief in terms of technology integration to educational situations.
2. Research Method
This study includes identification of computer self-efficacy scale’s validity and reliability. Information about the sub-jects, statistical methods, and overall procedure of the study constitutes the content of this chapter.
Population and Subjects
Pre-service teachers from Middle East Technical University (METU) were selected as the target population for exp-loratory factor analysis (EFA). All of these students took at least one computer related course because of the formal curriculum of METU Faculty of Education. 110 students from the departments of Foreign Language Education (FLE), Chemistry Education (CHED), Physics Education (PHED), Early Childhood Education (ECE) and Elementary Math Edu-cation (EME) were the voluntary participants. Table-1 demonstrates distribution of the sample across departments. Table 1. Distribution of the sample over departments
ƒ % Valid % Cumulative %
Chemistry Education 16 14.5 14.5 14,5
Early Childhood Education 11 10.0 10,0 24.5
Elementary Math Education 11 10.0 10,0 34.5
Foreign Language Education 60 54.5 54.5 89.1
Physics Education 12 10.9 10.9 100.0
Total 110 100.0 100.0
The researchers also conducted Confirmatory Factor Analysis (CFA) on another set of data collected from in-service teachers. 115 in-service teachers filled the questionnaire correctly.
Procedure
Researchers and two field experts generated the pool of items for this self-efficacy scale. In addition, they took existing computer self-efficacy scales (Murphy, Cover & Owen, 1989; Compeau & Higgins, 1995; Eastin & LaRose, 2000; Wang, Ertmer & Newby, 2004; Akkoyunlu, Orhan, & Umay, 2005)) into consideration to ensure content validity. There were 39 items in the pool. These items covered statements about “educational software and material development”, “Internet and Internet applications”, “technical information”, “general knowledge and individual development”, and “in-door and out-door activities”.
The items of the Computer Self-Efficacy Survey were reviewed and edited by colleagues and experts. One of the reviewers was an expert about computer education, and he checked items to be sure about the content validity. After this review, three items were eliminated from the item pool, and many of them were also edited because of the lingu-istic errors, complexity in understanding, and content issues. Researchers decided to include 36 revised items in the survey. Authors used a 9-point scale where 1 is for lowest efficacy and 9 is for highest efficacy.
A cognitive interview was conducted with the final form of the survey. A 3rd grade FLE student joined voluntarily to the interview. It showed that all questions were clear and easy to understand. She did not express any difficulty to rate her efficacy level for the questions. Only order of the items was reorganized according to the information gained by this interview.
There were two different data collection sessions. In the first session, researchers collected data from pre-service teachers and this data used for EFA. After conducting EFA and revising the questionnaire, another set of data was col-lected from in-service teachers and used for CFA.
Data analysis
EFA needs to control of some statistical assumptions. “These assumptions are appropriateness of sample size, linea-rity, normality, and multi-collinearity (Tabachnick, & Fidell, 2001, p. 628)”. Researchers controlled all these assumptions before EFA. Then, they checked eigenvalue and scree plots to determine number of possible factors. Oblique rotation was used for second round of exploratory factor analysis. Rotated solutions were considered for the instrument’s cons-tructs.
3. Results
Authors administered EFA on the first dataset to check the validity of the instrument and to find out subcomponents of the computer self-efficacy scale. They also controlled the assumptions of EFA beforehand.
Exploratory factor analysis (EFA)
According to Tabachnick and Fidell (2001, p. 59), “if there is only a few data points about 5% are missing in a data set, handling of these missing points yields similar results”. Frequency distribution for each item showed that there was not any missing data or any input outside the range of codes. The next assumption checked in the study was the ap-propriateness of the sample size. Sample size between 100 and 200 is fair for EFA (Tabachnick, & Fidell,, 2001, p. 588.) In addition, The Kaiser-Meyer-Olkin Measure of sampling adequacy tests was applied. KMO value is 0.928, and this guaranties the adequacy of the sample size. Bartlett’s test of sphericity was also significant (2 =3283.688, df=639, p < .001). Therefore sample size assumption for the study was provided. Researchers checked univariate and bivariate nor-mality assumptions to ensure multivariate nornor-mality. Histograms, Q-Q plots, skewness and kurtosis, and Shapiro-Wilk and Kolomogrov-Smirnow analyses were examined. Results did not show any violation of normality.
During the analyses, two items were eliminated. The data gained from the item correlation matrix revealed that item-4 have small correlations with the other items of the instrument. According to Palland (2001), correlations below the value 0.3 are not appropriate. For this reason item-4 was not included in the further analyses. In addition item-23 also loaded more than one factor with the similar values, so it was also eliminated.
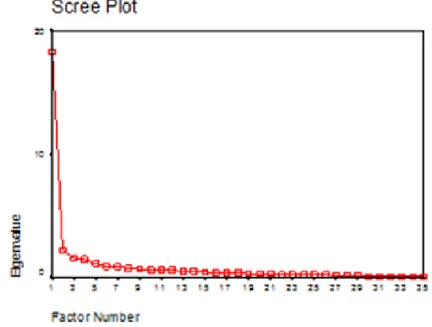
Maximum likelihood factor analysis was used to determine the subdimensions of the scale. Scree plot (Figure-1) and Eigen-values (Appendix-1) gave information to decide number of possible factors. Interpretation of the scree-plot showed that number of factors should be four or five. According to total variance explained, 5 factor showed an ei-gen-value greater than 1. The first factor explained 55.86%, the second factor 6.30%, the third factor 4.44%, the fourth factor 3.62%, and fifth factor explained 3.34% of the total variance. Those five factors also explained 73.56% of the total variance.
A maximum likelihood factor analysis was conducted on the remaining 34 items, using oblimin rotations, with the five factors explaining 73,56% of the variance. Pattern matrix for these 5 factors was presented in the Table 2.
Table 2. Pattern Matrix
Factors 1 2 3 4 5 ITEM12 .647 .181 .186 ITEM16 .617 .108 -.132 -.189 ITEM6 .513 .236 -.143 -.120 ITEM9 .467 .184 .360 -.171 ITEM10 .434 .106 -.185 -.173 ITEM13 .327 .221 -.244 ITEM21 .811 .238 ITEM22 .687 ITEM24 .653 -.105 -.198 ITEM20 .612 .115 -.220 -.104 ITEM18 .338 .489 .184 -.118 .115 ITEM17 .277 .453 -.219 ITEM25 .215 .442 -.105 ITEM1 -.128 .105 .779 .109 -.278 ITEM2 .223 .653 ITEM3 .277 .563 -.106 ITEM5 .376 .505 -.121 ITEM8 .150 .325 .472 -.179 .105 ITEM30 .186 .486 -.787 -.103 ITEM35 .102 -.160 -.685 ITEM36 -.146 .183 .307 -.616 ITEM31 .138 .302 -.104 -.587 -.121 ITEM34 -.244 .247 .306 -.571 -.134 ITEM32 .137 .238 -.491 -.312 ITEM33 -.299 -.663 ITEM15 .189 .190 -.645 ITEM28 .115 -.125 -.619 ITEM26 -.618 ITEM27 .103 -.175 -.600 ITEM19 .383 -.595 ITEM11 .103 -.161 .261 -.513 ITEM7 .176 -.141 -.504 ITEM14 .312 .104 -.144 -.479 ITEM29 .231 .225 -.204 -.442
Table 2 indicated that nearly all of the items have primary loadings over .4 and about half of them also have more than .5 primary factor loadings. Total variance explained after rotation is 70.37% (appendix 2). Primary loadings of the items let the researchers to group them under five meaningful factors. These factors are;
• Use of Internet and computer for support; • Technical knowledge;
• Office programs and their applications; • Classroom applications, and;
• Advance computer use
Table 3 demonstrates the items under each factor and reports the Cronbach alpha coefficients. Cronbach alpha coefficient, which ranges from 0 to 1, was used to check the reliability of each factor under computer self-efficacy scale (Fraenkel, &Wallen, 2006 Tabachnick, & Fidel 2001). If the Cronbach alpha coefficient is close to 1, it indicates high re-liability. The alpha values of the subscales are respectively 0.90, 0.91, 0.90, 0.92, and 0.91 and all these values indicate
acceptable reliability values, which was defined as 0.70 by Palland (2001). Confirmatory factor analysis (CFA)
Since exploratory factor analysis were conducted with the data gathered from pre-service teachers, the researcher also managed a CFA to confirm that previously explored structure of the Computer Self-Efficacy Questionnaire had preserved the structure with the data coming from in-service teachers. Final form of the Computer Self- Efficacy Qu-estionnaire was distributed to 134 in-service teachers. 115 of Computer Self-Efficacy QuQu-estionnaire form were filled correctly and they were coded into a SPSS file.
LISREL 8.51 was used to conduct confirmatory factor analysis. The five factors (“use of Internet and computer for support”, “technical knowledge”, “Office programs and their applications”, “classroom applications”, and “advance computer use”) explored through EFA were coded into LISREL as latent variables. Researchers established the relations among items and latent variables. Finally they run the model.
Analysis yielded satisfactory results indicating acceptable fit of the questionnaire. According to Hair, Black, Babin, Anderson, & Tatham (2006), there are more than one guidelines to determine whether a model fits or not and using three or four fit indices is adequate to decide if a model has acceptable fit or not. Values of χ2, Confirmatory Fit Index (CFI), Standardized Root Mean Square Residual Index (SRMR), and Root Mean Square Error of Approximation (RMSEA) are sufficient decide model fit. In the light of this information, χ2, CFI and RMSEA values were reported as evidences. RMSEA and SRMR were found as .076 and .051 respectively and these values are satisfactory if you have more than 30 items and less than 250 participants (Hair et al., 2006). In addition, χ2 value (with df=550) was significant (p<.01). Lastly, CFI (.96) confirmed the model fit.
Table 3: Item-total statistics
Factor Item number Scale mean if item deleted Squared multiple cor-relation Alpha if item deleted
Use of Internet and computer sup-port 6 35.7182 .5959 .8791 9 35.8182 .6554 .8748 10 36.6182 .5510 .8927 12 35.3273 .6485 .8757 13 34.5091 .3680 .9052 16 35.6909 .6753 .8698 Technical knowledge 17 45.5000 .5936 .9023 18 45.0818 .5584 .9082 20 45.8818 .7029 .8970 21 46.4364 .6991 .9000 22 45.5364 .6198 .9017 24 44.8182 .6637 .9106 25 44.8182 .4131 .9023
Office programs and their applica-tions 1 29.0091 .5687 .8789 2 27.0364 .6253 .8764 3 27.2182 .6451 .8724 5 27.6364 .6256 .8704 8 27.3909 .5112 .8895 Classroom applications 30 34.5455 .5522 .9154 31 34.8636 .7417 .9026 32 35.3545 .7586 .9006 34 34.8455 .6521 .9069 35 34.0455 .5964 .9118 36 34.8000 .6474 .9050
Factor Item number Scale mean if item deleted Squared multiple cor-relation Alpha if item deleted
Advance computer use
7 45.5000 .4614 .9016 11 43.8000 .6266 .8963 14 44.4818 .4579 .9048 25 45.8182 .3615 .9094 26 43.8727 .6114 .8946 27 44.6818 .6660 .8945 28 43.6455 .6719 .8940 29 43.9545 .6653 .8937 33 45.3364 .4560 .9068
4. Conclusion and Discussion
This study was conducted to develop a computer self-efficacy scale to evaluate computer self-efficacy beliefs of teachers. 110 pre-service, and 134 in-service teachers participated in the study, and the data collected from that tea-chers constituted the basis of exploratory and confirmatory factor analyses. The statistics indicated that the computer self-efficacy instrument is valid, reliable, and appropriate to assess teachers’ computer self-efficacy beliefs.
The item pool including draft items was prepared via literature, existing computer self-efficacy scales, and opinions of field experts. It was important because teachers’ high computer self-efficacy beliefs may not be observed directly in educational settings. In other words, it is necessary to assess self-efficacy in terms of not only computer use but also technology integration. The specific focus of two dimensional structure constitutes this scale’s distinguished feature. The first dimension is about the use of computer and related technologies, and the second one is about technology integration. The final version of the scale included 36 items under five sub-scales. These sub-scales are;
• Use of Internet and computer for support • Technical knowledge
• Office programs and their applications • Classroom applications
• Advance computer use
Even the names do not reflect technology integration dimension, questions accumulated under each sub-scale inc-ludes technology integration related questions. The Cronbach alpha values showed that there is no need to delete any item to increase the reliability of the subscales and the instrument.
The research was completed with a computer self-efficacy scale assessing teachers’ computer and technology in-tegration self-efficacy beliefs. Both pre- and in-service teachers participated in the study. Data gained from those two groups yielded statistical evidences for the validation of the instrument. In short, it could be inferred that the scale is appropriate to assess both pre and in-service teacher self-efficacy beliefs.
There are some possible areas to use the scale. For example, the scale is able to provide information for technology adaptation studies. Computer self-efficacy has been seen as a variable in almost all technology integration or adap-tation model studies. The constantly changes in the nature of technology and education bring about the changes in models to catch up with. The identifications of the effect of existing curriculum, department, age, and gender on the self-efficacy belief are some examples of possible fields that the instrument can be used. The results of the survey suggest that further studies needed in order to increase validity and reliability of the instrument. Similar study can be conducted with a larger sample size. Finally, this computer self-efficacy instrument should be tested with different target populations, such as pre-service teachers from different universities.
5. References
Akgun, I. H., Akgun, M., & Simsek, N. (2015). Sosyal bilgiler öğretmen adaylarinin eğitimde bilgisayar kullanmaya ilişkin öz yeter-lilik algilarinin incelenmesi. Kastamonu Eğitim Dergisi, 23(2), 711-722.
Akkoyunlu, B., Orhan, F., & Umay, A. (2005). Bilgisayar öğretmenleri için” bilgisayar öğretmenliği öz yeterlik ölçeği” geliştirme çalışması. Hacettepe Üniversitesi Eğitim Fakültesi Dergisi, 29(29).
American Library Association (ALA) (1989). Presidential Committee on Information Literacy. Association of College and Research Libraries. Retrieved from http//www.ala.org/acrl/nili/ilit1st.html on 14 March 2001.
Archambault, L. M., & Barnett, J. H. (2010). Revisiting technological pedagogical content knowledge: Exploring the TPACK fra-mework. Computers & Education, 55(4), 1656-1662.
Arslan, A. (2006). Bilgisayar destekli eğitime ilişkin öz yeterlilik algısı ölçeği. Abant İzzet Baysal Üniversitesi Eğitim Fakültesi Dergisi, 6(1). Bandura, A. (1993). Perceived Self-efficacy in Cognitive Development and Functioning. Educational Psychologist, 28(2), 117-148. Banoglu, K., Vanderlinde, R., & Yildiz, R. (2015). Professional self-efficacy scale for information and computer technology teachers:
validity and reliability study. Anthropologist, 20(1-2), 22-32.
Çakır, R., & Oktay, S (2013), Bilgi Toplumu Olma Yolunda Öğretmenlerin teknoloji Kullanımı. Gazi Üniversitesi Endüstriyel Sanatlar Eğitim Fakültesi Dergisi, 30
Çetin, O., & Güngör, B. (2014). İlköğretim öğretmenlerinin bilgisayar öz-yeterlik inançları ve bilgisayar destekli öğretime yönelik tutumları. Ondokuz Mayıs Üniversitesi Eğitim Fakültesi Dergisi, 33(1), 55-78.
Eastin, M. S., & LaRose, R. (2000). Internet self‐efficacy and the psychology of the digital divide. Journal of Computer‐Mediated Communication, 6(1), 0-0.
Fraenkel, J. R., & Wallen, N. E (2006). How to design and evaluate research in education. New York: McGraw-Hill.
Gil-Flores, J., Rodríguez-Santero, J., & Torres-Gordillo, J. J. (2017). Factors that explain the use of ICT in secondary-education clas-srooms: The role of teacher characteristics and school infrastructure. Computers in Human Behavior, 68, 441-449.
Hair, J. F., Black, W. C, Babin, B. J, Anderson, R. E., & Tatham, R. L., (2006). Multivariate Data Analysis. New Jersey: Pearson Prentice Hall. Hsu, S. (2010). The relationship between teacher’s technology integration ability and usage. Journal of Educational Computing
Research, 43(3), 309-325.
Hu, P. J. H., Clark, T. H., & Ma, W. W. (2003). Examining technology acceptance by school teachers: a longitudinal study. Informa-tion & management, 41(2), 227-241.
Inan, F. A., Lowther, D. L. (2010). Factors affecting technology integration in K-12 classrooms: a path model. Educational Techno-logy Research and Development, 58(2), 137-154.
Karaca, F. (2011). Factors associated with technology integration to elementary school settings: a path model (Doctoral disserta-tion). Middle East Technical University, Ankara, Turkey.
Kim, J. H., Jung, S. Y., & Lee, W. G. (2008). Design of contents for ICT literacy in-service training of teachers in Korea. Computers & Education, 51(4), 1683-1706.
Leow, F. T., Neo, M., & Choon, C. Y. (2014). Study on students’ communication and interaction in collaborative learning processes with web-based social tools. Jurnal teknoloji, 68(2), 19-28.
Markauskaite, L. (2007). Exploring the structure of trainee teachers’ ICT literacy: the main components of, and relationships between, general cognitive and technical capabilities. Educational Technology Research and Development, 55(6), 547-572. Mathews, J. G., & Guarino, A. J. (2000). Predicting teacher computer use: A path analysis. International Journal of Instructional
Media, 27(4), 385.
Moran, M., & Hoy, A. W. (2001). Teacher efficacy: Capturing an elusive construct. Teaching and teacher education, 17(7), 783-805. Murpy, C., Coover, D., Owen, S. (1989) Development and validation of the computer self efficacy scale. Education and
Psychologi-cal Measurement, 49(4), 893-899.
Paily, M. U. (2013). Creating constructivist learning environment: Role of” web 2.0” technology. International Forum of Teaching and Studies (Vol. 9, No. 1, p. 39). American Scholars Press, Inc..
Pallant, J. (2001). SPSS survival manual. Buckingham, UK: Open University.
Robinson, W. I. (2003). External, and internal factors which predict teachers’ computer usage in K-12 classrooms. Detroit, MI: Wayne State University.
Stolle, E. (2008). Teachers, literacy, and technology: Tensions, complexities, conceptualizations, and practice. In 57th yearbook of the National Reading Conference (pp. 56-69). Oak Creek, Wis, USA: National Reading Conference.
Şensoy, Ö. (2004). BDÖ deneyimi olan öğretmenlerin bilgisayar öz-yeterlik algıları ve BDÖ yönteminin yararına ilişkin inançları üzerine bir çalışma (Master’s thesis). Yıldız Teknik Üniversitesi Sosyal Bilimler Enstitüsü, İstanbul.
Tabachnick, B. G., & Fidell, L. S. (2001). Using multivariate statistics. Needham Heights, MA: Allyn and Bacon.
Teo, T., (2009). Modeling technology acceptance in education: A study of preservice teachers. Computers and Education, 52(2), 302-312.
Tinmaz, H. (2004). An Assessment of preservice teachers’ technology perception in relation to their subject area (Masters’ thesis. METU, Ankara, Turkey.
Toker, S. (2004). An Assessment of preservice teacher education program in relation to technology training for future practice: A case of primary school teacher education program, Burdur (Master’s thesis) METU, Ankara, Turkey.
UNESCO (2011). ICT competency framework for teachers. < http://unesdoc.unesco.org/ images/0021/002134/213475e.pdf> (2017, December 25)
Wang, L, Ertmer, L. A. and Newby, T. J (2004). Increasing pre-service teachers self-efficacy beliefs for technology integration. Jour-nal of Reseach on Technology in Education, 36(3), 231-250.
Yalın, H. İ., Karadeniz, Ş., & Şahin, S. (2007). Barriers to information and communication technologies integration into elementary schools in Turkey. Journal of Applied Sciences, 7(24), 4036-4039.
6. Appendix
IT Self Efficacy Survey items
Item No Item
1. How effective can you use spreadsheet programs (ex. MS Excel)? 2. How effective can you use word processor programs (ex. MS Word)? 3. How effective can you use presentation programs (ex. MS PowerPoint)? 4. How effective can you use database programs (ex. MS Access)?
5. Can you prepare course materials with the use of computer? 6. Can you benefit from computers to support your instruction? 7. Can you use new educational software without receiving any help?
8. Can you archive students’ records (attendance, grades, etc.) on the computer environment? 9. Can you benefit from the computer to its maximum whenever the lesson flow is appropriate? 10. Can you make use of discussion platforms (forums, e-mail groups, etc.) for educational purposes? 11. Can you design a web page to use either in class or out of class activities?
12. Can you distinguish the useful information within a group of Internet resources? 13. Can you use search engines (Google, Yahoo, etc.) efficiently?
14. Can you plan technology-based projects or homework effectively? 15. Can you explain properties of a computer’s physical parts?
16. Can you use communication opportunities provided by computer and Internet? 17. Can you use different operating systems (Windows, MacOS, etc…) effectively? 18. Can you give lectures through the effective use of projector?
19. Can you find the source of the computer related problems?
20. Can you use such tools as printer and scanner to prepare your course materials effectively?
21. Can you solve basic problems of printer, scanner, and so forth (such as paper jam, cable connection loss)? 22. Can you connect monitor, keyboard, and mouse to the case without receiving any help?
23. Can you solve technical problems (such as operational problems of computers, projector, or interactive board) faced in the classroom?
24. Can you understand the computer related technical terms (such as formatting, copy-paste)? 25. Can you develop educational applications that will help instruction?
26. Can you benefit from the different features of computers in different situations? 27. Can you follow the educational technology advances in your subject area?
28. Can you make use of visual design methods while preparing materials on computer? 29. Can you distinguish the conditions that are likely to contribute your lessons? 30. Can you help students having trouble with using the computers in your class? 31. Can you guide students during the computer-based activities?
32. Can you guide students about which programs or software to be used during technology-based projects? 33. Can you analyze (such as basic statistical calculations, average, median, frequency) the records of students
(attendance, grades, etc.) on computer environments?
34. Can you benefit enough from the Internet while preparing the course materials? 35. Can you practice the available computer-aided applications defined in the curriculum?