DOI
10.17219/acem/75944
Copyright
© 2018 by Wroclaw Medical University This is an article distributed under the terms of the Creative Commons Attribution Non-Commercial License (http://creativecommons.org/licenses/by-nc-nd/4.0/)
Address for correspondence
Suleyman Serdar Koca E-mail: [email protected] Funding sources None declared Conflict of interest None declared Received on October 28, 2015 Reviewed on December 9, 2015 Accepted on July 18, 2017
Abstract
Background. Adropin, a secreted protein, is encoded by the energy homeostasis-associated gene (ENHO). It is expressed by a variety of tissues and cells. It has been implicated in several physiological and pathological processes, such as angiogenesis and apoptosis.
Objectives. The aim of the present study was to investigate the ENHO gene expression and serum adropin levels in patients with rheumatoid arthritis (RA) and systemic lupus erythematosus (SLE).
Material and methods. The study included 36 patients with RA, 22 patients with SLE and 20 healthy controls (HC). Patients with a disease activity score-28-erythrocyte sedimentation rate (DAS28-ESR) >2.6 in the RA group and an SLE disease activity index (SLEDAI) >6 in the SLE group were accepted as active. Serum adropin levels were analyzed with the enzyme-linked immunosorbent assay (ELISA) method. The ENHO gene and glyceraldehyde 3-phosphate dehydrogenase (GAPDH) gene expressions in peripheral blood mononuclear cells were analyzed with real-time polymerase chain reaction (PCR).
Results. The ENHO gene mRNA expression was significantly higher in the RA group than in the HC group (p = 0.024), although it was similar between the SLE and HC groups (p = 0.920). On the other hand, there were no significant differences among the study groups in terms of serum adropin levels (p > 0.05 for all). Moreover, there was no significant difference in terms of the ENHO expression and serum adropin levels between active and inactive RA and SLE patients.
Conclusions. Although the ENHO gene expression is increased, serum adropin level is not altered in RA. Similarly, adropin seems not to be associated with SLE. However, the potential link between adropin and inflammatory diseases need to be tested in further studies.
Key words: rheumatoid arthritis, systemic lupus erythematosus, adropin, energy homeostasis-associated gene
ENHO gene expression and serum adropin level
in rheumatoid arthritis and systemic lupus erythematosus
Servet Yolbas
1,A,D, Murat Kara
2,C, Mehmet Kalayci
3,C, Ahmet Yildirim
1,B, Baris Gundogdu
1,B, Suleyman Aydin
3,C, Suleyman Serdar Koca
1,A,D–F 1 Department of Rheumatology, Faculty of Medicine, Firat University, Elazig, Turkey2 Department of Medical Genetics, Faculty of Medicine, Mugla Sitki Kocman University, Turkey 3 Department of Biochemistry, Faculty of Medicine, Firat University, Elazig, Turkey
A – research concept and design; B – collection and/or assembly of data; C – data analysis and interpretation; D – writing the article; E – critical revision of the article; F – final approval of the article
Introduction
Rheumatoid arthritis (RA) is a chronic inflamma-tory disease characterized by synovitis and damage to the joints. Its prevalence in the general population is around 1%.1 Although the pathological
immunologi-cal process of the disease is uncertain, many immune cells, such as lymphocytes, macrophages, and leukocytes, and many other molecules, such as cytokines and che-mokines, have been shown to play a role in this process.1
Angiogenesis also plays a prominent role in pannus tis-sue formation in RA.1 It has been shown
that adipocyto-kines in the peptide structure are associated with many signaling pathways and that pro-inflammatory cytokine release is involved in the pathogenesis of RA.2–4
More-over, they may influence disease phenotype and the course of the disease.2–4
Adropin, encoded by the energy homeostasis-associated (ENHO) gene, is a secretory protein playing an active role in energy homeostasis.5 The ENHO gene has been
deter-mined to be expressed in many organs besides endothe-lial cells, such as the liver, the brain, the pancreas, and the kidneys.6,7 Adropin affects the regulation of glucose
and lipid metabolism, energy homeostasis and the modula-tion of insulin sensitivity.5–7
In addition to the metabolic effects, adropin has been shown to have many non-metabolic effect potentials re-lated to angiogenesis, apoptosis and inflammation.5,6,8
Adropin has been demonstrated to have an effect on vas-cular endothelial growth factor receptor (VEGFR), intra-cellular pathways like PI3K-Akt and ERK1/2, and local and systemic mediators like interleukin 6 (IL-6), which are also effective in RA pathogenesis.5,6,9 In addition, while
adropin stimulates the critical stages of angiogenesis, such as proliferation, migration and tube formation, it reduces the apoptosis of endothelial cells and vascular permeabil-ity. Furthermore, adropin therapy has been shown to ame-liorate endothelial function.6
These effects of adropin suggest that it may play an active role in the pathophysiology of inflammatory rheumatic diseases. The aim of this study was to evaluate serum adropin levels and the ENHO gene expression in RA and systemic lupus erythematosus (SLE).
Material and methods
The study included 36 patients with RA, 22 patients with SLE, and 20 healthy controls (HC). The patients fulfilled the established classification criteria.10,11 Participants
un-der the age of 18 years or above the age of 80 years, those with signs of infection, and pregnant women were excluded from the study. The protocol of this study was approved by the institutional Ethics Committee, and all the par-ticipants gave informed consent before being enrolled in the study. Detailed histories of all the participants were
obtained, and systemic and rheumatological examinations were performed. The clinical process and treatments for all participants were also recorded.
Disease activity and/or severity scores were determined by the disease activity score (DAS)-28-erythrocyte sedi-mentation rate (ESR) in the RA group (patients with a DAS28-ESR score >2.6 were considered active); the SLE disease activity index (SLEDAI) and the Systemic Lupus International Collaborating Clinics/American College of Rheumatology damage index (SLICC/ACR) were used in the SLE group (patients with an SLEDAI score >6 were considered active).12–14
Blood samples were drawn from all the participants, af-ter fasting overnight. Erythrocyte sedimentation rate and C-reactive protein (CRP) levels were assessed by the classic Westergren and immunoturbidimetric methods, respec-tively. Routine laboratory evaluations of complete blood count, creatinine and total creatinine kinase levels were assessed in all the participants, using standard laboratory methods. Rheumatoid factor (RF) and anti-cyclic citrul-linated peptide (anti-CCP) antibody levels were analyzed in the RA group, and RF and anti-CCP titers higher than 15 IU/mL were considered positive. In addition, autoanti-body work-ups (antinuclear antiautoanti-body – ANA, anti-double stranded DNA (anti-dsDNA) and anti-Sm antibodies) were studied with standard methods in the SLE group on the same day. Antinuclear antibody was detected by the indirect immunofluorescence antibody (IFA) test. Anti-dsDNA and anti-Sm antibodies were measured by the enzyme-linked immunosorbent assay (ELISA), using suitable commercial kits (Euroimmun, Lübeck, Germany).
Serum adropin levels were analyzed by the ELISA meth-od, using an appropriate commercial kit (Cusabio Biotech Co., Wuhan, China).
Total RNA was prepared from peripheral blood cells by the use of a QIAamp RNA Blood Mini kit (Qiagen, Hilden, Germany). Equal amounts of RNA from these sam-ples were reverse transcribed to cDNA, using a Superscript First-Strand cDNA Synthesis Kit (Invitrogen, San Diego, USA). The mRNA expression of ENHO (Qiagen) was quan-tified and normalized against glyceraldehyde-3-phosphate dehydrogenase (GAPDH). The levels of ENHO and GAPDH were measured by the Rotor-Gene SYBR green-based real-time polymerase chain reaction (PCR), using a real-real-time PCR system (Rotor-Gene Q; Qiagen). Gene expression was determined by the 2-ΔΔCt methodology, normal-ized against the reference gene GAPDH. Changes in gene expression are represented as a fold change relative to 1, where the control equals 1.
Statistical analysis was performed using the Statisti-cal Package for the Social Sciences (SPSS) v. 21.0 (IBM, Chicago, USA). Results were given as mean ± standard deviation (SD). The normal distribution of the variables was evaluated by the Kolmogorov-Smirnov test, and loga-rithmic transformations were performed to normalize data with a skewed distribution before statistical analysis.
Statistical differences among the groups were identified with one-way analysis of variance (ANOVA), followed by Tukey’s post hoc test for parametric data and the Mann-Whitney U test for nonpara-metric data. The χ2 test was done
to com-pare the categorical variables. Correlation analysis was performed using Pearson’s correlation coefficient. Analysis of covari-ance (ANCOVA) was also used to adjust the variables for age, body mass index (BMI) and current drug usage. The p-values <0.05 were considered significant.
Results
The demographic and clinical data of the study group are summarized in Table 1. The mean DAS28-ESR score was 3.1 ±1.6 in the RA group. The mean SLEDAI and SLICC/ACR indices in the SLE group were 11.3 ±10.6 and 1.7 ±1.5, respectively. There were 17 and 13 active patients in the RA and SLE groups, respectively. In the RA group, the mean swollen, tender and deformed joint counts were 2.5 ±4.7, 3.8 ±6.7, and 1.1 ±2.7, respectively, and the mean morn-ing stiffness duration was 60.1 ±76.2 min. In addition, the mean titers of RF and anti-CCP in the RA group were 73.2 ±93.3 U/mL and 363 ±50.8 U/mL, respectively, and 19 and 26 RA patients were positive for RF and anti-CCP, respectively. In the SLE group, anti-dsDNA was 78.8 ±5.3 IU/mL, and 14 and 6 patients were positive for dsDNA and anti-Sm antibody, respectively.
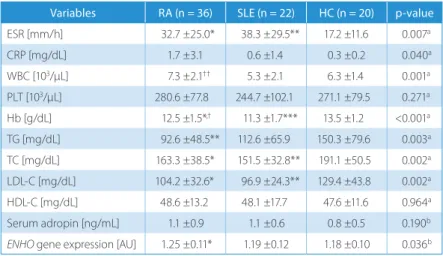
There was no significant difference among the groups in terms of serum adropin level
(p > 0.05 for all). The ENHO gene expression was signifi-cantly higher in the RA group when compared to the HC group (1.25 ±0.11 AU vs 1.18 ±0.10 AU; p = 0.024). There was no significant difference between the HC and SLE groups in terms of the ENHO gene expression (p = 0.921) (Table 2).
There was no significant difference between active and inactive RA groups in terms of serum adropin and the ENHO gene expression levels (p > 0.05 for all, data not shown). There was no significant difference between RA patients using and not using glucocorticoid (GC), metho-trexate, sulfasalazine, hydroxychloroquine (HCQ), and leflunomide in terms of serum adropin levels or the ENHO gene expression. In addition, serum adropin levels and the ENHO gene expression were similar in the patients positive and negative for RF and anti-CCP (p > 0.05). Furthermore, serum adropin levels and the ENHO gene
expression were not significantly correlated with DAS28-ESR, DAS28-ESR, and CRP levels, or RF and anti-CCP titers in the RA group (p > 0.05).
There was no significant difference between the active and inactive SLE subgroups in terms of serum adropin levels and the ENHO gene expression (p > 0.05 for all, data not shown). In the SLE group, there was no significant difference between the patients with and without renal involvement and ANA positivity in terms of serum adropin levels and the ENHO gene expression. Moreover, there was no significant difference between patients using and not using GC, azathioprine and HCQ in terms of serum adro-pin levels or the ENHO gene expression (p > 0.05 for all, data not shown). However, in the SLE group, the ENHO gene expression was negatively correlated with hemoglobin (r = –0.430; p = 0.046) and low-density lipoprotein (LDL) cholesterol levels (r = –0.465; p = 0.029).
Table 1. The demographics in all the study groups
Variables RA (n = 36) SLE (n = 22) HC (n = 20) p-value
Age [years] 49.6 ±15.9††† 31.1 ±8.8** 44.2 ±12.9 <0.001a
Sex (F/M) 8/28 1/21 3/17 0.193b
BMI [kg/m²] 27.4 ±6.2† 23.7 ±4.8 27.1 ±4.8 0.025a
Disease duration [years] 10.6 ±9.4 4.7 ±5.9 – 0.008c
Smoking (n) 3 4 2 0.506b
GC usage (n) 29 18 – 0.821c
GC dose [mg/day]* 4.5 ±3.7 6.0 ±5.2 – 0.261c
Data expressed as mean ± standard deviation (SD). RA – rheumatoid arthritis; SLE – systemic lupus erythematosus; HC – healthy control; F – female; M – male; BMI – body mass index; GC – glucocorticoid. *The dose of glucocorticoid is equivalent to prednisolone. The p-values of a ANOVA, b χ2, and c Student’s t-tests are given. When compared
to the HC group: ** p < 0.01. When compared to the SLE group: † p < 0.05 and †††p < 0.001.
Table 2. Laboratory parameters in all the study groups
Variables RA (n = 36) SLE (n = 22) HC (n = 20) p-value
ESR [mm/h] 32.7 ±25.0* 38.3 ±29.5** 17.2 ±11.6 0.007a CRP [mg/dL] 1.7 ±3.1 0.6 ±1.4 0.3 ±0.2 0.040a WBC [103/µL] 7.3 ±2.1†† 5.3 ±2.1 6.3 ±1.4 0.001a PLT [103/µL] 280.6 ±77.8 244.7 ±102.1 271.1 ±79.5 0.271a Hb [g/dL] 12.5 ±1.5*,† 11.3 ±1.7*** 13.5 ±1.2 <0.001a TG [mg/dL] 92.6 ±48.5** 112.6 ±65.9 150.3 ±79.6 0.003a TC [mg/dL] 163.3 ±38.5* 151.5 ±32.8** 191.1 ±50.5 0.002a LDL-C [mg/dL] 104.2 ±32.6* 96.9 ±24.3** 129.4 ±43.8 0.002a HDL-C [mg/dL] 48.6 ±13.2 48.1 ±17.7 47.6 ±11.6 0.964a Serum adropin [ng/mL] 1.1 ±0.9 1.1 ±0.6 0.8 ±0.5 0.190b
ENHO gene expression [AU] 1.25 ±0.11* 1.19 ±0.12 1.18 ±0.10 0.036b
Data expressed as mean ± standard deviation (SD). RA – rheumatoid arthritis; SLE – systemic lupus erythematosus; HC – healthy controls; ESR – erythrocyte
sedimentation rate; CRP – C-reactive protein; WBC – white blood cell count; PLT – platelet count; Hb – hemoglobin; TG – triglyceride; TC – total cholesterol; LDL-C – low-density lipoprotein cholesterol; HDL-C – high-density lipoprotein cholesterol. The p-values of a ANOVA and b Kruskal-Wallis tests are given. When compared to the HC group: * p < 0.05,
Discussion
The current study evaluated serum adropin levels and the ENHO gene expression in RA and SLE, which are chronic inflammatory diseases. There was no significant difference among the groups in terms of serum adropin levels. However, significantly higher ENHO gene expres-sion was observed in RA. On the other hand, the ENHO gene expression was similar between the SLE and HC groups.
Adropin is a molecule in the structure of the peptide and has been shown to act on many chronic pathological processes. Plasma adropin levels increase in patients with heart failure, characterized by chronic, low-grade inflam-mation.9 Furthermore, plasma adropin level shows
a posi-tive correlation with IL-6.9 On the other hand, Lovren et al.
reported that in vitro adropin administration increased Akt and ERK1/2 phosphorylation.6 Akt was also shown
to interact with several intracellular pathways like GSK3, p21/p27, EDG-1, and FOXO, which were increased as a re-sult of the inflammatory process.6 We found increased
ENHO gene expression in RA, but not in SLE in our study.
Serum adropin levels were not significantly altered in RA and SLE, although they are chronic inflammatory diseases.
Adropin stimulates critical neovascularization process-es, including proliferation, migration and capillary-like tube formation. Lovren et al. reported that in vitro adro-pin administration increased the level of VEGFR2 pro-tein.6 Also, an increase in capillary density was observed
in the adropin-administered group in a mouse hind limp ischemia model.6 Moreover, a low adropin level was shown
to be associated with a decrease in vascular microcircu-lation.15,16 In the present study, high levels of the ENHO
gene expression in the RA group may suggest that adropin could be associated with pannus formation in RA. In con-trast to RA, similar ENHO gene expression between SLE patients and healthy volunteers may be caused by a lack of pannus formation in SLE.
Cardiovascular morbidity and mortality are higher in RA and SLE.17–19 The pathogenesis of increased
athero-sclerosis cannot be explained by common cardiovascular risk factors, such as age, sex, obesity, smoking, hyperlip-idemia, hypertension, and diabetes. Inflammation is one of the important non-conventional reasons of increased cardiovascular risk in these inflammatory diseases. In ad-dition, insulin resistance is one of the most important triggering risk factors in the development and progression of atherosclerotic cardiovascular diseases. Adropin is re-lated to metabolic diseases and atherosclerosis.5 Increased
adipocytes, dyslipidemia, impaired glucose tolerance, and insulin resistance were demonstrated in adropin knock-out mice.20 Conversely, systemic treatment or transgenic
overexpression of adropin were shown to improve obesity, hepatosteatosis and insulin resistance.6,21,22 It were shown
that a low serum adropin level is associated with endo-thelial dysfunction and that this dysfunction improves
with adropin treatment.6,21,22 Increased adropin levels are
expected in RA and SLE due to their inflammatory nature. However, in our study, this level was not higher in RA and SLE. It suggests that the adropin level which is not in-creased may be one cause of the inin-creased metabolic and atherosclerotic complications of RA and SLE.
Liver ENHO gene expression was documented to be affected by changes in one’s energy balance, the content of one’s diet and the presence of obesity.5 While
a short-term diet with a high fat content increases the ENHO gene expression, chronic exposure, through obesity, for exam-ple, decreases its expression.5 Serum adropin level is high
in the case of chow diets and decreases in hunger and di-et-induced obesity. While the adropin level is high when fed with a high-fat and low-carbohydrate diet, the adropin level is lower when fed with a low-fat and high-carbohy-drate diet.20 Additionally, liver ENHO mRNA expression
is regulated by liver X receptors α (LXRα) and peroxisome proliferator activated receptor-γ (PPAR-γ), which is an in-sulin sensitizer, playing a role in cholesterol and triglyc-eride metabolism.5 The nuclear receptor families, LXRα
and PPAR-γ, playing a role in energy homeostasis, were shown to be higher in RA fibroblast-like synoviocytes and synovial fluid. Also, an increase in LXRα and PPAR-γ was demonstrated to be related with a decrease in the ENHO gene expression and the adropin level.5,23–26 Thus, it can
be concluded that one cause of the adropin level that is not increased may be the possible suppressive effect of LXRα and PPAR-γ on adropin production.
Similarly, leptin may suppress adropin production in RA and SLE. A decreased adropin level was observed to be as-sociated with an increased leptin level.5,27 The leptin level
significantly increases RA and SLE.28,29
There are some limitations of this study. Foremost, the sample size is relatively small. The analysis of the ENHO gene expression by peripheral blood mononuclear cells may be another limitation of the present study. It could be analyzed by liver tissue or any affected tissue. Thirdly, another limitation may be that the mean ages of the study groups are significantly different in our study. However, this is difficult to correct, since RA and SLE affect and start at different ages. The differences for data were also analyzed with ANCOVA to adjust.
In conclusion, the ENHO gene expression is increased in RA but not in SLE. However, the adropin level does not change in RA and SLE, which are chronic inflammatory diseases. Consequently, adropin may not be directly related to these diseases. However, further studies are needed to draw a more precise conclusion.
References
1. McInnes IB, Schett G. The pathogenesis of rheumatoid arthritis.
N Engl J Med. 2011;365:2205–2219.
2. Scotece M, Conde J, Gómez R, et al. Beyond fat mass: Exploring the role of adipokines in rheumatic diseases. Sci World J. 2011;11:1932–1947. 3. Krysiak R, Handzlik-Orlik G, Okopien B. The role of adipokines
4. Conde J, Scotece M, López VJ, et al. Adipokines: Novel players in rheu-matic diseases. Discov Med. 2013;15:73–83.
5. Kumar KG, Trevaskis JL, Lam DD, et al. Identification of adropin as a secreted factor linking dietary macronutrient intake with ener-gy homeostasis and lipid metabolism. Cell Metab. 2008;8:468–481. 6. Lovren F, Pan Y, Quan A, et al. Adropin is a novel regulator
of endo-thelial function. Circulation. 2010;122:185–192.
7. Aydin S, Kuloglu T, Aydin S, et al. Expression of adropin in rat brain, cerebellum, kidneys, heart, liver, and pancreas in streptozotocin-induced diabetes. Mol Cell Biochem. 2013;380:73–81.
8. Aydin S, Kuloglu T, Aydin S. Copeptin, adropin and irisin concentra-tions in breast milk and plasma of healthy women and those with gestational diabetes mellitus. Peptides. 2013;47:66–70.
9. Lian W, Gu X, Qin Y, Zheng X. Elevated plasma levels of adropin in heart failure patients. Intern Med. 2011;50:1523–1527.
10. Aletaha D, Neogi T, Silman AJ, et al. 2010 rheumatoid arthritis classi-fication criteria: An American College of Rheumatology/European League Against Rheumatism collaborative initiative. Ann Rheum Dis. 2010;69:1580–1588.
11. Petri M, Orbai AM, Alarcón GS, et al. Derivation and validation of the Systemic Lupus International Collaborating Clinics classifi-cation criteria for systemic lupus erythematosus. Arthritis Rheum. 2012;64:2677–2686.
12. Prevoo ML, van’t Hof MA, Kuper HH, et al. Modified disease activi-ty scores that include twenactivi-ty-eight-joint counts. Development and validation in a prospective longitudinal study of patients with rheu-matoid arthritis. Arthritis Rheum. 1995;38:44–48.
13. Bombardier C, Gladman DD, Urowitz MB, et al. Derivation of the SLEDAI. A disease activity index for lupus patients. The Committee on Prognosis Studies in SLE. Arthritis Rheum. 1992;35:630–640.
14. Gladman D, Ginzler E, Goldsmith C, et al. The development and ini-tial validation of the Systemic Lupus International Collaborating Clin-ics/American College of Rheumatology damage index for systemic lupus erythematosus. Arthritis Rheum. 1996;39:363–369.
15. Ahn J, Kim J. Mechanisms and consequences of inflammatory sig-naling in the myocardium. Curr Hypertens Rep. 2012;14(6):510–516. 16. Celik A, Balin M, Kobat MA, et al. Deficiency of a new protein
asso-ciated with cardiac syndrome X; called adropin. Cardiovasc Ther. 2013;31:174–178.
17. Mason JC, Libby P. Cardiovascular disease in patients with chronic inflammation: Mechanisms underlying premature cardiovascular events in rheumatologic conditions. Eur Heart J. 2015;36(8):482–489c. 18. Ku IA, Imboden JB, Hsue PY, Ganz P. Rheumatoid arthritis: Model of sys-temic inflammation driving atherosclerosis. Circ J. 2009;73:977–985. 19. McMahon M, Skaggs B. Pathogenesis and treatment
of atherosclero-sis in lupus. Rheum Dis Clin North Am. 2014;40(3):475–495. 20. Ganesh Kumar K, Zhang J, Gao S, et al. Adropin deficiency
is associ-ated with increased adiposity and insulin resistance. Obesity (Silver
Spring). 2012;20:1394–1402.
21. Gozal D, Kheirandish-Gozal L, Bhattacharjee R, et al. Circulating adro-pin concentrations in pediatric obstructive sleep apnea: Potential rel-evance to endothelial function. J Pediatr. 2013;163:1122–1126. 22. Topuz M, Celik A, Aslantas T, et al. Plasma adropin levels predict
endo-thelial dysfunction like flow-mediated dilatation in patients with type 2 diabetes mellitus. J Investig Med. 2013;61:1161–1164. 23. Palma A, Sainaghi PP, Amoruso A, et al. Peroxisome
proliferator-acti-vated receptor-gamma expression in monocytes/macrophages from rheumatoid arthritis patients: Relation to disease activity and thera-py efficacy – a pilot study. Rheumatology (Oxford). 2012;51:1942–1952. 24. Zhou JJ, Ma JD, Mo YQ, et al. Down-regulating peroxisome prolifera-tor-activated receptor-gamma coactivator-1beta alleviates the pro-inflammatory effect of rheumatoid arthritis fibroblast-like synovio-cytes through inhibiting extracellular signal-regulated kinase, p38 and nuclear factor-kappa B activation. Arthritis Res Ther. 2014;16:472. https://doi.org/10.1186/s13075-014-0472-6
25. Marder W, Khalatbari S, Myles JD, et al. The peroxisome proliferator activated receptor-γ pioglitazone improves vascular function and decreases disease activity in patients with rheumatoid arthritis.
J Am Heart Assoc. 2013;2:e000441. doi: 10.1161/JAHA.113.000441
26. Laragione T, Gulko PS. Liver X receptor regulates rheumatoid arthritis fibroblast-like synoviocyte invasiveness, matrix metalloproteinase 2 activation, interleukin-6 and CXCL10. Mol Med. 2012;18:1009–1017. 27. Sayin O, Tokgöz Y, Arslan N. Investigation of adropin and leptin levels
in pediatric obesity-related nonalcoholic fatty liver disease. J Pediatr
Endocrinol Metab. 2014;27:479–484.
28. Tian G, Liang JN, Wang ZY, Zhou D. Emerging role of leptin in rheu-matoid arthritis. Clin Exp Immunol. 2014;177(3):557–570.
29. Vadacca M, Zardi EM, Margiotta D, et al. Leptin, adiponectin and vas-cular stiffness parameters in women with systemic lupus erythema-tosus. Intern Emerg Med. 2013;8(8):705–712.