ÇANKAYA UNIVERSITY
GRADUATE SCHOOL OF SOCIAL SCIENCES DEPARTMENT OF ECONOMICS
MASTER’S THESIS
FOREIGN DIRECT INVESTMENT AND ECONOMIC GROWTH IN NIGERIA:
EVIDENCE FROM AUTOREGRESSIVE DISTRIBUTED LAG (ARDL) MODELS
EMMANUEL AGAZIEM OSUJI JUNE 2015
iv ABSTRACT
FOREIGN DIRECT INVESTMENT AND ECONOMIC GROWTH:
EVIDENCE FROM AUTOREGRESSIVE DISTRIBUTED LAG (ARDL) MODELS Emmanuel Agaziem OSUJI
M.Sc Financial Economics Supervisor: Prof. Dr. Ergun DOĞAN
June 2015, 55 Pages
This study investigates the relationship between foreign direct investment (FDI) and economic growth in Nigeria. Bounds testing approach and Autoregressive Distributed Lag (ARDL) model were used in model estimation for the period covering 1981- 2013. The results do not indicate that FDI has an effect on real GDP neither in the long run nor in the short run. Only international trade and population growth have statistically significant effect on real GDP.
Key words: FDI, Nigeria, ARDL
v ÖZET
DOĞRUDAN YABANCI YATIRIMLAR VE NĐJERYANIN EKONOMIK BÜYÜME
ARASINDAKI ILIŞKISI:
AUTOREGRESSIVE DISTRIBUTED LAG (ARDL) MODELLERĐNDEN KANITLAR
Emmanuel Agaziem OSUJI
Finansal Ekonomi Yüksek Lisans Programı Danışman: Prof. Dr. Ergun DOĞAN
Haziran 2015, 55 sayfa
Bu çalışma doğrudan yabancı yatırımlar (DYY) ile ekonomik büyüme arasındaki ilişkiyi Nijerya için incelemektedir. Çalışmada ARDL bounds test yöntemi ve 1981-2013 dönemi zaman serileri
kullanılmıştır. Sonuçlar DYY ile reel GSYĐH arasında kısa ve uzun dönmede bir ilişki olduğunu göstermemiştir. Sadece uluslararası ticaret ve nüfus artışı reel ile GSYĐH arasında istatistiksel olarak anlamlı bir ilişki bulunmuştur.
vi
ACKNOWLEGEMENT
This study wouldn’t have been successful without the support of a number of people who I owe gratitude in measures. I therefore wish to acknowledge my family for their uncommon show of love and the Federal University of Technology Owerri for the opportunity given to me to execute this program as well as the Department of Management Technology for all their support and encouragement.
I also wish to acknowledge my academic advisor and thesis supervisor Prof. Dr. Ergun DOĞAN for always making himself available and for his invaluable comments and criticisms which were both eye-opening and insightful. My gratitude equally goes to Prof. Dr. Mehmet YAZĐCĐ whose cooperation and support made things a lot easier and to my friend Yannick LANGUI for being a friend indeed.
Finally, I am immensely grateful to the Almighty God for the gift of life and to my Lord Jesus Christ for His saving grace.
vii
TABLE OF CONTENTS
STATEMENT OF NON PLAGIARISM ……….iii
ABSTRACT………...iv
ÖZ………...v
ACKNOWLEDGENT………...vi
TABLE OF CONTENTS……… ………..vii
LIST OF TABLES & FIGURES………ix
CHAPTERS 1 INTRODUCTION 1.1 Background and motivation………..………...………….…………1
1.2 Problem statement and significance………..………... 2
1.3 Research objective and hypothesis………...………..2
1.4 Scope and limitations……….3
1.5 Organisation of the report………..3
2 OVERVIEW OF THE NIGERIAN ECONOMY 2.1 Brief history of economic policies in Nigeria……….………...5
2.2 Current structure of the Nigerian economy……….…..6
2.3 Oil and the Nigerian economy……….………..6
2.4 Exports and the Nigerian economy………..…..7
3 REVIEW OF RELATED LITERATURE 3.1 Introduction……….……….9
3.2 Global and regional trends in foreign investments………..…10
viii 4 DATA AND METHODOLOGY
4.1 Theoretical framework………..…...…14
4.2 Description of data ………...14
4.3 Empirical Methodology………...15
4.3.1 Stationarity and unit root test………....17
4.3.2 Bounds test……….………..….17
5 EMRIRICAL RESULTS 5.1 Unit root test……….………...……….20
5.2 ARDL Model………...……… 21
5.3 Diagnostic checks and stability condition………...……….23
5.4 Bounds test……..………..………...24
5.5 Error correction and long run models………...…25
5.6 Sensitivity analysis………27 6 CONCLUSIONS 6.0 Conclusions………...28 BIBLIOGRAPHY………...30 APPENDIX A………....36 CURRICULUM VITEA (C.V)………..…....55
ix
LIST OF TABLES AND FIGURES
Table 4.1 Descriptive Statistics ………..……….15
Table 5.1 Unit root test……….20
Table 5.2 Estimates of ARDL Model………...21
Table 5.3 Diagnostic checks………...22
Figure 1 Plots of the CUSUM and CUSUMSQ Stability tests………...24
Table 5.4 Bounds test………..……….25
1
CHAPTER 1
INTRODUCTION
1.1 Background and motivation
There exists some evidence to suggest that there is a close relationship between the movement of international capital and the rate of economic growth.
The researcher’s source of interest in this topic is based on his observation that the level of economic activity in an economy is greatly influenced among other things, by capital investment which is in turn influenced by foreign capital inflow especially in an
emerging economy like Nigeria.
Nigeria and other sub-saharan African countries have witnessed increases in foreign capital inflows but unemployment seems to be yet untamed. This could probably be because a sizeable amount of these capital inflows come in as portfolio investment which does not necessarily create direct jobs. Additionally we suspect that the direct investmentinflows are not made in sectors with the highest job-creating potential such as agriculture (Akinlo, 2004).
They are mostly directed to the oil and gas sector where return on investment is higher but which requires highly advanced technical skills for which there is a deficit of local manpower. This creates a situation where a significant proportion of manpower for the industry is sourced abroad and the chances for controlling unemployment low. Thus, Foreign Direct Investment (FDI) has not completely benefitted host economies.
Also, it has been observed that the entire corporate profits made by these foreign corporations mainly from China (Nigeria’s largest trading partner), France, Britain, The Netherlands and the United States of America are taken out of the country because such corporations are not listed on the Nigerian Stock Exchange.
2
A considerable amount of research has been done about the relationship between capital flows and GDP but co-integration analysis only constitute a small fraction of these research. It is therefore, not out of place to give further impetus to the study using co-integration analysis.
1.2 Problem statement and significance
It is on record that FDI inflows have not really translated to growth in
developing nations (Makwembere, 2014). This is despite the widely publicized theory linking FDI to economic growth. This is surely a cause for concern for policy makers in government in developing nations where annual FDI flow has been substantial in the past decades. The much needed job creation and technology transfer have been sparsely seen in these countries and Akinlo (2004) observed that a probable reason for this could be that most of the multinational companies bringing in foreign capital tend to direct their operations to the extractive or mining sectors which are usually not the major employers of labour.
Also, the bulk of existing literature about the topic of interest relates to research done in economies where FDI is in the manufacturing sector (Akinlo,2004). It thus seems that not much has been done to investigate this topic for an oil-dependent economy like Nigeria. It is therefore necessary for policy makers to have well tested empirical evidence on this matter as it concerns the researcher’s home country of Nigeria.
1.3 Research objective and hypothesis
The broad objective of our study is to ascertain whether FDI affects economic growth positively or negatively. However, we shall specifically be investigating the nature of long-run relationship between FDI and GDP. The specific hypothesis that we test is.
3
1.4 Scope and limitations
Our study shall commence with determining the nature of long-run relationship between the variables. This means that we shall conduct a test of cointegration and based on the test results, we shall estimate an appropriate model. Further, we shall subject the estimated model to the diagnostic test of serial correlation and test for sensitivity.
The major period of focus for our study is 1981-2013 and the scope shall be extended to explore the effect of international trade and government’s macroeconomic policy on the relationship between FDI and economic growth. Therefore, we shall incorporate inflation and foreign trade as control variables in our model estimation.
This research study was limited by certain constraints which were beyond the control of the researcher. Notable among these is the limited availability of data on labour force and its growth rate which was only available from 1990.
1.5 Organization of the report
The report of this study is presented in six chapters. Chapter one which represents the introduction discusses among other things, the problem statement, research objective and hypotheses to be tested. It also discusses the scope and limitations of the study.
Chapter two discusses an overview of the Nigerian economy with a focus on the history of economic policies and structure of the economy. The researcher deems it necessary to discuss these because it is clear that macroeconomic policies have an influence on the flow of FDI and also affects the extent to which the economy harnesses the benefits of such flow. In addition, it will acquaint a reader not familiar with the Nigerian economy with the knowledge to follow, appreciate and even evaluate the empirical results or major conclusions from the study.
Chapter three looks at the definitions of FDI and economic growth and the trends in global and regional FDI flows. It also discusses the literature behind the study, throwing light into the debate among concerned economists on the impact of FDI on
4
growth. In addition, the chapter specifies the economic model which we intend to test empirically.
In chapter four, we present the data and method of analysis. The chapter simply describes the type of data as well as its source and goes further to explain the method of testing for unit roots, cointegration and estimating the empirical model. It also explains how we intend to test for the various hypotheses and how the diagnostic tests especially serial correlation would be done.
Chapter five will present the results of tests and attempt an analysis of the results based on the specified methodology. The analysis will conclude in the last chapter by making sure that the research objectives have been achieved.
5
CHAPTER 2
OVERVIEW OF THE NIGERIAN ECONOMY
2.1 Brief history of economic policy development in Nigeria
Nigeria has over the years seen the development and implementation of several policies for her economy. From the policy of import substitution in 1960 which like its name suggests, had the objective of substituting importation with local production of goods to the indigenization policy of 1972 and the policy of trade liberalization in 1986 when the Structural Adjustment Program (SAP) was introduced, efforts were made to restructure the economy which was mostly agriculture-based.
During these periods, agriculture was the economy’s main stay, accounting for over 70% of the nation’s Gross Domestic Product, employing a large proportion of the population and providing about 90% of foreign exchange to the government (Fahad, 2014). These policies were frequently abandoned or amended because of their perceived poor performance.
The indigenization policy was meant to among other things, increase the participation of local citizens in the ownership and control of foreign enterprises.
The indigenization policy was later amended by the Nigerian Enterprises Promotion Act 1977 to reflect the realities of the day.
Most recently, the economy has welcomed the birth of the National Economic Empowerment and Development Strategy (NEEDS) in 2003 with objectives which though are similar with that of its predecessors, have job creation and economic diversification as a focal point (Fahad, 2014).
6
2.2 Current structure of the Nigerian economy
It is important to mention the recent rebasing of the economy which revealed significant changes in the structure of the economy over the years. Rebasing an economy involves changing the base year used in GDP computation to a more recent year which reflects the current economic realities.
Following the rebasing exercise last year, Nigeria has seen her economy grow from approximately $270 billion in 1990 to roughly $510 billion in 2014, displacing its South African counterpart to become the largest economy in the entire African
continent and the twenty sixth largest in the world (Oyedele, 2014, Para. 2). This represents a 40.5% growth in the economy over the twenty four-year period.
The modern Nigerian economy enjoys more contribution from the wholesale and retail services, financial services, information and telecommunication services and the entertainment and performing arts industry. These sectors were initially not covered or under-reported in the process of GDP computation (Oyedele, 2014, Para. 2).
2.3 Oil and the Nigerian economy
Nigeria has been the largest producer of oil in Africa and currently ranks as the second largest proven oil reserves holder (behind Libya) on the continent. She also ranks among the top ten countries with the highest proven reserves of oil and gas in the world.
The Nigerian economy has for long been described as an oil economy because of the undeniable significance of oil revenue to the federal government. Though the rebased economy now shows a lower proportion of oil and gas in the estimate of GDP, oil still represents a large part of export revenues (World Bank Economic Report on Nigeria, 2014; 5).
Currently at 35% of GDP, oil accounts for 95% of foreign exchange earnings and 75% of government’s revenue (Geoffrey, 2015, Para. 7). The recent decline in international oil prices has taken a toll on the Nigerian economy. The effects are legion; drop in government revenues, depletion of foreign reserves, increases in inflation rates and interest rates and fall in the value of stock market index to mention a few.
7
Indeed, the pressure on the local currency (the naira) due to import dependency and unfavorable exchange rate movements has made the Central Bank of Nigeria (CBN) to use the foreign reserves to defend the naira – a remedial measure which is hardly sustainable. The reserves currently at $34 billion have lost 20% of its value a year ago. Interest rates have also been jerked up to 13% to defend the local currency which has lost no fewer than 17% of its value in the last six months (Geoffrey, 2015, Para. 8).
The situation calls for diversification of the federal revenue base away from oil and gas and steering the economy away from import dependency to an export-oriented economy. This will reduce the need for the CBN to spend foreign reserve in defense of the local currency as according to the CBN governor Emefiele, “the more we import, the more we deplete reserves” (Geoffrey, 2015, Para. 15 & 16).
Despite the challenges associated with oil dependence, some researchers have found that there is still a positive side to it. According to Igberaese (2013), there actually exists a significant and positive relationship between oil dependence and economic growth in Nigeria.
2.4 Exports and the Nigerian economy
The bulk of Nigeria’s export trade revolves around oil and gas with China, India and Brazil currently ranking as her major trade partners. There is a debate among research scholars about the significance and causality of exports to economic growth in Nigeria. Some have argued that a long-run relationship exists between trade, exports and economic growth while others have an opposing view. In their study,
Edoumiekumo et al (2013), found a significant positive relationship between exports and growth while Ewetan et al (2013) did not find any significant relationship among the variables.
Some studies have also dissected the export component in order to investigate the impact of non-oil exports. Abogan et al (2014) conducted a study on the relationship between non-oil exports and economic growth in Nigeria and found that a significant long-run equilibrium relationship exists between the variables.
8
While our study is not primarily focused on exports but on foreign investments, the insights given by previous research efforts on the nature of relationship between exports and economic growth in Nigeria may come in handy when we begin to build the theoretical model which may incorporate exports as a control variable.
9
CHAPTER 3
REVIEW OF RELATED LITERATURE
3.1 Introduction
Generally, capital tends to flow into economies where profit potential on businesses and investments is high. Foreign capital investment in an economy usually takes the form of direct investment or portfolio investment. Foreign Direct Investments (FDI) are usually long-term investments made in the real sectors of the economy which create direct jobs and usually lead to the transfer of technology to local manpower.
Foreign direct investment could be viewed as investments in real assets such as lands and buildings in a foreign corporation for the purpose of making profits from business. It could also take the form of at least 10% purchase in the equity capital of a local company. Ademola (2013, Para. 7) observed that FDI in Nigeria has traditionally been directed to the oil and gas sectors.
According to Dutse (2008) FDI could be seen as a long-term investment by a foreign corporation representing management interest and control in a local firm which is not in the investor’s country of origin. He also observed that apart from direct
investment of capital to purchase voting stock, it could take the form of mergers and acquisitions or reinvestment of earnings.
It is also necessary having defined foreign direct investment, to also throw some light into the concept of economic growth. Economic growth refers to a sustained increase in the level of economic output or Gross Domestic Product (GDP) of a nation in the long-term (Okoro & Atan, 2013). GDP itself captures the total monetary value of all final goods and services produced within the geographical boundaries of a nation by all economically active individuals whether local or expatriate. It represents a good measure of market size and the level of economic activity in a country.
10
There has been a series of debate among concerned economists about the
implications of increasing FDI inflow for our economy. Some have argued in favor of it because of its positive effect on national output while others have argued against it because of its vulnerability and the negative impact it could have on the economy during periods of external macroeconomic shocks such as the financial crisis of 2008 and the current price war in the international oil market.
3.2 Global and regional trends in foreign investments
According to an OECD 2008 report, FDI has since the mid-nineties been a major source of external financing for developing economies and has generally out-performed Official Development Assistance. Much of the FDI coming into Africa has historically been channeled to Nigeria for reasons not far from the nation’s sheer economic size, large consumer market and her enormous oil and gas resources. In addition, there are large deposits of minerals such as aluminum, zinc, iron ore, limestone, etc and vast areas of arable land for agriculture. Resource rich developing countries in Africa have been known to be among the top FDI destinations (Ramirez, 2000).
Corporations such as Exxon Mobil, Chevron, Shell and Total are among those significantly bringing foreign capital into Nigeria. It is therefore on record that the USA, France, Netherlands and recently China are among the major countries that supply foreign capital to Nigeria and that the bulk of this capital goes into the oil sector (Oji-Okoro & Huang, 2012). Further to this, Akinlo (2004) observed also that much of the inward flowing FDI has been historically directed to the mining sectors of oil and gas.
Also, according to UNCTAD’s Global Investment Trends Monitor (2014), there has been an 8% fall in global FDI flows due to uncertainties occasioned by a lull in the global economy, economic sanctions against Iran and Russia and political unrest in Africa (Libya, Nigeria and Central African Republic) and the middle east (Iraq, Syria and Yemen). The total FDI flow in 2014 was approximately U$D1.26 trillion. While FDI flows to developed economies fell by 14% last year to about U$D 511 billion,
11
developing nations experienced a 4% growth in FDI flows, attracting a little over U$D700billion.
Developing economies currently hold 56% of global FDI flows mainly accounted for by developing Asian economies especially China which at U$D128 billion now receives the largest share of global FDI flows. Also, UNCTAD’s World Investment Report (2014) shows that Africa’s FDI receipt decreased by 3% to about U$D55 billion mainly due to the political situation in Libya and the security situation in Nigeria. The report noted that FDI flows to Nigeria had fallen due to concerns about the security situation and the delay in passing the Petroleum Industry Bill (PIB). It also observed that the bulk of Nigeria’s flow goes into the oil and gas sector. This, notwithstanding, Nigeria still ranks among Africa’s top ten recipient nations.
That FDI boosts a nation’s exports, improves infrastructure, stimulates employment generation and ultimately encourages GDP growth is not in dispute (Jenkins and Thomas, 2012). It is however of more importance to understand how FDI stimulates growth so that growth itself would reflect in development.
3.3 Foreign direct investment and economic growth
Economic literature is replete with research about foreign direct Investment. This is due to its undeniable advantages which include stimulating long term growth and productivity through the transfer of technology which is not available locally and also through the transfer of managerial know how and technical skills to local
manpower. This is because most of the FDI come in as partnership between local firms and multinational corporations on various areas of business operations including research and development. In addition, FDI enhances the process of globalizing world economies and enhancing trade (Ramirez, 2000).
However, it has been argued that the benefits of FDI are not all that there is to it. It seems though that FDI also comes with some demerits such as the reverse cash flow that it generates in the form of repatriation of profits and payment of dividends to parent companies and transfer pricing 2 (Akinlo, 2004). For these reasons, it has been advocated that recipient nations should while trying to reap the benefits of FDI, keep a
12
close watch on the activities of key firms bringing foreign capital into the economy in order to be able to determine at what point its costs outweigh its benefits.
This is especially important when we factor in the concessions made by governments to attract foreign capital (Ramirez, 2000). These concessions include but not limited to assistance to acquire land at little or no cost, waiver of duty on imported capital equipment and sometimes, tax holidays. In any case, whether FDI will positively impact an economy’s growth depends on the quality of the financial environment and degree of preparedness of the receiving nation (Oji-Okoro & Huang, 2012).
It is of interest to this study to analyze the debate about the nature and
significance of long-run relationship which exists between FDI and economic growth. Some researchers have found empirical proof in support of a strong relationship between these variables while others’ findings do not show any evidence of a significant relationship. We take a look at some of the previous research on these variables. Ramirez (2000) investigated the relationship between FDI and growth in his home state of Mexico and found a positive and significant relationship. Also, Jacques (2010) in his study of ten sub-Saharan African nations including Nigeria found a positive long-run relationship among the variables and a bi-directional causality. In addition, Ilemona (2010) conducted a similar study on the Nigerian economy and found a positive, though insignificant effect of FDI on growth. Furthermore, Osinubi etal (2010) not only found long-run relation between FDI and growth but also found a significantly strong positive impact of FDI on growth. Finally, Babalola (2012) found results that are pretty much correlated with those discussed above.
However, some studies have shown a negative relationship between FDI and growth. Alfaro (2003) did a sectoral analysis of the effect of FDI on GDP in a group of countries in Africa, Asia, Europe, North and South America and found that results were inconclusive. Specifically, his results show that FDI and GDP have a negative
relationship in the primary sector of the economy, a positive relationship in the
Manufacturing sector of the economy and no clear-cut relationship in the service sector. This position was also supported by Akinlo (2004) whose study found a
13
Imoudu (2012) found long-run association between FDI and growth in the agric and manufacturing sectors, though, FDI did not positively impact growth in the petroleum sector. In addition, Omoke (2010) did a study and found no long-run association between growth and investments, even though, he found a bi-directional causality between them which was insignificant. Furthermore, Okoro & Atan (2013) in their study found that FDI does not enhance growth in Nigeria. They found a negative relationship which was statistically significant between FDI and growth in Nigeria.
A possible inference from these studies is that though in economic theory, it is believed that FDI positively impacts growth, empirical results show that FDI could sometimes negatively impact growth. This position is supported by the studies of Akinlo (2004), Okoro & Atan (2013), etc. mentioned above and Insah (2013) who found long-run relationship but observed that lagged variables of FDI indeed hindered growth in the Ghanaian economy. We are keen on seeing whether the empirical results from this study will validate this theory or not.
14
CHAPTER 4
DATA AND METHODOLOGY
This chapter describes the theoretical model, the data and the empirical methodology used in the study.
4.1 Theoretical framework
Our study will employ a modified version of the endogenous growth model of Ramirez (2000) who used an augmented Cobb-Douglas production function reproduced below.
Y = A f(L,Kp,E) = ALαKβE(1-α-β)
where Y represents real domestic output, A is the efficiency of production while L,KP and E respectively are labour, private capital stock and the externality from the inflow of foreign capital. Also the sum of α and β is less than one.
This model takes FDI as an integral factor of production and national output. To adopt this model, our study shall consider production as a function of capital and labour but we shall be controlling for the impact of macroeconomic policy and international trade. Thus our theoretical model is specified below.
RGDP = f(FDI, LF,GCF,TRADE)
where the dependent variable is real GDP and, LF,GCF and TRADE represent labour force, gross capital formation, and international trade, respectively.
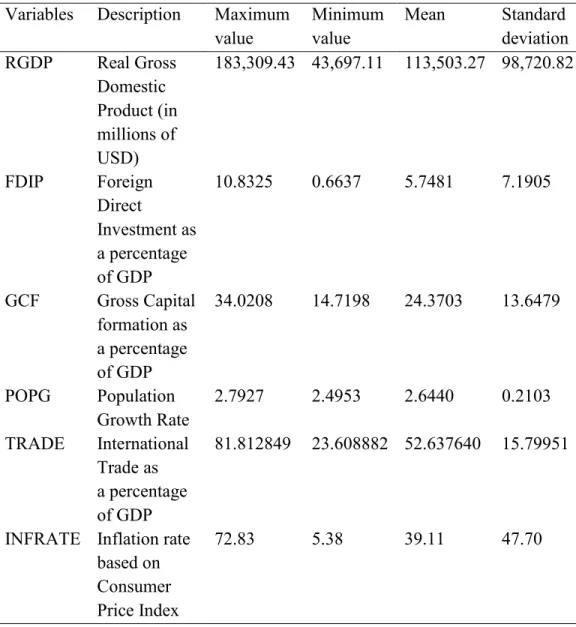
4.2 Description of data
The estimation and analysis of our models were done using secondary time series data on the variables of interest, measured on annual basis. These were obtained from the databases of the World Bank, specifically its development indicators. Table 4.1 gives a summary description of the data set.
15
Table 4.1 Descriptive Statistics Variables Description Maximum
value Minimum value Mean Standard deviation RGDP Real Gross Domestic Product (in millions of USD) 183,309.43 43,697.11 113,503.27 98,720.82 FDIP Foreign Direct Investment as a percentage of GDP 10.8325 0.6637 5.7481 7.1905 GCF Gross Capital formation as a percentage of GDP 34.0208 14.7198 24.3703 13.6479 POPG Population Growth Rate 2.7927 2.4953 2.6440 0.2103 TRADE International Trade as a percentage of GDP 81.812849 23.608882 52.637640 15.79951
INFRATE Inflation rate based on Consumer Price Index
72.83 5.38 39.11 47.70
Period:1981 – 2013. Source: World bank development indicators 2014. 4.3 Empirical methodology
The ARDL bounds testing methodology involves testing for cointegration and deriving the error correction model and the long run coefficients next. We use POPG, and natural logarithms of RGDP, FDIP, GCF, TRADE (LRGDP, LFDIP, LGCF, LTRADE, respectively) in our model. Hence our test equation is:
16
where and are intercept and random error term respectively, while is the first difference operator. The short-run relationships are measured by δ, γ, , θ, and ρ, while long-run relationships are measured by µs.
While there are no standard rules for selecting the number of lags, it is recommended that researchers select the number of lags that minimizes an information criterion (Brooks, 2008). Consequent upon this, our study will rely on the Akaike Information Criterion (AIC) for general lag selection.
To use the model for further analysis, the diagnostic checks for serial
correlation, heteroscedasticity, functional misspecification, and normality of residuals must be done. We shall employ the Breusch-Godfrey test to investigate serial
correlation, the Jarque-Berra test for normality, Ramsey’s RESET test of functional misspecification, and the Breusch-Pagan-Godfrey test for heteroscedasticity. In
addition, we shall do a stability test for the model using the cumulative sum of squares (CUSUMSQ) method and test for sensitivity of the estimates.
The following null and alternative hypotheses are used to do bounds testing for cointegration:
: = = = = = 0
: ≠0, ≠0, ≠0, ≠0, ≠0,
Null hypothesis indicates the absence of a long-run relationship. The test computes an F-statistic in order to examine the significance of the lagged values of variables in an unrestricted error correction regression (Pesaran, Shin and Smith, 1999).
17
It also computes two asymptotic critical values, the lower bound and the upper bound. The lower bound critical value is based on the assumption that all the causal variables are I(0) while the upper bound critical value assumes that all the regressors are I(1).The null hypothesis of no long-run relationship between the levels of the variables is rejected if the F-statistic is greater than the critical value at upper bound indicating that a long-run relationship exists. On the other hand, the null would not be rejected if the F- statistic is less than the critical value at lower bound, meaning that no long-run relationship exists. If however, this statistic falls between both bounds, the test becomes inconclusive and we will need more information about the order of integration of each of the variables before reliable inferences can be done (Pesaran, Shin and Smith, 1999).
In the second step, long-run and short-run models implied by equation 4.1 are expressed in equations 4.2 and 4.3, respectively:
The error correction term, captures the short-run dynamics. 4.3.1 Stationarity and unit root test
Our analysis focuses on investigating the nature of long-run relationship among the variables of interest. To achieve this, our study uses the bounds testing approach to cointegration. Before doing the bounds test, it is necessary to ensure that none of the
18
variables has an order of cointegration greater than one. We shall do this by testing for a unit root.
Stationarity implies that a series has a constant mean, constant variance and constant auto covariance structure at any given lag. One important characteristic of a stationary series is that the effect of shocks to the system at current time is always smaller compared to that in the previous time. In effect, shocks gradually die away with the passage of time and the system returns to equilibrium (Brooks, 2008).
This property is highly desirable in econometric analyses and the
non-stationarity being discussed here is said to be stochastic because of the presence of a stochastic trend in the data and is mathematically represented below.
yt = μ+yt-1+ut
Applying first differencing, produces a new stationary series having a difference operator.
yt - yt-1 = μ+ut
(1- L)yt = μ+ut Δ yt = μ+ut
The variable Δ yt is the result of differencing and the process is described as a unit root process where the characteristic polynomial (1- Z) = 0, will always be one.
A series stationary at level form is said to be I(0) while stationarity after first differencing is described as I(1).
In our analysis, we ascertain the order of integration by conducting the unit root test which is a standard test of hypothesis using the Augmented Dickey-Fuller (ADF) technique whose test statistic is given below.
where the numerator represents the coefficient of the regression Δ yt = ψ yt-1 +ut and the denominator is its standard error.
The null hypothesis here is that the series under examination has a unit root, and rejecting this hypothesis means that no unit root exists. The null can be rejected or
19
accepted by comparing the ADF test statistic with the critical value at the specified significance level, which in our case is five percent.
20
CHAPTER 5
EMPIRICAL RESULTS
In this chapter, we present the results of the various analyses that were done using the data set and the methods described in the penultimate chapter. The analysis was done in two stages: The first stage involved testing for unit root and determining the order of integration of the various series, while the second stage involved bounds testing and ARDL estimation.
5.1 Unit root tests
We conducted the tests for unit root using the Augmented Dickey Fuller (ADF) method together with Akaike information criterion (AIC). We can reject the null hypothesis of a unit root by comparing the ADF statistic with the critical values.
Specifically, when the test statistic is more negative than the critical value, we reject the null hypothesis, otherwise, we accept it. The following series were tested for unit root: LRGDP, LFDIP, LGCF, POPG, and LTRADE. Test results are presented in Table 5.1. Table 5.1 Unit Root Tests (Sample Period 1981-2013)
Panel (A): ADF test for unit root with constant only.
Variable level first difference 5% critical value 1% critical value Integrating Order LRGDP 1.725328 -4.187769 -2.957110 -3.653730 I(1) LFDIP -2.990305 -9.694957 -2.957110 -3.653730 I(0) LGCF -2.906268 -5.527109 -2.957110 -3.653730 I(1) POPG -3.635279 -2.206690 -2.991878 -3.737853 I(0)
21
Panel (B): ADF test for unit root with constant and trend.
Variable level first difference 5% critical value 1% critical value Integrating Order LRGDP -1.777469 -4.912070 -3.557759 -4.273277 I(1)
LFDIP -2.740934 -10.20693 -3.557759 -4.273277 I(1) LGCF -2.210605 -6.649471 -3.557759 -4.273277 I(1)
POPG -3.774076 -0.266884 -3.612199 -4.394309 I(0) LTRADE -0.102788 -5.335296 -3.603202 -4.374307 I(1)_____
Note: H0: Series has a unit root. The critical values reported are based on level tests. Critical values based
on first differences are not significantly different from those of the level test and the overall test results are essentially the same.
Panel A in Table 5.1 shows the results of ADF test with constant only. The results show that all the variables, except FDIP and POPG, are integrated of order one, I(1). The population growth rate (POPG) is integrated of order zero or I(0) since when levels are used unit root hypothesis is rejected. Panel B in Table 5.1 shows the results of ADF test with constant and trend, and support the results reported in the upper panel (with only a constant included in the model). Since, none of the variables are I(2) the bounds testing approach can be used to check for cointegration.
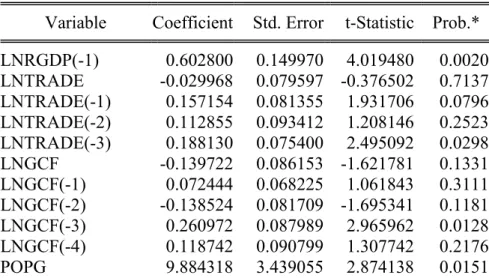
5.2 ARDL model
We estimate equation 4.1 next. An ARDL (1, 3, 4, 4, 1) model was selected by using Akaike information criterion (AIC) out of 2500 models evaluated. The estimates are reported in Table 5.2.
Table 5.2 Estimates of the ARDL Model
Variable Coefficient Std. Error t-Statistic Prob.* LNRGDP(-1) 0.602800 0.149970 4.019480 0.0020 LNTRADE -0.029968 0.079597 -0.376502 0.7137 LNTRADE(-1) 0.157154 0.081355 1.931706 0.0796 LNTRADE(-2) 0.112855 0.093412 1.208146 0.2523 LNTRADE(-3) 0.188130 0.075400 2.495092 0.0298 LNGCF -0.139722 0.086153 -1.621781 0.1331 LNGCF(-1) 0.072444 0.068225 1.061843 0.3111 LNGCF(-2) -0.138524 0.081709 -1.695341 0.1181 LNGCF(-3) 0.260972 0.087989 2.965962 0.0128 LNGCF(-4) 0.118742 0.090799 1.307742 0.2176 POPG 9.884318 3.439055 2.874138 0.0151
22 POPG(-1) -14.05413 9.730391 -1.444355 0.1765 POPG(-2) 2.708002 12.48495 0.216901 0.8323 POPG(-3) 8.941713 9.390040 0.952255 0.3614 POPG(-4) -6.126740 3.685377 -1.662446 0.1246 LNFDIP -0.005379 0.019638 -0.273891 0.7892 LNFDIP(-1) -0.023236 0.020915 -1.110980 0.2903 C 4.391658 1.079789 4.067144 0.0019
R-squared 0.997439 Mean dependent var 25.10121 Adjusted R-squared 0.993481 S.D. dependent var 0.456292 S.E. of regression 0.036842 Akaike info criterion -3.492377 Sum squared resid 0.014931 Schwarz criterion -2.643711 Log likelihood 68.63947 Hannan-Quinn criter. -3.226585 F-statistic 251.9968 Durbin-Watson stat 2.169580 Prob(F-statistic) 0.000000
Notes: *p-values and any subsequent tests do not account for model selection. Dependent Variable: LNRGDP
Method: ARDL
Sample (adjusted): 1985 2013
Included observations: 29 after adjustments Maximum dependent lags: 4 (Automatic selection) Model selection method: Akaike info criterion (AIC) Dynamic regressors (4 lags, automatic): LNTRADE LNGCF POPG LNFDIP
Fixed regressors: C
Number of models evalulated: 2500 Selected Model: ARDL(1, 3, 4, 4, 1)
Before the model can be used to calculate the long run coefficients and to derive the error correction model, diagnostic checks must be done. This is also the first step for bounds testing. Lack of serial correction is especially important. We summarize the results in Table 5.3.
Table 5.3 Diagnostic Tests
Test Statistics LM Version
A:Serial Correlation CHSQ(1) = 0.64664 [0.421]
B:Functional Form CHSQ(1) = 1.0102 [0.315]
C:Normality CHSQ(2) = 0.088069 [0.957]
D:Heteroscedasticity CHSQ(1) = 0.63947 [0.424]
Notes: p-values are in brackets. Test results were obtained by using Microfit. ARDL(1, 3, 4, 4, 1) selected based on Akaike Information Criterion. Dependent variable is LRGDP. 29 observations used for estimation from 1985 to 2013. A:Lagrange multiplier test of residual serial correlation
23
B:Ramsey's RESET test using the square of the fitted values C:Based on a test of skewness and kurtosis of residuals D:Based on the regression of squared residuals on squared fitted values
Diagnostic test results show that we cannot reject the null hypothesis in all cases. This means that our model is free from serial correlation, heteroscedasticity, and normality problems. In addition, RESET test shows that the model is not misspecified. 5.3 Stability condition
Cumulative sum (CUSUM) and cumulative sum of squares (CUSUMSQ) methods are used to check the stability conditions. The null hypothesis of all coefficients are stable cannot be rejected if the two plots of the CUSUM and CUSUMSQ remain within the critical bounds of a 5% significance level, which is the case here.
24
Figure 5.1 Plots of the CUSUM and CUSUMSQ Stability tests (obtained by using
Microfit)
5.4 Bounds test
The test results are summarized in the Table 5.4.We can reject the null
hypothesis by comparing the F-statistic with the critical value at 5%. Thus, we reject the null hypothesis of no long-run relationships exist if the value of the F-statistic is greater than the upper bound critical value. With an F-statistic of 4.335115 and a five percent upper bound of 4.01, we reject the null hypothesis and conclude that a long-run cointegrating relationship exists between LRGDP and all the other regressors.
Plot of Cumulative Sum of Recursive Residuals
The straight lines represent critical bounds at 5% significance level
-2 -4 -6 -8 -10 0 2 4 6 8 10 1985 1990 1995 2000 2005 2010 2013
Plot of Cumulative Sum of Squares of Recursive Residuals
The straight lines represent critical bounds at 5% significance level -0.5 0.0 0.5 1.0 1.5 1985 1990 1995 2000 2005 2010 2013
25
Table 5.4 ARDL Bounds Test Sample: 1985 2013
Included observations: 29
Null Hypothesis: No long-run relationships exist Test Statistic Value k
F-statistic 4.335115 4 Critical Value Bounds
Significance I0 Bound I1 Bound
10% 2.45 3.52
5% 2.86 4.01
2.5% 3.25 4.49
1% 3.74 5.06
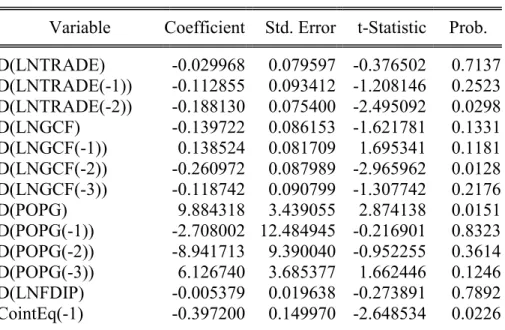
5.5 Error correction models and the long run coefficients
In this section we present and discuss the features of our model in the short and long run. The error correction model (ECM) is responsible for restoring the model to equilibrium following any shock to at least one of the independent variables. This model usually has an error correction term (ECT) which shows the speed of adjustment in the short run. The ECT should be negative and statistically significant for a reliable model. If the ECT is positive, it means that the model is explosive because the error correction model does not bring the model to long run equilibrium following any shocks in the short run. Another major property of a good ECM which is less highlighted is that its ECT should have an absolute numerical value which lies between one and zero. The error correction model and the long run coefficients are presented in Table 5.5.
26
Table 5. 5 ARDL Cointegrating and Long Run Form Dependent Variable: LNRGDP
Selected Model: ARDL(1, 3, 4, 4, 1) Sample: 1981 2013
Included observations: 29
Cointegrating Form
Variable Coefficient Std. Error t-Statistic Prob. D(LNTRADE) -0.029968 0.079597 -0.376502 0.7137 D(LNTRADE(-1)) -0.112855 0.093412 -1.208146 0.2523 D(LNTRADE(-2)) -0.188130 0.075400 -2.495092 0.0298 D(LNGCF) -0.139722 0.086153 -1.621781 0.1331 D(LNGCF(-1)) 0.138524 0.081709 1.695341 0.1181 D(LNGCF(-2)) -0.260972 0.087989 -2.965962 0.0128 D(LNGCF(-3)) -0.118742 0.090799 -1.307742 0.2176 D(POPG) 9.884318 3.439055 2.874138 0.0151 D(POPG(-1)) -2.708002 12.484945 -0.216901 0.8323 D(POPG(-2)) -8.941713 9.390040 -0.952255 0.3614 D(POPG(-3)) 6.126740 3.685377 1.662446 0.1246 D(LNFDIP) -0.005379 0.019638 -0.273891 0.7892 CointEq(-1) -0.397200 0.149970 -2.648534 0.0226 Cointeq = LNRGDP - (1.0780*LNTRADE + 0.4378*LNGCF + 3.4067*POPG -0.0720*LNFDIP + 11.0565 )
Long Run Coefficients
Variable Coefficient Std. Error t-Statistic Prob.
LNTRADE 1.077972 0.346786 3.108469 0.0100
LNGCF 0.437845 0.551839 0.793429 0.4443
POPG 3.406745 1.660470 2.051675 0.0648
LNFDIP -0.072042 0.060829 -1.184326 0.2612
C 11.056545 3.764479 2.937071 0.0135
Error correction model is in the upper panel of Table 5.5. Changes in LTRADE (DLNTRADE(-2)), LGCF (D(LNGCF(-2))) and POPG (D(POPG)) are the only
variables that are statistically significant in the short-run. Error correction model reports a negative error correction coefficient (coefficient of lagged CointEq), which is
27
statistically significant. The model shows that approximately 39.7 percent of error is corrected per year in the short run.
To analyze what happens in the long run, long run coefficients presented in the bottom panel of Table 5.5 is used. The results show that in the long run, FDIP and GCF do not have an impact on real GDP. Only, TRADE and POPG have a statistically significant effect on real GDP. One percent increase in TRADE increases RGDP by approximately 1%, and one percentage point increase in POPG increase RGDP by 3.41 percent.
5.6 Sensitivity analysis
We included a linear trend in our model. Cointegration was established and the trend coefficient was positive but insignificant at %5. On the flipside, the model suffered from serial correlation problem.
Next, we try to analyze how our model behaves with different control variables or without them. We first tried replacing LNTRADE with another control variable, which is the inflation rate. When modeled with inflation rate cointegration was found, but residuals were serially correlated. When we repeated everything with a linear trend there was no cointegration.
Finally, we tried the model without any control variable. With only a constant included there was no cointegration but we found cointegration when a linear trend was included. Estimated ARDL model passed all diagnostic tests but the lagged error correction term, even though negative and significant, was greater than 1 in absolute value.
28
CHAPTER 6 CONCLUSIONS
We begin this section by considering the main findings of our study. In this study we considered the relationship between FDI and economic growth in Nigeria using the bounds testing and ARDL methods, and annual data obtained from the World Bank.
Findings from our analysis show that in the long run, foreign direct investment (FDI) and gross capital formation do not affect real GDP. Only, the trade ratio (total trade as a percentage of GDP) and the population growth rate have a statistically significant effect on real GDP. The same is true in the short run.
It is not encouraging to realize that FDI does not have a significant impact on growth in Africa’s largest economy especially when we consider the fact that Nigeria ranks among the top three FDI destinations in Africa. This negative development definitely has policy implications and an understanding of the probable reasons for it could be the basis for the formulation of strategic plans meant to turn things around. Our findings are not significantly different from those of Akinlo (2004) who also found no statistically significant impact of FDI on economic growth in Nigeria. What is even a bigger cause for concern is that after almost a decade since Akinlo’s (2004) study, the nation is yet to feel the impact of foreign investment.
We believe that one reason for this trend is that the bulk of foreign investment flows is in the highly lucrative oil and gas sector which unfortunately is neither a major employer of labour nor integrated into the major economy. Another reason for this is probably that the minimum level of human capital stock required to harness the benefits of foreign investment as argued by Borensztein et al (1997) is not available in the country.
29
To stem the tide and ultimately change the status quo, we are of the view that first, the government needs to use policy incentives to encourage FDI to the nation’s agricultural and manufacturing sectors which are still largely underdeveloped. This is because these two sectors to a great extent represent the real economy where the potential for job creation is high. The importance of FDI to the development of these sectors lies in the fact that it provides not only the capital but also the technology and development of human capital required to transform the real economic sectors. Secondly, the government needs to review policies on education and the training of human resource. Emphasis should be placed on acquiring technical and entrepreneurial skills which are not only relevant for employment and job creation but also transferable.
30
BIBLIOGRAPHY
Abogan, O., Akinola, E. and Baruwa, O. (2014). Non-oil export and Economic Growth in Nigeria. Journal of Research in Economics and International Finance. Vol 3(1).
Pp1-11. Retrieved March 10, 2015 from http://www.interesjournals.org/full-articles/non-oil-export-and-economic-growth-in-nigeria1980-2011.pdf?view=inline
Ademola, A. (2013). Foreign Direct Investment in Nigeria tops $6.8bn Retrieved April 9, 2015 from http://www.punchng.com/business/money/foreign-direct-investment-in-nigeria-tops-6-8bn/
Adesoji, A. and Sotubo, O. (2013). Non-Oil Exports in the Economic Growth of Nigeria: A Study of Agricultural and Mineral Resources. Journal of Educational and
Social Research Vol. 3 (2).
Akinlo, A. and Akinlo, O. (2009). Stock market development and economic growth: Evidence from seven sub-Sahara African countries. Journal of Economics and Business
61 (2009) 162–17.
Akinlo, E. (2004). Foreign Direct Investment and growth in Nigeria. An Empirical Investigation. Journal of Policy Modeling. 26; 627–639.
Alfaro, L. (2003). Foreign Direct Investment and Growth: Does the Sector Matter?
Harvard Business School Review. Retrieved April 9, 2015 from
http://www.people.hbs.edu/lalfaro/fdisectorial.pdf
Amoro, G. and Shen, Y. (2013). The Determinants of Agricultural Export: Cocoa and Rubber in Cote d’Ivoire. International Journal of Economics and Finance; Vol. 5, No.
1.
Ani, W., Ugwunta, D., Inyiama, O. and Ike-Ekweremadu, N. (2014). Oil price volatility and economic development: Stylized evidence in Nigeria. Journal of
Economics and International Finance Vol. 6(6), pp 125-133.
Antwi, S., Mills, E., Mills, G. and Zhao, X. (2013). Impact of foreign direct investment on economic growth: Empirical evidence from Ghana. International Journal of Academic Research in Accounting, Finance and Management Sciences Vol. 3, No.1, January, pp. 18–25.
31
Ayadi, S. and Ayadi, O. (2008). The impact of external debt on economic growth: A comparative study of Nigeria and South Africa. Journal of Sustainable Development in
Africa Vol 10, No.3.
Babalola, S., Dogon-daji, S. and Saka, J. (2012). Exports, Foreign Direct Investment and Economic Growth: An Empirical Application for Nigeria. International Journal of
Economics and Finance Vol. 4, No. 4.
Borensztein, E., Gregorio, J. and Lee, W. (1997). How does foreign direct investment affect economic growth? Journal of International economics (45), pp115-135.
Brooks, C (2008). Introductory Econometrics for Finance, Cambridge University Press. Dutse, A. (2008). Nigeria’s Economic Growth: Emphasizing the Role of Foreign Direct Investment in Transfer of Technology. Communications of the IBIMA Volume 3. Edoumiekumo, S. (2013). Economic growth factor in Nigeria; The Role of Global Trade. American Journal of Humanities and Social Sciences Vol 1(2). pp51-55. Esfahani, S., Mohaddes, H. and Pesaran, M. (2012). An Empirical Growth Model for Major Oil Exporters. CESIFO working paper NO. 3780. Growth In Nigeria. Asian
Transactions on Basic and Applied Sciences
Ewetan, O. and Okodua, H. (2013) Econometric Analysis of Exports and Economic growth in Nigeria. Retrieved March 16, 2015 from
http://eprints.covenantuniversity.edu.ng/2319/1/2054_Olabanji_Olukayode_Henry_Oko dua.pdf
Fahad, A (May 2014). Trade Openness and Industrial Performance in Nigeria:
Evidence from ARDL. An unpublished M.Sc Thesis
Geoffrey, Y. (2015, Feb). Nigeria’s oil dependent economy plagued by plunging crude prices. Retrieved April 7, 2015 from http://www.theglobeandmail.com/report-on- business/international-business/nigerias-capital-feels-the-pinch-from-the-plunge-in-oil-prices/article22847527/
Global Investment Trends Monitor No: 18 (2015). United Nations Conference on Trade
and Development.
32
Igberaese, T. (2013, December). The Effect of Oil dependency on Nigeria’s Economic Growth. Retrieved March 24, 2015 from
https://scholar.google.com.tr/scholar?q=+The+Effect+of+Oil+Dependency+on+Nige ria%E2%80%99s+Economic+Growth&hl=en&as_sdt=0,5
Ilemona, A. (2010). Accelerating Economic Growth in Nigeria, The Role of Foreign Direct Investment. Current Research Journal of Economic Theory 2(1): 11-15.
Imoudu, E. C. (2012). The Impact of Foreign Direct Investment on Nigeria’s Economic Growth; 1980-2009: Evidence from the Johansen’s Cointegration Approach.
International Journal of Business and Social Science. Vol. 3 No. 6.
Insah, B. (2013). Foreign Direct Investment Inflows and Economic Growth in Ghana.
International Journal of Economic Practices and Theories, Vol. 3, No. 2.
Jacques, E. (2010). Long-Run Relationship and Causality between Foreign Direct Investment and Growth: Evidence from Ten African Countries. International Journal of
Economics and Finance Vol. 2, No. 2.
Jenkins, C. and Thomas, L. (2002), “Foreign Direct Investment in Southern Africa: Determinants, Characteristics and Implications for Economic Growth and Poverty Alleviation”, Final Report, October. Retrieved April 9, 2015 from
http://proshareng.com/news/24863
Makwembere, S (Nov 2014). The Impact of Sector Foreign Direct Investment on
Economic Growth in Developing Countries. An unpublished M.Sc Thesis.
Masoud, M., Kaliappan, R., Ismail, W. and Azman-Saini, N. (2014).Impact of Foreign Aid and Foreign Direct Investment on Economic Growth: Evidence from Sub-Saharan African Countries. Jurnal Ekonomi Malaysia 48(1), 63 – 73.
Mehrara, M., Haghnejad, A., Dehnavi, J. and Meybodi, F. (2014). Dynamic Causal Relationships among GDP, Exports, and Foreign Direct Investment in Developing Countries. International Letters of Social and Humanistic Sciences Vol (3) pp 1-19. Muritala, T., Taiwo, A. and Olowookere, D.(2012). Crude Oil Price, Stock Price and Some Selected Macroeconomic Indicators: Implications on the Growth of Nigeria Economy. Research Journal of Finance and Accounting Vol 3, No 2.
33
Nurudeen, A. (2009). Does Stock Market Development Raise Economic Growth? Evidence from Nigeria. The Review of Finance and Banking.
Nyarko, P., Nketiah-Amponsah, E. and Barnor, C. (2011). Effects of Exchange Rate Regimes on FDI Inflows in Ghana. International Journal of Economics and Finance
Vol. 3, No. 3.
Odularu, G. O. (2008). Crude oil and the Nigerian economic performance. Oil and Gas
Business Journal Vol 1.
Ogbole, O., Amadi, N. and Essi, D. (2011). Fiscal policy: Its impact on economic growth in Nigeria 1970 to 2006. Journal of Economics and International Finance Vol.
3(6), pp. 407-417
Ogbonna, I, and Uwajumogu, R. (2012). Economic Growth and Foreign Direct Investment in Nigeria: An Empirical Investigation. Journal of Economics and
Sustainable Development Vol.3, No.13
Ogunmuyiwa, S. (2011). Does External Debt Promote Economic Growth in Nigeria?
Current Research Journal of Economic Theory 3(1): 29-35
Oji-Okoro, I. and Huang, H. (2012). An Empirical Analysis on the Contribution of Foreign Direct Investment on Nigeria Economy. Proceedings of the 8th International
Conference on Innovation & Management.
Okoro, H. and Atan, A. J. (2013). Foreign Direct Investment, Export and Economic Growth in Nigeria: A Re-evaluation. Current Research Journal of Economic Theory
5(4): 82-91, 2013.
Oladipo, O. and Fabayo, J. (2006), Global Recession, Oil Sector and Economic Growth in Nigeria. Asian Transactions on Basic and Applied Sciences Volume 01, pp
2221-2267.
Olayiwola, K. and Okodua, H. (2013). Foreign Direct Investment, Non-Oil Exports, and Economic Growth in Nigeria: A Causality Analysis. Asian Economic and Financial
Review 3(11):1479-1496.
Omoke, P. (2010). The Estimation of Long-run Relationship between Economic Growth, Investment and Export in Nigeria. International Journal of Business and
34
Osinubi, S. and Amaghionyeodiwe, L. (2010). Foreign Private Investment and Economic Growth in Nigeria. Applied Econometrics and International Development
Vol. 10-2.
Oteng-Abaiye, .F. and Frimpong, J. (2006). Bounds Testing Approach to Cointegration: An Examination of Foreign Direct Investment Trade and Growth Relationships.
American Journal of Applied Sciences 3 (11): 2079-2085.
Oyatoye, A., Arogundade, K., Adebisi, S. and Oluwakayode, F (2011). Foreign Direct Investment, Export and Economic Growth in Nigeria. European Journal of Humanities
and Social Sciences Vol. 2, No.1.
Oyedele, T. (2014, May). Gross Domestic Product: Does size really matter? Retrieved April 7, 2015 from http://www.pwc.com/ng/en/publications/gross-domestic-product-does-size-really-matter.jhtml
Pesaran, H., Shin, Y. and Smith, J. (2001), Bounds testing approaches to the analysis of level relationships. Journal of applied econometrics, 16(3), 289-326
Ramirez, M. (2000). Foreign direct investment in Mexico: A cointegration analysis. The
journal of development studies, Vol. 37, No 1, Oct, pp 138- 162.
Sackey, F., Compah-Keyeke, G. and Nsoah, J. (2012). Foreign Direct Investment and Economic Growth in Ghana. Journal of Economics and Sustainable Development Vol.3,
No.10.
Shaari, B., Hong, T. and Shukeri, N. (2012). Foreign Direct Investment and Economic Growth: Evidence from Malaysia. International Business Research; Vol. 5, No. 10. Solarin, A. and Shahbaz, M. (2015). Natural gas consumption and economic growth: The role of foreign direct investment, capital formation and trade openness in Malaysia.
Renewable and Sustainable Energy Reviews Vol. 42 pp.835–845.
Udoh, E. and Udeaja, A. (2011), Ten years of industrial policies under democratic governance in Nigeria:“New wine in old bottle”. European Journal of Social Sciences,
20(2), 248-258.
World Bank Development Indicators (2014). World Bank.
World Bank Economic Report on Nigeria (2014). Retrieved April 7, 2015 from
https://openknowledge.worldbank.org/bitstream/handle/10986/19980/896300WP0Niger 0Box0385289B00PUBLIC0.pdf?sequence=1
35
World Investment Report (2014). United Nations Conference on Trade and
Development.
Yusuf, M. (2015). An Analysis of the impact of oil price shocks on the growth of the Nigerian economy. African Journal of Business Management Vol 9(3), pp103-115. Zenegnaw, A. (2010). Impact of Foreign Direct Investment on Trade of African Countries. International Journal of Economics and Finance Vol. 2, No. 3 .
36
APPENDIX
SUMMARY OF RESEARCH PAPERS CONSULTED
AUTHOR VARIABLES PERIOD/
FREQUENCY
METHOD RESULTS & CONCLUSIONS Babalola,
Dogon-daji & Saka (2012)
Key: Real Exports, FDI & Real GDP. Control: Degree of openness, Gross Fixed Capital Formation, Inflation rate, Real exchange rates, Real imports and Terms of Trade 1960-2009 Annual Johansen method of co-integration. Co-integration was found and the associated error correction model shows evidence of approximately 48% correction the next year. They also concluded that increases in exports and hence degree of openness led to increased FDI flow, Gross fixed capital formation and stability in both inflation and exchange rates. Therefore they advocated for policies that will boost openness and FDI flow since they were found to be significant drivers of economic growth in Nigeria. Osinubi & Amaghionyeodiwe (2010) Foreign Private Investments, Gross Fixed Capital Formation, Net Exports and GDP growth 1970-2005 Annual Johansen Test for Co-integration Variables were jointly co-integrated and positively related to economic growth in Nigeria, with a high
37 rate. statistical significance. Imoudu.E. C (2012) Degree of openness, GDP and FDI in the Agric, Mining, Manufacturing, Telecoms and Petroleum sectors. 1980-2009 Annual Johansen Co-integration Approach Results showed that all the
variables used had long-run
association except for FDI in the Petroleum sector. It also advocated for the implementation of policies aimed at opening the economy further so as to maximize the benefits of FDI in Nigeria. Ogbonna C, Uwajumogu N, Nwokoye E & Nzeribe G. (2012) GDP, FDI, Gross Fixed Capital Formation (a proxy for investment), Net Exports, Exchange rates & CPI (a proxy for inflation rate). 1986-2010 Annual OLS and Granger Causality
Results show that 1% increase in FDI leads to 13% increase in GDP though the relationship was insignificant. Also, a bi-directional causality was established between FDI & GDP. The paper concluded by calling for deregulation of other sectors of the Nigerian economy to encourage investor participation in the productive sectors of the economy. Okoro M & Atan J. (2013) FDI, GDP & Exports 1987-2006 Annual OLS and Granger Causality
The study found that exports had a strong positive
38 effect on economic growth in Nigeria while FDI surprisingly had a negative and statistically significant effect on GDP. Olayiwola K & Okodua H. (2009) GDP, FDI & Non-oil Exports 1980-2007 Annual Johansen Co-integration, Vector Error Correction Model, Granger causality, Impulse response & Variance decomposition Empirical evidence from data used for the study shows that economic growth was not export led. However, there was uni-directional causality from FDI to non-oil exports. Results of variance decomposition show that policy shocks to FDI, non-oil exports and economic growth in Nigeria do not show immediate responses in the expected directions. Oyatoye E.O, Arogundade K.K, Adebisi S.O & Oluwakayode E.F. (2011) FDI, GDP & Exports 1987-2006 Annual Ordinary Least Squares
Results showed the existence of a positive relationship between FDI & GDP. Specifically, a ₦1 increase in FDI led to ₦104.749 increase in GDP. Thus, they advocated for policies that would enhance FDI
39
inflow into the Nigerian economy. Adesoji A.A &
Sotubo O.D. (2013) GDP, Non-oil exports & Exchange rates 1981-2010 Annual Ordinary Least Squares The conclusions drawn are that non-oil exports have performed below expectations and that export promotion strategies of the government have not been effective. The study
therefore made recommendations for the
diversification of our revenue base away from oil (a major revenue earner) in order to boost the productive capacity of non-oil sectors in the Nigerian economy. Mehrara M, Haghnejad A, Jalal D & Meybodi J.
(2014)
FDI, Exports & GDP 1980-2008 Annual Panel Unit-roots test, Panel Co-integration, Panel Fully Modified OLS, Panel VECM & Generalized Method of Moments (GMM) Estimator.
The study found evidence of bi-directional causality between FDI and economic growth in 57 developing countries in different parts of the world including Nigeria. It also found a unidirectional causality from exports to economic growth both in the
long-40
run and in the short-run, thereby lending support to the Export Led Growth (ELG) Hypothesis. It was recommended that developing countries should pursue policies aimed at stimulating exports and attracting FDI. Bin Shaari M, Hong H & Shukeri N. (2012) FDI & GDP 1971-2010 Annual Johansen Co-integration, Vector Error Correction Model (VECM) and Granger causality.
Findings from this study show that FDI had a
significant impact on real GDP in Malaysia during the period under review. Also a 1% increase in FDI caused Malaysia’s GDP to increase by 49.135%. The results of Granger analysis show that a bi-directional Granger causality exists between FDI and GDP Oteng A, E. & Frimpong J, M. (2006) FDI, Trade Openness (ratio of sum of exports & imports to GDP) & GDP 1970-2002 Annual.
OLS & Bounds testing
approach to co-integration (ARDL)
The study analyzed the impact of FDI and trade on GDP in Ghana in the long-run. The variables were found to be co-integrated. However, empirical evidence showed that only trade had a
41
significant positive effect on growth. Grafoute Amoro &
Yao Shen (2013) Rubber/Cocoa exports, rubber/cocoa output, exchange rates, Producer prices, interest rates, domestic consumption and average annual rainfall 1961-2005 Annual Ordinary Least Squares The paper reviewed the factors influencing agricultural exports in Ivorycoast and found that domestic rubber production, producer prices, exchange rates, domestic consumption & interest rates to be major drivers of rubber exports while domestic cocoa production & consumption as well as rainfall significantly influenced cocoa exports. Finally, the addition of value to the cocoa produced before exportation was strongly
recommended. Sakiru A.S &
Muhammad S. (2015) FDI, GDP, Trade Openness, Capital formation & Natural gas consumption. 1971-2012 Annual Bounds/ARDL approach to Co-integration.
The study looked at the role that FDI, capital formation & trade openness played in the economic growth of Malaysia by considering her oil & gas sectors. The study found that FDI and natural gas consumption
42
had positive effect on growth and that natural gas consumption causes FDI. Masoud R, M Shivee R, K Normaz W, I & Anzman-Saini W. (2014) GDP per capita, Net Official Development Assistance (ODA), Trade Openness & FDI 1998-2010 Annual Generalized Method of Moments (GMM)
The study analyzed the impact of FDI and Foreign AID on economic growth in 41 countries (including Nigeria) of sub-saharan Africa and concluded that though Foreign AID negatively affected growth, FDI positively influenced growth although this influence was statistically insignificant. Antwi S, Mills A &
Zhao X. (2013) FDI, GDP, GDP growth rate, GDP per capita, Industrial Production & Consumer Price Indices CPI. 1980-2010 Annual
OLS Method The study tried to find out the degree to which the variables were related and based on the results obtained, it was concluded that GDP and its growth rate, industrial production and inflation were all significant in explaining FDI in Ghana. Omoke P, C (2010) GDP, Investments & Exports 1970-2005 Annual Johansen Co-integration & Granger The paper represents an attempt to
43
causality investigate the relationship between economic growth, investments and exports in Nigeria. Empirical results showed no long-run relationship among the variables though it showed a bi-directional causality between investments and economic growth and between investments and exports, although this causality was insignificant. Akinlo A, E & Akinlo O, O. (2009) GDP, Market Capitalization, Number of listed securities & Market Indexes 1990-2005 Annual ARDL/Bounds testing approach
The study looked at the long-run causal relationship between stock market development and economic growth in seven countries of sub-saharan Africa. Results showed that economic growth and stock market development were co-integrated in Egypt and South Africa, with a statistically significant long-run effect on growth. Also, there was evidence of
44
Granger causality from stock market development to economic growth in Egypt and South Africa. The results were however, a little different in Ivory Coast, Kenya, Morocco, Zimbabwe and Nigeria where bi-directional causality existed between stock market development and economic growth, though it was statistically insignificant. Ogunmuyiwa M, S. (2011) GDP & External debt 1970-2007 Annual Johansen Co-integration, VECM & Granger Causality The study examined the impact of external debt on economic growth in Nigeria and found that there was no Granger cause between external debt and economic growth in Nigeria. The paper thus opined that the probable reason for the disconnection that exists between our huge and increasing level of external debt and economic growth is that there is high level of financial