HAZELNUT TESTA AS A BY-PRODUCT: NUTRITIONAL
COMPOSITION, ANTIOXIDANT ACTIVITY, PHENOLIC COMPOUND
PROFILE AND DIETARY FIBER CONTENT
YAN ÜRÜN OLARAK FINDIK ZARI: BESİN BİLEŞİMİ, ANTİOKSİDAN AKTİVİTE,
FENOLİK BİLEŞİK PROFİLİ VE DİYET LİFİ İÇERİĞİ
Vasfiye Hazal OZYURT
1,2,*, Semih OTLES
31
Near East University, Faculty of Engineering, Department of Food Engineering, 99138
Nicosia, TRNC Mersin 10, Turkey
2
Ege University, Department of Food Engineering, Graduate School of Natural and Applied
Sciences, 35100, Bornova, Izmir, Turkey
3
Ege University, Faculty of Engineering, Department of Food Engineering, 35100, Bornova,
Izmir, Turkey
ABSTRACT
Objective: The aim of this study is to determine hazelnut testa which is a good example of agro-food
by-products as a potential source of natural antioxidants and functional food ingredients.
Material and Method: Ultrasound assisted extraction (UAE) was used for less analysis time in both
determination of dietary fiber and the phenolic compounds. The total dietary fiber contents were determined using both the Association of Analytical Chemistry (AOAC) methods and the enzymatic-chemical method.
Result and Discussion: The results presented that hazelnut testa had a relatively high phenolic content
both the extract obtained by CE (1413.32 mg gallic acid equivalent (GAE)/g dry matter) and UAE in 5 min (1420.86 mg GAE/g dry matter). The extract obtained by UAE possessed higher antioxidant activity than the extract obtained by CE in both antioxidant activity methods. Three phenolic compounds identified in the extract obtained by CE while four phenolic compounds found in the extract obtained by UAE. In the enzymatic-chemical method, the dietary fiber in the extract obtained by CE contained 68.93% while the extract obtained by UAE was 70.69%. Our results suggested that hazelnut testa can be used in the preparation of low calorie, high fiber, and antioxidant-rich foods, food supplements, and active pharmaceutical ingredients.
* Corresponding Author / Sorumlu Yazar:Vasfiye Hazal Özyurt e-mail: [email protected],[email protected] Submitted/Gönderilme: 25.07.2018 Accepted/Kabul: 24.10.2018
Keywords: antioxidant activity; AOAC enzymatic-gravimetric method; dietary fibre; enzymatic-chemical
method; hazelnut testa, phenolic compound profile
ÖZ
Amaç: Bu çalışmanın amacı tarımsal bir gıda yan ürünü olan fındık zarının fonksiyonel gıda bileşeni ve
doğal antioksidanların kaynağı olarak incelenmesidir.
Gereç ve Yöntem: Bu çalışmada, ultrason destekli ekstraksiyon (UAE) hem diyet lifi hem de fenolik
bileşiklerin daha kısa analiz süresi için kullanılmıştır. Toplam diyet lifi içeriği, hem Analitik Kimya Birliği (AOAC) metodu hem de enzimatik-kimyasal metot kullanılarak tanımlanmış ve kıyaslanmıştır.
Sonuç ve Tartışma: Sonuçlara bakıldığında fındık zarının, hem CE (1413.32 mg gallik asit eşdeğeri (GAE) /g kuru madde) hem de UAE (1420.86 mg GAE/g kuru madde) ile elde edilen ekstraktlarında da oldukça yüksek fenolik bileşik içeriğine sahip olduğu görülmüştür. UAE ile elde edilen ekstraktın her iki antioksidan aktivite metotlarında CE ile elde edilen ekstraktından daha yüksek antioksidan aktiviteye sahip olduğu bulunmuştur. CE ile elde edilen ekstrakta 3 fenolik bileşen tanımlanırken, UAE ile elde edilen ekstrakta da 4 fenolik bileşen tanımlanmıştır. Enzimatik-kimyasal metotta, CE ile elde edilen ekstraktın toplam diyet lifi içeriği %68.93, UAE ile elde edilen ekstraktınki % 70,69 olarak bulunmuştur. Bu çalışmanın sonuçları, fındık zarının düşük kalorili, yüksek lif içeriğine sahip ve antioksidanca zengin gıdaların, gıda desteklerinin ve ilaç etken maddelerinin hazırlanmasında kullanılabileceğini göstermektedir.
Anahtar Kelimeler: antioksidan aktivite; AOAC gravimetrik metot; diyet lifi;
enzimatik-kimyasal metot; fındık zarı; fenolik bileşen profili
INTRODUCTON
Hazelnuts (Corylus avellana L. ) belonging to the family Betulaceae [1], are determined as “heart-healthy” foods [2] by Food and Drug Administration (FDA) and also recommended in a balanced diet due to their health-promoting properties. The production of hazelnuts nearly one million tonnes per year in the whole world[3]. Turkey, specifically the Black Sea region, is one of the largest hazelnut producer in the world and the other countries producing hazelnuts are Italy, the US, Spain Georgia and Chile [4]. Hazelnuts are widely used throughout the world in the chocolate, confectionery and bakery industries [5].
Hazelnut fruits have a hard, smooth shell. The seed is covered by a dark brown pellicular pericarp (skin or testa) [6] as well as they are marketed as natural and processed kernels. Whole processed hazelnut kernels, which are called as roasted hazelnut, constitute the largest amount of hazelnut consumption [7]. Hazelnut testa, represent about 2.5% of the total hazelnut kernel weight and is removed during roasting and has very low economic value have traditionally been used for livestock feed and as raw material for energy production [8]. However, in the past few years, several studies have indicated that byproducts used as livestock feed are an expensive valuable source of natural phytochemicals [9]. Therefore, the usage of hazelnut testa as a source of antioxidants and dietary fibre may offer beneficial supplements to the food, medicine, and cosmetic industry. The phenolic compounds play role in human health promotion, disease risk reduction [10,11] and protection against the harmful effect of free radicals, the risk of cancer, stroke, inflammation, and other neurodegenerative diseases [12,13].
Dietary fiber hydrolyzed by endogenous enzymes in the small intestine of human beings is considered an important nutrient for health [14]. Dietary fiber includes a mixture of plant carbohydrate polymers (cellulose, hemicelluloses, pectic substances, gums, resistant starch, inulin, lignin and, other non-carbohydrate components; polyphenols, waxes, saponins, cutin, phytates, resistant protein) [15]. Its consumption reduces risks associated with cardiovascular disease, cancer, diabetes, constipation, diverticulosis, obesity, chronic bowel disorders, hyperlipidemia, hypertension and cholesterol [16].
Few experiments [1,9,17–19] have investigated the total phenolic content of hazelnut testa, and studies of their antioxidant properties are limited to some solvent extracts and to the identification of the polyphenolic compounds in hazelnut testa. However, within the knowledge of authors, no study has found about the dietary fiber content of hazelnut taste. This study aimed to determine total phenolic content, to identified total antioxidant activity, to characterize phenolic profile of hazelnut testa extracted with both the extract obtained by concentional extraction (CE) and ultrasound assisted extraction (UAE) as well as to determine the content of dietary fiber in hazelnut taste and effectiveness of each different extraction methods on the dietary fiber content.
MATERIAL AND METHOD
Standarts and reagentsThe following standards and reagent were used: The following commercial available phenolic standards were used to determine the chemical compounds: gallic acid (Sigma, G7384), catechin hydrate, (Fluka, 22110), (-) epicatechin (Sigma, E1753), trans-cinnamic acid (Aldrich, 133767), ferulic acid (Fluka, 42280), rutin (Sigma, R5143), myricetin (Sigma, M6760), syringic acid (Sigma, S6881), caffeic acid (Sigma, C0625), quercetin hydrate (Sigma, 337951), p-coumaric acid (Sigma, C9008), naringenin (Sigma, N1376). The chemicals in the mobile phases were acetonitrile (Sigma, 34851) and methanol (Labscan, A17C11) and water used was tri-distilled. Folin-Ciocalteu phenol reacts (Sigma-Aldrich, E9252), DPPH reagent (2,2 diphenyl, 1, picrylhydrazyl) (Sigma, D9132), sodium carbonate (J.T. Baker, 2024), Tween 40 (Sigma, P1504), β-carotene (Roche, 303420) and Linoleic acid (Sigma L1376) were used. Arabinose (Merck,101492), xylose (Merck, 108689), mannose (Merck, 4440), galactose (Merck, 3455) and glucose (Merck, 4074) for neutral sugar; 3-phenyl phenol (Sigma Aldrich 262250), Sulphamic acid (Sigma Aldrich 383120) and galacturonic acid (Sigma Aldrich-Fluka 48280) for uronic acid; α-amylase (Sigma A3306), pancreatin (Sigma P7545) and amyloglucosidase (Sigma A9913) for dietary fiber were used. Other reagents were used: Ba(OH)2 (Merck 101737), Methyl red (Sigma, 250198), BH2BO3(Sigma, 703087), Bromine Cresol
Green (Sigma, 114359), Sodium Dodecyl Sulphate (Merck 817034), Acetone (Merck 100014), Ethanol (Merck 100983), Hexane (Merck 104368), H2SO4 (Merck 100713), Na2HPO4 (Merck,
chemicals and solvents for proximate composition were purchased either from Merck or Sigma.
Samples
Hazelnut testa, by-products of the hazelnut paste process of the hazelnut, were provided by a local factory in Turkey. Then, stored at 4° C until analyses were carried out.
Proximate Composition
The moisture content of hazelnut testa was determined by drying until they reached constant weight [20]. Total fat was calculated by extracting with n-hexane for 6 h according to Folch method [21]. Total ash, which was determined gravimetrically, was determined by drying of the samples in a muffle furnace. The temperature was gradually raised to 550° C, and the samples were ashed to a white color. Total protein content was determined by a micro Kjeldahl according to the Association of Analytical Chemistry (AOAC). Values were expressed by multiplying the total nitrogen content by a factor of 5.30 [22]. Experiments were carried out in duplicate. Total carbohydrates were calculated by subtracting the total percentage of other components from 100.
Extraction of crude phenolics
Five g of hazelnut testa was extracted three times with n-hexane (10 ml) for 6 h under constant agitation in order to remove the lipids. In conventional extraction (CE), five g of defatted hazelnut testa was mixed with 50 ml of methanol/water 80% (v/v) and incubated at 50° C, 30 min in a water bath. Samples were filtered with the vacuum pump and washed two more times with fresh solvent. The filtered methanolic fractions were combined and used for total phenolic content, antioxidant activity determination and phenolic profile [23]. In ultrasound assisted extraction (UAE) (Hielscher UP400S with 14 mm diameter H14 Sonotrod, Germany), the same procedure was also implemented at amplitude 100% at 5, 10, 15, 20 and 30 min. This methanolic fraction was used for antioxidant activity and phenolic profile.
Total phenolic contents
Total phenolic contents of hazelnut testa were determined by the Folin-Ciocalteu method as modified by Singleton and Rossi [24]. Briefly, extracts (50μl) were mixed Folin-Ciocalteu reagent (250μl) and 7% Na2CO3 (750μl). The mixture was diluted to 5 ml with bi-distilled water and was kept
for 120 min at ambient temperature in dark. Absorbance was measured at 765 nm using a diode array spectrophotometer (Varian Cary 50 Bio UV-Vis Spectrophotometer, Australia). The total phenolic contents of sample extract were measured by using a calibration curve which was prepared by using different concentrations (100–500 ppm) of gallic acid and catechin solution. Total phenolic content
was expressed as mg of gallic acid equivalents (GAE/g dry matter) and catechin equivalents (CE/g matter) by comparison to gallic acid standard curve and catechin standard curve, respectively. Each determination was performed in triplicate and repeated at least three times.
DPPH radical scavenging method
The free radical scavenging activity of hazelnut testa extracts was measured according to the DPPH (1,1-diphenyl-2-picrylhydrazyl hydrate) method reported [25], with some modifications. This was determined spectrophotometrically. The solution of DPPH in methanol (6 x 10⁻⁵ M) was prepared
daily. Two ml of this solution was mixed with 50μl of extract solution. Methanol was blank. The samples were kept in the dark room for 20 min at ambient temperature. Absorbance was measured at 515 nm on a UV spectrophotometer. Gallic acid was used as the standard reference antioxidant. Sample extract antioxidant capacities were measured by using a calibration curve which was prepared by using different concentrations (10–100 ppm) of the gallic acid solution. The experiment was carried out in triplicate. Antioxidant activity was also expressed as Antioxidant activity %. Absorbance was measured both initial and after 20 min. Antioxidant activity was calculated using the following equation:
Where Acontrol is the absorbance of the control (containing all reagents except the sample),
ADPPH is the absorbance of the sample, both measured at 515 nm. β-Carotene-Linoleat Model System
The antioxidant activity of defatted hazelnuts testa was evaluated according to a described procedure [26]. The β-Carotene solution was prepared by dissolving 25 mg of β-carotene in 5 mL of chloroform. Chloroform was removed from three milliliters of this solution under nitrogen. 40 mg of linoleic acid, 400 mg of Tween 80 emulsifier, and 100 mL of distilled water were added to concentrated. Samples were mixed in the orbital shaker in 5 min. Three milliliters of this emulsion was transferred into 2 mL of hazelnut testa extracts. Samples were shaken and incubated at 50 °C for 2h in a water bath. 80% methanol was control and emulsion without β-carotene was blank. Absorbance at 470 nm was recorded both the zero time and 120 min. The assays were carried out in triplicate. Antioxidant activity was calculated using the following equation:
Where Acontrol is the absorbance of the control (containing all reagents except the sample), A
Identification and Quantification of Phenolic Compound
The phenolic compound was identified by HPLC method of Monagas et al. [9] with some modification. HPLC (Agilent Technologies Liquid Chromatograph 1200 Series System, US), equipped with diode array detector (DAD), Agilent ChemStation data software and μ-Bondapak C18 column (3.9 x 300 mm) was used. In briefly, separations were performed at 40 °C, injecting 5µl of extract. Extracts were filtered through a 0.45 μm filter. A gradient between eluent A (water:acetic acid-98:2, v/v) and eluent B (water:acetonitrile:acetic acid-73:25:2) was used. The gradient program started with 100% A to reach 20% A and 80% B at 55 min, 10% A and 90% B at 57 min, 10% A and 90% B at 70 min, 5% A and 95% B at 80 min, 100% B at 90 min, 100% A at 95 min. The flow rate was 1 ml/min. Samples were analyzed in duplicate. The wavelengths of DAD were given at 254 and 370 nm for monitoring phenolic compound. The identified phenolic compounds were quantified on the basis of their peak areas and comparison with the calibration curve obtained with the corresponding standards (-) epicatechin, trans-cinnamic acid, ferulic acid, rutin, myricetin, syringic acid, caffeic acid, quercetin hydrate, p-coumaric acid, naringenin. The HPLC method was validated. The limit of detection (LOD) and the limit of quantification (LOQ) were defined as 3:1 and 10:1 peak to noise ratio and calculated for syringic acid.
Non-enzymatic method (Cell wall material-CWM)
Cell-wall material (CWM) was prepared following the modified method [25]. Briefly, hazelnut testa was weighed (20.5 g) and defatted by Folch method [21], using n-hexane as a solvent for 6 h. The defatted testas were blended in 1.5% (w/v) sodium dodecyl sulfate to solubilize proteins for 2 min. The homogenate was filtered with Whatman filter grade 1. Residue washed with 0.5% sodium dodecyl sulfate and sufficient deionized water to reduce bubbles on the filter. After several washes with water, acetone and ethanol were used for washing, the CWM was allowed to dry under the fume hood overnight until a constant weight was reached [27].
Enzymatic-gravimetric method-Total Dietary Fiber
Five g of hazelnut testa were extracted three times with n-hexane (10 ml) for 6 h under constant agitation in order to remove the lipids [22]. Total dietary fiber (TDF) was measured by AOAC method [28], determined as gravimetric after their extraction by using two different methods: conventional and ultrasound assistance. All samples were prepared and analyzed in triplicate. In the conventional method, defatted hazelnut testas were homogenized in phosphate buffer (0.08 M, pH 6.0) and incubated at 100° C with a heat stable α-amylase for 15 min under constant agitation, then NaOH solution (0.275 N, pH 7.5) was added and at 60 ° C in a water bath (Clifton, Weston-super-Mare,
North Somerset) for 30 min with protease in order to solubilize proteins. Finally, HCl solution (0.325 N, pH 4.5) was added and an amyloglucosidase solution was added and samples were incubated for 30 min in a water bath at 60° C with continuous agitation. To determine the TDF, samples were treated with % 95 (v/v) ethanol at room temperature for 1h. In order to precipitate soluble fiber and remove depolymerized protein and glucose, the residues were filtered and washed sequentially with 78 % (v/v) ethanol, 95 % (v/v) ethanol and absolute acetone. TDF was corrected for residual protein and ash. Experiments were carried out in duplicate. In ultrasound assistance extraction (UAE), defatted hazelnut testa was weighed into a glass of bottle, homogenized with phosphate buffer. Ultrasound assistance was performed at amplitude 100% at 5, 15, and 30 min (Hielscher UP400S, Teltow, Deutschland) at the time of adding each enzyme. Same processes were implemented as the conventional extraction.
Enzymatic-gravimetric method-Insoluble and Soluble Dietary Fiber (IDF-SDF)
Insoluble dietary fiber (IDF) and soluble dietary fiber (SDF) were measured by enzymatic-gravimetric AOAC methods. To determine IDF and SDF content [29], the enzyme-digested defatted sample was filtered and insoluble material washed twice with preheated water at 60° C. The final insoluble material was treated as above to give IDF. 95 % (v/v) ethanol were added to the filtrate and placed at room temperature for 1 h. After filtration, the recovered precipitate, SDF, was dried to a constant weight. IDF and SDF were corrected for residual protein and ash. Experiments were carried out in duplicate.
Enzymatic-chemical method
This method occurs in neutral sugar analysis (with HPLC), uronic acid analysis (with the spectrophotometric method) [30] and lignin analysis (with gravimetric) [31]. Neutral sugars were figured out after this residue was hydrolyzed with 77% H2SO4 and 25% H2SO4. The hydrolysates were
neutralized using Ba(OH)2 [32]. Arabinose, xylose, mannose, galactose, and glucose were used as
standards for neutral sugar analysis. The neutral sugar composition of the hydrolysates was determined by HPLC (Agilent Technologies Liquid Chromatograph 1200 Series System, US), Agilent ChemStation data software, carbohydrate analysis column Aminex HPX-87P (250*4.6mm) and refraction index detector (Waters, mod. 410). The mobile phase was 75% acetonitrile at a flow rate of 1.0 mL/min. The column temperature was 20 °C, injecting five µl of extract and time was 20 min. Uronic acids were determined by the spectrophotometer method. 5 mg of hazelnut testa was weighed and added 2 ml H2SO4 with 20 min constantly shaking. The mixture was diluted to 10 ml with
bi-distilled water, centrifuged at 2000 g for 10 min. 400 μL supernatant was mixed sulfamic acid/potassium sulphamate solution (4M, pH 1.6). This solution was added sodium tetraborate (75
mM), boiled in the water bath at 100 ºC. 3-phenyl-phenol was added. Galacturonic acid was the standard for calibration purposes. Absorbance was measured at 525 nm [33]. Klason lignin was calculated gravimetrically in hazelnut testa. Weighed testa samples of approximately 0.1 g were dispersed into 1.5 mL of 72% H2SO4 and incubated at room temperature for 24 h with frequent
shaking. The samples were further incubated in a temperature-controlled oven set at 100 °C for 2.5 h after having been diluted with 18.5 mL water. After centrifugation, lignin was recovered as residue. The residue was dried until a constant weight was reached, and the Klason lignin content was calculated gravimetrically. Experiments were carried out in triplicate.
Statistical Analysis
Values were analyzed by Statistical Package SPSS 16.0 version for Windows. The data were averaged and given with the standard deviation. The different methods were statistically compared by one-way analysis of variance (ANOVA). Duncan’s multiple-range test was applied to establish differences between samples and methods (p<0.05).
RESULT AND DISCUSSION
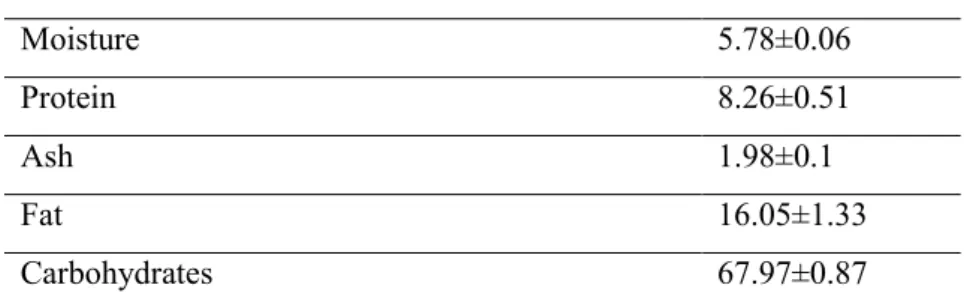
Proximate CompositionTable 1 showed the proximate composition and caloric value of hazelnut testa. Carbohydrate was the predominant component (67. 97 g/100g). Then, fat (16.05 g/100g) was calculated, followed by protein (8.26g/100g). Ash was 1.98 g/100g and moisture was 5.78g/100g. Harvest time, farming and drying methods, seasons, geographical origin, environmental factors, storage and handling conditions, in addition to the variety of hazelnut, affect the final composition of hazelnut testa [10].
Table 1. Proximate Composition of Hazelnut testa
Composition g/100g Moisture 5.78±0.06 Protein 8.26±0.51 Ash 1.98±0.1 Fat 16.05±1.33 Carbohydrates 67.97±0.87
Data are mean values of triplicate determination ± standart deviation Total Phenolic Contents
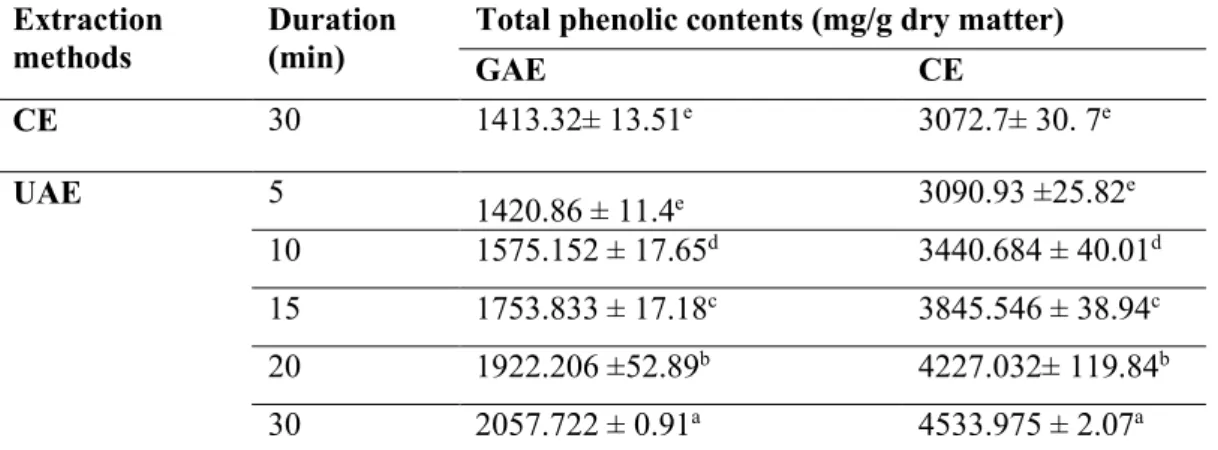
In this work, the total phenolic content of hazelnut testa was performed using different extraction methods. While applying CE for 30 minutes, UAE was applied for 5, 10, 15, 20 and 30 min.
Total phenolic contents of the extract obtained by CE and UAE of hazelnut testa were shown in Table 2; the results are expressed as both gallic acid and catechin equivalents on a dry basis (mg GAE/g dry matter). The results in Table 2 have indicated that UAE was found as more efficient than CE. Nevertheless, long-term UAE caused solvent losses and declination in the yield of extraction. UAE in 5 min was similar to CE according to SPSS 16.0 for Windows using Duncan (Table 2, p<0.05). Therefore, similar results have been obtained shorter time with UAE (Table 2, p<0.05). The results showed that UAE was more rapid and efficient than CE.
Table 2. Total phenolic contens of hazelnut testa Extraction
methods Duration (min) Total phenolic contents (mg/g dry matter) GAE CE
CE 30 1413.32± 13.51e 3072.7± 30. 7e UAE 5 1420.86 ± 11.4e 3090.93 ±25.82e 10 1575.152 ± 17.65d 3440.684 ± 40.01d 15 1753.833 ± 17.18c 3845.546 ± 38.94c 20 1922.206 ±52.89b 4227.032± 119.84b 30 2057.722 ± 0.91a 4533.975 ± 2.07a Data are mean values of triplicate determination ± standart deviation.
Means are not significantly different (p>0.05). The statistical analyses were done within column.
The total phenolic content might be also originated from different cultivars, geographic origin and harvest season of samples [34]. The values obtained in this experiment were higher than in previous studies. Previous studies have expressed the phenolic concentration of hazelnut testa as catechin equivalents between 577.7 mg/g and 638 mg/g [22], as gallic acid equivalents also between 680.3 mg/g [11] and 743.5mg/g using 80% aqueous ethanol. It was showed the amount of phenolic compound was found as 380 mg CE/g using methanol. Contini et al. also found as 499.7 mg CE/g using aqueous methanol (80/20, v/v) [7]. A recent study showed that extraction of the phenolic compounds from hazelnut testa was performed using different solvents (ethanol, acetone/water, acidified methanol, methanol) [35] and different extraction parameters [10].
DPPH radical scavenging method
The methanolic extract derived from nuts was evaluated for antioxidant capacity by the DPPH radical scavenging method [34]. In this reaction, the color of the methanolic solution of DPPH changed from purple to light yellow and this situation has indicated the free radical scavenging
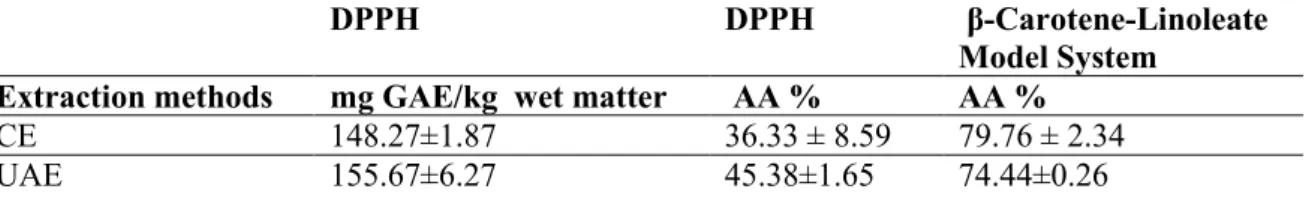
potential of the antioxidant compound. The antioxidant activity of CE of hazelnut testa was 148.27 mg GAE/kg wet basis, whereas that of UAE in 5 min was 155.67 mg GAE/kg wet basis (Table 3). The extract obtained by UAE presented higher antioxidant capacity than the extract obtained CE. There were no statistical differences among extracts (Table 3, p>0.05). This could be explained by the phenolic profile of the different extracts. Results were also reported as AA% (Antioxidant Activity %). According to the DPPH analysis results the statistical discrepancy was not observed between the extracts obtained CE and UAE. Singha and Kumar (2015) were found the antioxidant activity of grape skin between 44-58 % using DPPH radical scavenging activity [36].
Table 3. Antioxidant capacity of hazelnut testa (DPPH radical scavenging activity and
β-Carotene-Linoleate Model System)
DPPH DPPH β-Carotene-Linoleate
Model System
Extraction methods mg GAE/kg wet matter AA % AA %
CE 148.27±1.87 36.33 ± 8.59 79.76 ± 2.34
UAE 155.67±6.27 45.38±1.65 74.44±0.26
Data are mean values of triplicate determination ± standart deviation Means are not significantly different (p>0.05).
β-Carotene-Linoleate Model System
β-Carotene-Linoleate Model System is relevant to measure the antioxidant activity of lipophilic material [37]. This method is spectrophotometrically and when antioxidants and the radicals including antioxidant are added to food, the deterioration of β–carotene delays [38].
The antioxidant activity of defatted hazelnut testa extracts measured by the β-carotene-linoleate model system is presented in Table 3. As oxidation progressed, the absorbance of β-carotene at 470 nm decreased and its yellow color faded. In that study, results were reported as AA% (Antioxidant Activity %). Antioxidant activity in CE showed higher than the antioxidant activity of UAE. Wijeratne et al. (2006) determined the antioxidant activity of the almond brown skin using β-Carotene-Linoleate Model System and found their antioxidant activity between 74-83% [39].
Phenolic profile by HPLC-DAD analysis
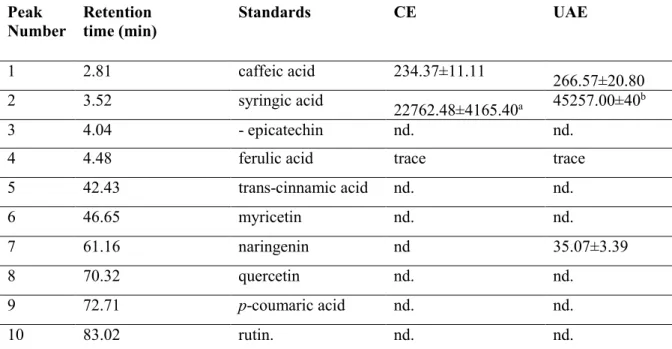
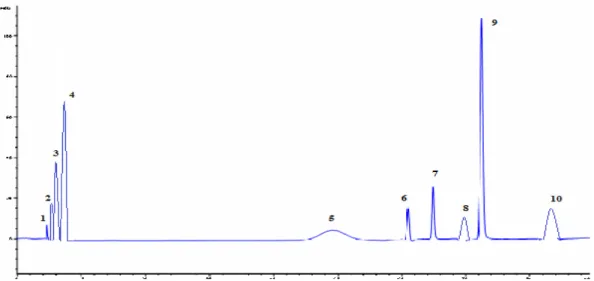
The identification and quantification of the phenolic compounds in hazelnut testa were put into practice with the comparison of peak retention times, peak areas and spectra of pure standards. The chromatograms were recorded at 320 nm for caffeic and ferulic acid, 280 nm for naringenin, 270 nm for syringic acid. The contents of total phenolic compounds in methanol extracts of hazelnut testa were listed in Table 4.
hazelnut testa and retention times of these standards were given in Table 4. The chromatogram of standards was given in Figure 1. Three phenolic compounds identified in the extract obtained by CE were ferulic, syringic and caffeic acids. Four phenolic compounds found in the extract obtained by UAE were ferulic, syringic, caffeic acids and naringenin. The only phenolic acid was syringic acid showing statistical difference amoung extraction methods (Table 4, p<0.05).
Table 4. Contents of phenolic compounds in extracts and retention time of hazelnut testa (mg/g dry
matter)
Peak
Number Retention time (min) Standards CE UAE
1 2.81 caffeic acid 234.37±11.11 266.57±20.80
2 3.52 syringic acid 22762.48±4165.40a 45257.00±40b
3 4.04 - epicatechin nd. nd.
4 4.48 ferulic acid trace trace
5 42.43 trans-cinnamic acid nd. nd. 6 46.65 myricetin nd. nd. 7 61.16 naringenin nd 35.07±3.39 8 70.32 quercetin nd. nd. 9 72.71 p-coumaric acid nd. nd. 10 83.02 rutin. nd. nd.
All retention times are averages of duplicate runs.
Data are mean values of triplicate determination ± standart deviation. The statistical analyses were done within row.
Figure 1. HPLC chromatogram of antioxidant standards. 1: caffeic acid; 2: syringic acid; 3: - epicatechin; 4: ferulic acid; 5:
trans-cinnamic acid; 6: myricetin; 7: naringenin; 8: quercetin; 9: p-coumaric acid; 10: rutin.
As previously reported, Shahidi et al. used 80% ethanol for obtaining hazelnut testa extracts used to identify phenolic profile with HPLC-DAD [22]. This study showed that the phenolic compounds of hazelnut testa were gallic acid, p-coumaric acid, ferulic acid, sinapic acid, and caffeic acid. Hydroxybenzoic acid (protocatechuic, p-hydroxybenzoic, chlorogenic, vanillic and trans-p-coumaric acids), flavan-3-ols (+ catechin and –epicatechin), flavonols (as aglycones; isorhamnetin, quercetin, kaempferol and glycosides; 3-O-rutinoside, 3-O-galactoside, quercetin-3-O-glucoside, kaempferol-3-O-rutinoside, isorhamnetin-3-O-rutinoside, kaempherol-quercetin-3-O-glucoside, isorhamnetin-3-O-glucoside) and flavanones (as aglycones; naringenin and eriodictyol and glycosides; eryodictiol-7-O-glucoside and naringenin-7-O-glucoside) were identified by Mandalari et al. in almond skin [27]. Shahidi et al. [22] compared phenolic acids of hazelnut kernel and by-products. Their extracts showed diversity in the phenolic acids present. Qualitative and quantitative differences existed among by-products. Gallic acid was predominant phenolic acids in hazelnut testa and following p-coumaric, ferulic and sinapic acid. Caffeic acid was found as trace by Yurttas et al. [40] identified the major phenolic compound of hazelnut as gallic acid, p-hydroxybenzoic acid, caffeic acid, epicatechin, sinapic, quercetin. Since solvents for extraction and hazelnut varieties were different in all those studies, the consistency of our results was roughly confirmed by comparing with the phenolic profile of similar samples. The values of LOD and LOQ for syringic acid were found as 0.30 mg/ L and 1 mg/L, respectively.
Non-enzymatic-gravimetric method
This analysis is called neutral detergent fiber method, which is alternative for dietary fiber determination because of the different determination of dietary fiber. According to this method, while
the soluble material is not determined, cellulose and lignin do. This analysis is smooth and time needed is short. If the soluble material can be omitted, this analysis is advantageous. However, the sample includes starch, results are fluctuant. The percentages of cell wall material in hazelnut testa was presented 7.54±0.14%.
Enzymatic-gravimetric method-Total Dietary Fiber
The total dietary fiber in hazelnut testa was measured by enzymatic-gravimetric AOAC 985.29 method. In this method, after the α-amylase enzyme and heat have provided gelatinization, protein and starch have been broken by protease (pancreatin) and amyloglucosidase [28]. Moreover, the residue have been washed with 80-85% ethanol instead of water [41].
UAE was used to be active each enzyme in the shorter time. The optimum time for UAE was defined by SPSS 16.0 for Windows using Duncan. The defined time was used to find the amount of the dietary fiber by the enzymatic-chemical method. The amount of dietary fiber with CE was similar to the amount of total dietary fiber with UAE in 15 min for each enzyme (Table 5, p>0.05). Similar results were obtained in the shorter time with UAE. The results showed that UAE was more rapid and efficient than CE (Table 5). Craeyveld et al. (2009) and Kamal-Eldin et al. (2009) were researched the total dietary fiber content of wheat and rye bran used commonly in the food industry was found as 46 % and 44%, respectively [42,43].
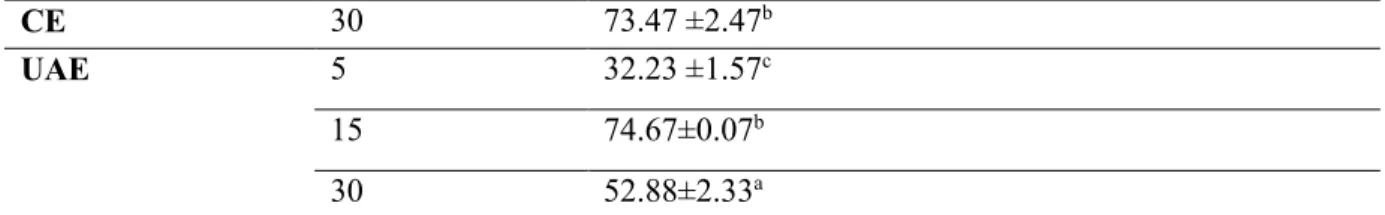
Table 5. Dietary fiber content of hazelnut testa
Extraction methods Duration (min) Total dietary fiber (g/100g samples)
CE 30 73.47 ±2.47b
UAE 5 32.23 ±1.57c
15 74.67±0.07b
30 52.88±2.33a
Data are mean values of duplicate determination ± standart deviation. The statistical analyses were done within column.
Enzymatic-gravimetric method-Insoluable and Soluable Dietary Fiber Analysis.
IDF and SDF in hazelnut testa were measured by enzymatic-gravimetric AOAC 991.43 method [29]. Dietary fiber can be divided into water-soluble dietary fiber and water-insoluble dietary fiber [44]. Total dietary fiber content was 68.14 g/100g, of which 22.52 g/100g was soluble fiber.
Enzymatic-chemical method
This method occurs in neutral sugar analysis (with HPLC), uronic acid analysis (with the spectrophotometric method) [30] and lignin analysis (with gravimetric) [31]. While Englyst method as dietary fiber (nonstarch polysaccharides) includes neutral sugar analysis (with HPLC) and uronic acid analysis (with the spectrophotometric method), Uppsala method also involves lignin amounts in addition to them.
The dietary fiber analysis with the enzymatic-chemical method has included the same enzymatic treatment as in the total dietary fiber method. 15 min as optimum time in total dietary fiber analysis was implemented in the enzymatic-chemical method using both CE and UAE.
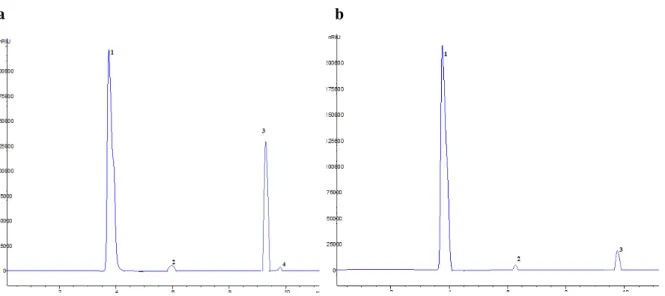
Non-starch polysaccharides in hazelnut testa were measured by the enzymatic-chemical method and sugar compositions of the extracts obtained by CE and UAE in 15 min were reported in Figure 2, respectively. The details of sugar composition were given Table 6 for both CE and UAE in 15 min. Arabinose was the major sugars, followed by glucose in the extract obtained by CE. Mannose and galactose were found as the trace amount. The extract obtained by UAE of hazelnut testa contained mostly arabinose, followed by galactose. The only trace of mannose was detected and glucose was not detected. The arabinose amount of the extracts obtained by CE and UAE in 15 min were found as statistically different (p<0.05). Ramirez-Truque et al. (2011) researched neutral sugar profile of cell wall polysaccharides of pitaya (Hylocereus sp.) fruits and found the total neutral sugar content as 32.3 % as well as neutral sugar profile contained rhamnose, ribose, arabinose, xylose, mannose, galactose and glucose [45]. Uronic acid was 212.48±6.55 (mg/kg sample) and 210.21±18.31 (mg/kg sample) and uronic acid in the form of galacturonic acid is a major component of the pectic polysaccharide rhamnogalacturonan, which is present in large amounts in the cell walls of most fruits and vegetables [46]. Yamazaki et al. (2008) was found the uronic acid content of Japanese Pepper (Zanthoxylum piperitum DC.) Fruit as 52.1 g/100 g [47]. In another study, Silva et al. (2014) searched the uronic acid contents in Portuguese apple (Malus domestica Borkh. cv Bravo de Esmolfe) and the contents of uronic acid were changed between 80 and 178 μg/ mg sample [48]. The Klason lignin content was 58.53±0.64 (g/100g) and 55.93±1.33 (g/100g) for the extract obtained by CE and UAE, respectively. However, this value may be overestimated as the residue representing the Klason lignin is a mixture of lignin with residual protein, suberin, and ash.
a b
Figure 2.a Sugar composition of conventional treatment of hazelnut testa 1. arabinose, 2. mannose, 3. glucose, 4. galactose. b. Sugar composition of ultrasound assistance treatment of hazelnut testa: 1. arabinose, 2. mannose, 3. galactose.
Dietary fiber was 68.93±0.31% according to results of total dietary fiber with the enzymatic-chemical method in the extract obtained by CE, whereas 70.69±1.27 % in the extract obtained by UAE. No significant differences in terms of dietary fiber content were observed between two applications. Total dietary fiber (TDF) accounted for 73.47 ±2.47 % (w/w) according to enzymatic-gravimetric method and 68.93±0.31% (w/w) according to enzymatic-chemical method in the extract obtained by CE, while 74.67±0.07 % (w/w) according to enzymatic-gravimetric method and 70.69±1.27% (w/w) according to enzymatic-chemical method in the extract obtained by UAE. A good agreement was not found between enzymatic-gravimetric method and enzymatic-chemical method both the extract obtained by CE and UAE in 15 min (optimum).
Table 6. Dietary fiber amont of different treatments of hazelnut testa with enzymatic-chemical method
Neutral sugar (g/100g) Uronic acid
(mg/L) Klason Lignin (g/100g) Arabinose Mannose Galactose Glucose
CE 9.7±0.14a trace trace 0.675±0.035 212.48±6.55a
58.53±0.64a
UAE in 15 min 13.99±0.44b trace 0.055±0.001 nd
210.21±18.31a 55.93±1.33a Data are mean values of duplicate determination ± standart deviation.
The statistical analyses were done within column.
This work has suggested that UAE to hazelnut testa could be efficient strategy for obtaining phenolic compounds and dietary fibre in short time. While total phenolic content obtained in 30 min with CE was found as similar that obtained in 5 min with UAE. These extracts had similar antioxidant
activities both β-Carotene-Linoleate Model System and DPPH radical scavenging analyses. The phenolic compounds of the extract obtained by CE of hazelnut testa were identified as ferulic, syringic and caffeic acid, while that of the extract obtained by UAE was found as ferulic, syringic, caffeic acid and naringenin. The hazelnut testa showed significant antioxidant activities, which may be attributed to strong abilities for hydrogen-donation and scavenging of hydroxyl radicals. The present study also demonstrated that hazelnut testas contained significant amounts of the dietary fiber. UAE and CE were used to determine the amount of dietary fiber. This work has shown that the AOAC procedure values lead to the different calculation of average daily intake versus using Englyst procedure and non-enzymatic-gravimetric procedure, so it is extremely important to be aware of the origin of dietary fiber values. The enzymatic-gravimetric method assesses the highest fiber content and the enzymatic-chemical method estimates the lowest amount. Our results indicated that hazelnut testa, removed when preparing hazelnut paste, can be recovered and used as a value-added product, with potential as sources of dietary fiber and antioxidants for the food, medicine, and cosmetic industries.
REFERENCES
1. Del Rio, D., Calani, L., Dall’Asta, M., Brighenti, F. (2011). Polyphenolic composition of hazelnut skin, Journal of Agriculture and Food Chemistry, 59, 9935–9941.
2. Yang, J., Liu, R. H., Halim, L. (2009). Antioxidant and antiproliferative activities of common edible nut seeds. LWT-Food Science and Technology, 42(1), 1-8.
3. Contini, M., Baccelloni, S., Massantini, R., Anelli, G. (2008). Extraction of natural antioxidants from hazelnut (Corylus avellana L.) shell and skin wastes by long maceration at room temperature. Food Chemistry, 110(3), 659-669.
4. Nicolotti, L., Cordero, C., Bicchi, C., Rubiolo, P., Sgorbini, B., Liberto, E. (2013). Volatile profiling of high quality hazelnuts (Corylus avellana L.): chemical indices of roasting. Food chemistry, 138(2-3), 1723-1733.
5. Cristofori, V., Ferramondo, S., Bertazza, G., Bignami, C. (2008). Nut and kernel traits and chemical composition of hazelnut (Corylus avellana L.) cultivars. Journal of the Science of Food and Agriculture, 88(6), 1091-1098.
6. Sang, S., Lapsley, K., Jeong, W. S., Lachance, P. A., Ho, C. T., Rosen, R. T. (2002). Antioxidative phenolic compounds isolated from almond skins (Prunus amygdalus Batsch). Journal of Agricultural and Food Chemistry, 50(8), 2459-2463.
7. Saklar, S., Katnas, S., Ungan, S. (2001). Determination of optimum hazelnut roasting conditions. International journal of food science & technology, 36(3), 271-281.
Almond (Prunus dulcis (Mill.) da Webb) skins as a potential source of bioactive polyphenols. Journal of agricultural and food chemistry, 55(21), 8498-8507.
9. Monagas, M., Garrido, I., Lebrón-Aguilar, R., Gómez-Cordovés, M. C., Rybarczyk, A., Amarowicz, R., Bartolomé, B. (2009). Comparative flavan-3-ol profile and antioxidant capacity of roasted peanut, hazelnut, and almond skins. Journal of Agricultural and Food Chemistry, 57(22), 10590-10599.
10. Alasalvar, C., Karamać, M., Kosinska, A., Rybarczyk, A., Shahidi, F., Amarowicz, R. (2009). Antioxidant activity of hazelnut skin phenolics. Journal of Agricultural and Food Chemistry, 57(11), 4645-4650.
11. Contini, M., Baccelloni, S., Frangipane, M. T., Merendino, N., Massantini, R. (2012). Increasing espresso coffee brew antioxidant capacity using phenolic extract recovered from hazelnut skin waste. Journal of Functional Foods, 4(1), 137-146.
12. Esfahlan, A. J., Jamei, R., Esfahlan, R. J. (2010). The importance of almond (Prunus amygdalus L.) and its by-products. Food chemistry, 120(2), 349-360.
13. Kornsteiner, M., Wagner, K. H., Elmadfa, I. (2006). Tocopherols and total phenolics in 10 different nut types. Food chemistry, 98(2), 381-387.
14. Kendall, C. W., Esfahani, A., Jenkins, D. J. (2010). The link between dietary fibre and human health. Food Hydrocolloids, 24(1), 42-48.
15. Colin-Henrion, M., Mehinagic, E., Renard, C. M., Richomme, P., Jourjon, F. (2009). From apple to applesauce: Processing effects on dietary fibres and cell wall polysaccharides. Food Chemistry, 117(2), 254-260.
16. Hollmann, J., Themeier, H., Neese, U., Lindhauer, M. G. (2013). Dietary fibre fractions in cereal foods measured by a new integrated AOAC method. Food chemistry, 140(3), 586-589. 17. Lainas, K., Alasalvar, C., Bolling, B. W. (2016). Effects of roasting on proanthocyanidin
contents of Turkish Tombul hazelnut and its skin. Journal of Functional Foods, 23, 647-653. 18. Bertolino, M., Belviso, S., Dal Bello, B., Ghirardello, D., Giordano, M., Rolle, L., Gerbi, V.
Zeppa, G. (2015). Influence of the addition of different hazelnut skins on the physicochemical, antioxidant, polyphenol and sensory properties of yogurt. LWT-Food Science and Technology, 63(2), 1145-1154.
19. Odabaş, H. İ., Koca, I. (2016). Application of response surface methodology for optimizing the recovery of phenolic compounds from hazelnut skin using different extraction methods. Industrial Crops and Products, 91, 114-124.
20. AOAC (Assosiation of Analytical Chemistry). (2006). Moisture in nuts, Official methods of AOAC, 18 th edition. Washington, DC.
purification of total lipids from animal tissues. Journal of Biological Chemistry, 226(1), 497-509.
22. Shahidi, F., Alasalvar, C., Liyana-Pathirana, C. M. (2007). Antioxidant phytochemicals in hazelnut kernel (Corylus avellana L.) and hazelnut byproducts. Journal of Agricultural and Food Chemistry, 55(4), 1212-1220.
23. Abe, L. T., Lajolo, F. M., Genovese, M. I. (2010). Comparison of phenol content and antioxidant capacity of nuts. Food Science and Technology, 30, 254-259.
24. Singleton, V. L., Rossi, J. A. (1965). Colorimetry of total phenolics with phosphomolybdic-phosphotungstic acid reagents. American journal of Enology and Viticulture, 16(3), 144-158. 25. Brand-Williams, W., Cuvelier, M. E., Berset, C. L. W. T. (1995). Use of a free radical method
to evaluate antioxidant activity. LWT-Food science and Technology, 28(1), 25-30.
26. Alasalvar, C., Karamać, M., Amarowicz, R., Shahidi, F. (2006). Antioxidant and antiradical activities in extracts of hazelnut kernel (Corylus avellana L.) and hazelnut green leafy cover. Journal of Agricultural and Food Chemistry, 54(13), 4826-4832.
27. Mandalari, G., Tomaino, A., Arcoraci, T., Martorana, M., Turco, V. L., Cacciola, F., Rich, G. T., Bisignano, C., Saija, A., Dugo, P., Cross, K. L., Parker, M. L., Waldron, K. W. Wickham, M. S. J. (2010). Characterization of polyphenols, lipids and dietary fibre from almond skins (Amygdalus communis L.). Journal of Food Composition and Analysis, 23(2), 166-174. 28. AOAC (1985). Total dietary fibre in foods. Official methods of analysis of AOAC, 14th
edition, Washington, DC.
29. AOAC (1991). Total, soluble, and insoluble dietary fibre in dood, Official methods of AOAC. 15 th edition, Washington, DC.
30. Englyst, H. N., Quigley, M. E., Hudson, G. J. (1994). Determination of dietary fibre as non-starch polysaccharides with gas–liquid chromatographic, high-performance liquid chromatographic or spectrophotometric measurement of constituent sugars. Analyst, 119(7), 1497-1509.
31. Theander, O., Aman, P., Westerlund, E., Andersson, R., Pettersson, D. (1995). Total dietary fiber determined as neutral sugar residues, uronic acid residues, and Klason lignin (the Uppsala method): collaborative study. Journal of AOAC International, 78(4), 1030-1044 32. Uçar, G., Balaban, M. (2004). Hydrolysis of polysaccharides with 77% sulfuric acid for
quantitative saccharification. Turkish Journal of Agriculture and Forestry, 27(6), 361-365. 33. Scott, R. W. (1979). Colorimetric determination of hexuronic acids in plant materials.
Analytical chemistry, 51(7), 936-941.
34. Siriwardhana, S. S., Shahidi, F. (2002). Antiradical activity of extracts of almond and its by‐ products. Journal of the American Oil Chemists' Society, 79(9), 903-908.
35. Locatelli, M., Travaglia, F., Coisson, J. D., Martelli, A., Stevigny, C., Arlorio, M. (2010). Total antioxidant activity of hazelnut skin (Nocciola Piemonte PGI): Impact of different roasting conditions. Food chemistry, 119(4), 1647-1655
36. Singha, I., Das, S. K. (2015). Free radical scavenging properties of skin and pulp extracts of different grape cultivars in vitro and attenuation of H2O2-induced oxidative stress in liver tissue ex vivo. Indian Journal of Clinical Biochemistry, 30(3), 305-312.
37. Trox, J., Vadivel, V., Vetter, W., Stuetz, W., Kammerer, D. R., Carle, R., Scherbaum, V., Gola, U., Nohr, D., Biesalski, H. K. (2011). Catechin and epicatechin in testa and their association with bioactive compounds in kernels of cashew nut (Anacardium occidentale L.). Food chemistry, 128(4), 1094-1099.
38. Roginsky, V., Lissi, E. A. (2005). Review of methods to determine chain-breaking antioxidant activity in food. Food chemistry, 92(2), 235-254.
39. Wijeratne, S. S., Amarowicz, R., Shahidi, F. (2006). Antioxidant activity of almonds and their by-products in food model systems. Journal of the American Oil Chemists' Society, 83(3), 223.
40. Yurttas, H. C., Schafer, H. W., Warthesen, J. J. (2000). Antioxidant activity of nontocopherol hazelnut (Corylus spp.) phenolics. Journal of food science, 65(2), 276-280.
41. Champ, M., Langkilde, A. M., Brouns, F., Kettlitz, B., Collet, Y. L. B. (2003). Advances in dietary fibre characterisation. 1. Definition of dietary fibre, physiological relevance, health benefits and analytical aspects. Nutrition Research Reviews, 16(1), 71-82.
42. Craeyveld, V. V., Holopainen, U., Selinheimo, E., Poutanen, K., Delcour, J. A., Courtin, C. M. (2009). Extensive dry ball milling of wheat and rye bran leads to in situ production of arabinoxylan oligosaccharides through nanoscale fragmentation. Journal of Agricultural and Food Chemistry, 57(18), 8467-8473.
43. Kamal-Eldin, A., Lærke, H. N., Knudsen, K. E., Lampi, A. M., Piironen, V., Adlercreutz, H., Katina, K., Poutanen, K., Åman, P. (2009). Physical, microscopic and chemical characterisation of industrial rye and wheat brans from the Nordic countries. Food & Nutrition Research, 53(1), 1912.
44. Ramulu, P., Rao, P. U. (2003). Total, insoluble and soluble dietary fiber contents of Indian fruits. Journal of food composition and analysis, 16(6), 677-685.
45. Ramírez-Truque, C., Esquivel, P., Carle, R. (2011). Neutral sugar profile of cell wall polysaccharides of pitaya (Hylocereus sp.) fruits. Carbohydrate polymers, 83(3), 1134-1138. 46. Melton, L. D., Smith, B. G. (2001). Determination of the uronic acid content of plant cell
walls using a colorimetric assay. Current Protocols in Food Analytical Chemistry.
pectins from the alcohol-insoluble residue of Japanese pepper (Zanthoxylum piperitum DC.) fruit, a major by-product of antioxidant extraction. Food science and technology research, 14(1), 18-24.
48. Silva, A. S., Nunes, C., Coimbra, M. A., Guido, L. F. (2014). Composition of pectic polysaccharides in a Portuguese apple (Malus domestica Borkh. cv Bravo de Esmolfe). Scientia Agricola, 71(4), 331-336.