STRONG INCREASE IN EMPLOYMENT,
SHARP DECLINE IN UNEMPLOYMENT
Seyfettin Gürsel
*Gökçe Uysal
and Ayşenur Acar
Abstract
Seasonally adjusted labor market data shows that non-agricultural unemployment rate decreased by 0.4
percentage points to 11.6 percent in the period of December 2013 compared to that of November 2013. According
to our estimations, the growth rate has been accelerating since the second half of 2013 and thus has contributed to
the decline in the non-agricultural unemployment. In a parallel manner, we observe employment increases in all
sectors. Manufacturing employment increased in line with the increase in the manufacturing production index. The
increase in service employment is the largest in the past year. We also observe increases in construction and
agriculture.
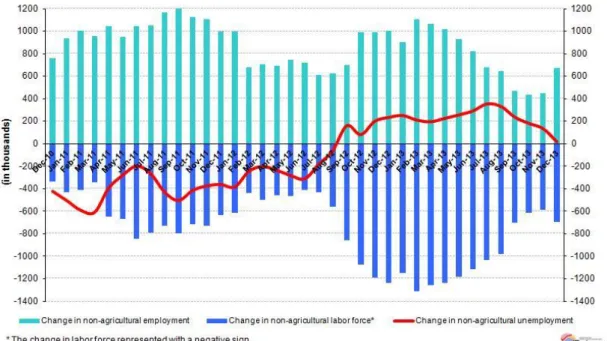
Rapid increase in non-agricultural employment
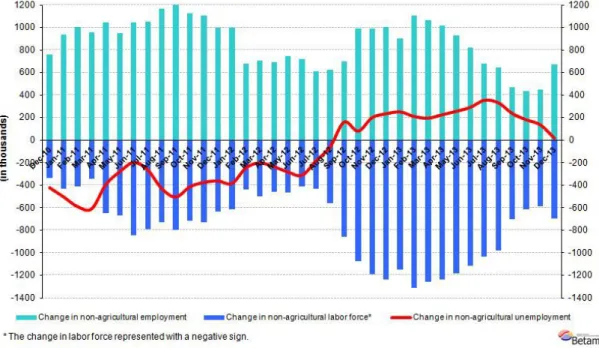
According to the data released by TurkSTAT, non-agricultural labor force increased by 694 thousand (3.2 percent)
and non-agricultural employment increased by 675 thousand (3.5percent) in the period of December 2013 (Figure
1). Consequently, the number of persons unemployed in non-agricultural sectors increased only slightly by 19
thousand, and thus, non-agricultural unemployment rate decreased to 12.1 percent (0.3 percentage point).Note
that the annual increase in non-agricultural employment has increased to 700 thousand after three consecutive
periods of increases of 300 thousand. Non-agricultural employment increased by 3.3 percent in the second half of
2013. Meanwhile, estimated annual growth rate was 4.8 percent in the same period.
1In other words, we estimate
that employment elasticity of growth is about 0.7 points in the second half of 2013. Considering that the elasticity
has been hovering around 0.8 since the aftermath of 2008 crisis, we suppose that this decline in non-agricultural
unemployment is a result of the high growth rate.
Figure 1 Year-on-year changes in non-agricultural labor force, employment and unemployment
Source: TurkSTAT, Betam
* Prof. Dr. Seyfettin Gürsel, Betam, Director, [email protected] Yrd. Doç. Dr. Gökçe Uysal, Betam, Vice Director, [email protected] Ayşenur Acar, Betam, Research Assistant, [email protected]
1 See a detailed information; "S.Gürsel, Z. İmamoğlu and Soybilgen B. "Growth Review: 2013 3th Quarter", Betam Research Brief.
www.betam.bahcesehir.edu.tr
1
Labor Market Outlook:
March 2014
Non-agricultural unemployment decreased by 0.4 percentage points
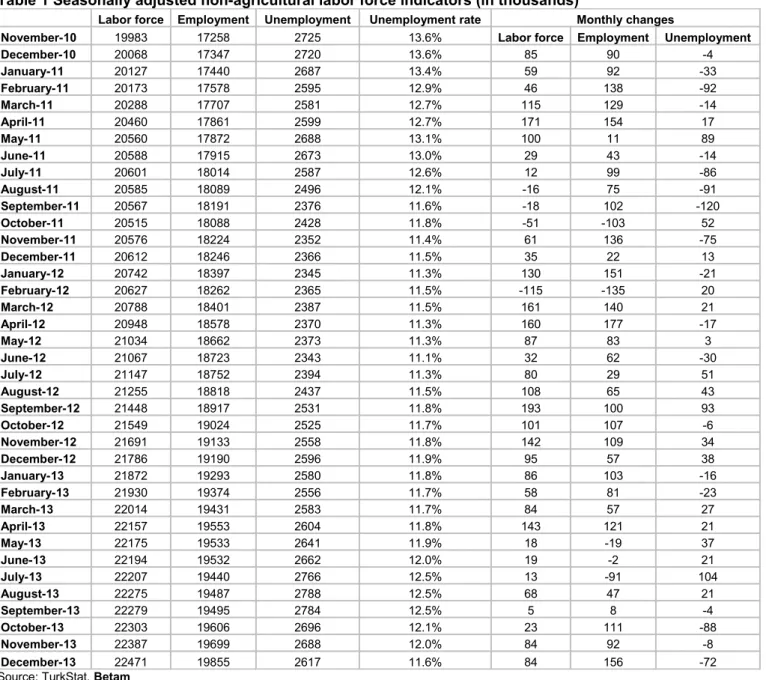
According to seasonally adjusted data, non-agricultural labor force increased by 84 thousand in the period of
December 2013 compared to the period of October 2013, and reached 22 million 471 thousand (Figure 2, Table
1). Non-agricultural employment increased by 156 thousand and reached 19 million 855 thousand. Hence, the
number of persons unemployed in non-agricultural sectors decreased by 72 thousand and non-agricultural
unemployment rate decreased to 11.6 percent in the period of December 2013. Increase in non-agricultural
employment is the highest observed in the past last year.
Figure 2 Seasonally adjusted non-agricultural labor force, employment and unemployment
Source: TurkStat, Betam
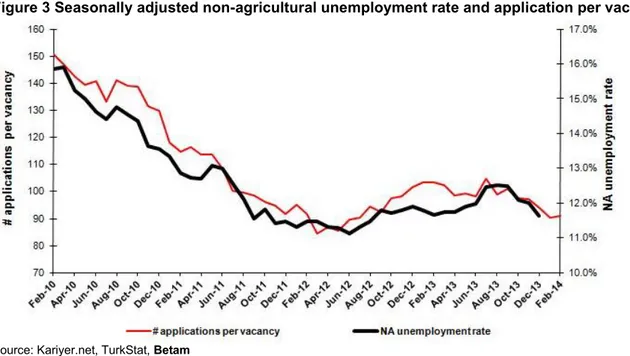
According to Kariyer.net data, non-agricultural unemployment might stagnate in the next period
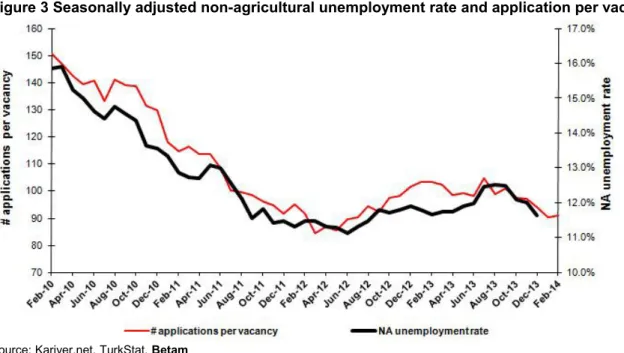
Last month, seasonally adjusted application per vacancy statistics calculated using Kariyer.net series correctly
predicted a fall in the non-agricultural unemployment rate. This month's data indicates that non-agricultural
unemployment will stagnate in the period of January 2013.
2Figure 3 Seasonally adjusted non-agricultural unemployment rate and application per vacancy
Source: Kariyer.net, TurkStat, Betam
2 Betam has been calculating application per vacancy using series released by Kariyer.net for a while. Seasonal and calendar adjustment
procedure is applied to application per vacancy series. A decrease in applications per vacancy may be caused by an increase in vacancies or by a decrease in the number of applications. An increase in vacancies signals economic growth while decreasing number of applications indicates a decrease in number of people looking for a job.
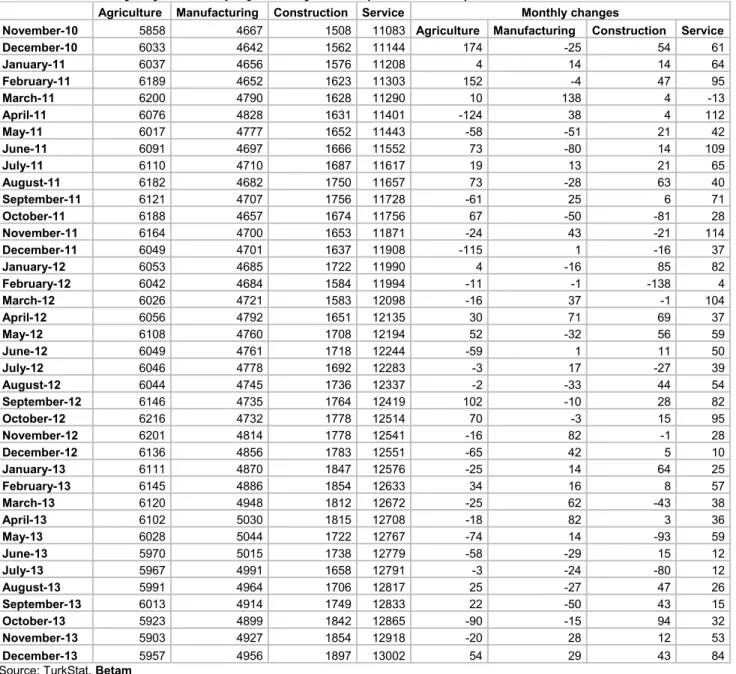
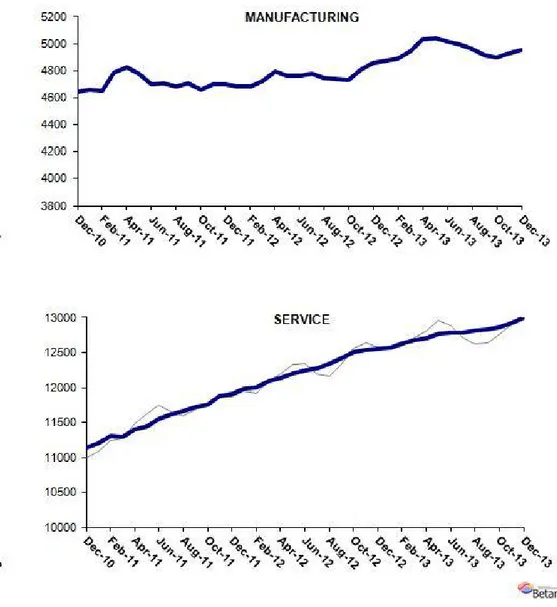
Employment increased in all sectors
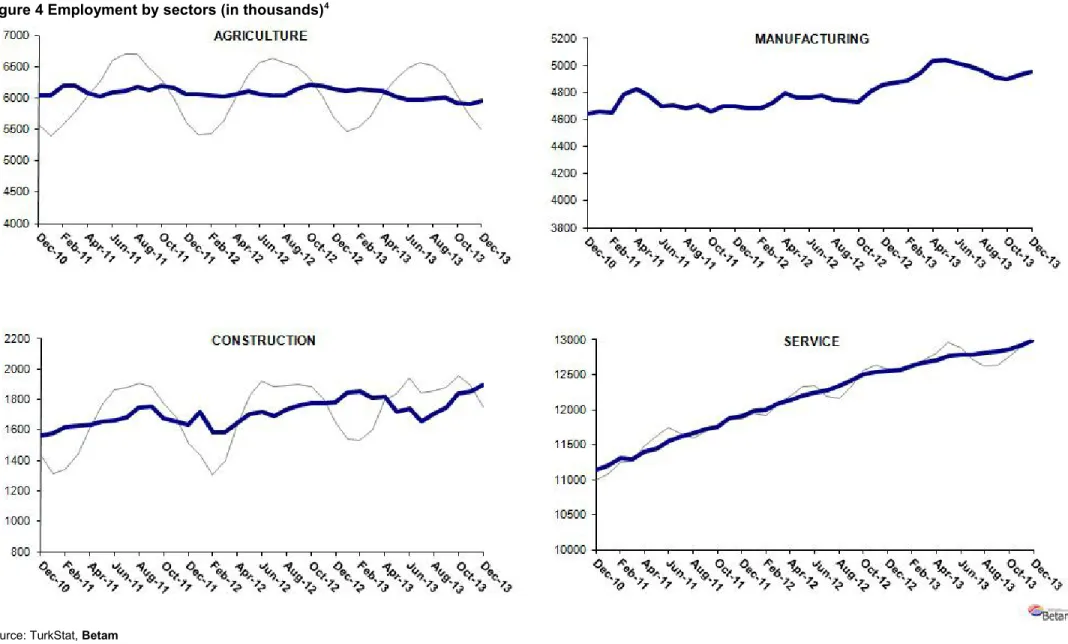
Seasonally adjusted labor market series show that employment increased in all sectors (Table 2, Figure 4).
3In the
period of December 2013, manufacturing employment increased by 29 thousand parallel to the increases in
manufacturing production index, which has been increasing in November, December and January. Service
employment increased by 84 thousand, which is the strongest increase observed in the past year. Also, we
observe that construction employment has been increasing since the period of August 2013. Agricultural
employment that has been decreasing for a while, increased unexpectedly in the period of December 2013.
Despite this increase, note that agricultural employment decreased by 179 thousand overall during the past year.
3 Employment in each sector is seasonally adjusted separately. Hence the sum of these series may differ from the seasonally adjusted series of total employment. The difference stems from the non-linearity of the seasonal adjustment process.
Figure 4 Employment by sectors (in thousands)
4Source: TurkStat, Betam
4 Grey lines indicate seasonally adjusted series, where dark blue lines represent raw data.
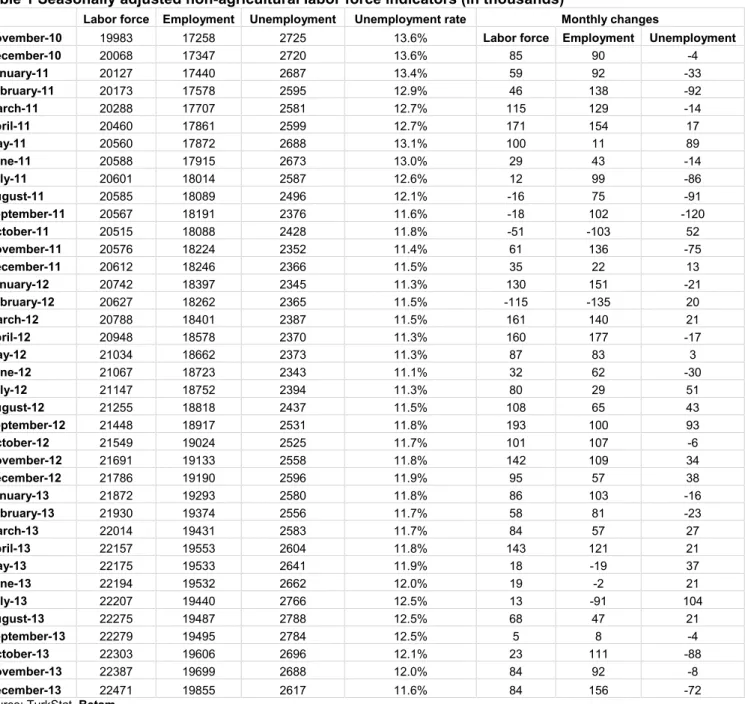
Table 1 Seasonally adjusted non-agricultural labor force indicators (in thousands)
Labor force Employment Unemployment Unemployment rate Monthly changes
November-10 19983 17258 2725 13.6% Labor force Employment Unemployment December-10 20068 17347 2720 13.6% 85 90 -4 January-11 20127 17440 2687 13.4% 59 92 -33 February-11 20173 17578 2595 12.9% 46 138 -92 March-11 20288 17707 2581 12.7% 115 129 -14 April-11 20460 17861 2599 12.7% 171 154 17 May-11 20560 17872 2688 13.1% 100 11 89 June-11 20588 17915 2673 13.0% 29 43 -14 July-11 20601 18014 2587 12.6% 12 99 -86 August-11 20585 18089 2496 12.1% -16 75 -91 September-11 20567 18191 2376 11.6% -18 102 -120 October-11 20515 18088 2428 11.8% -51 -103 52 November-11 20576 18224 2352 11.4% 61 136 -75 December-11 20612 18246 2366 11.5% 35 22 13 January-12 20742 18397 2345 11.3% 130 151 -21 February-12 20627 18262 2365 11.5% -115 -135 20 March-12 20788 18401 2387 11.5% 161 140 21 April-12 20948 18578 2370 11.3% 160 177 -17 May-12 21034 18662 2373 11.3% 87 83 3 June-12 21067 18723 2343 11.1% 32 62 -30 July-12 21147 18752 2394 11.3% 80 29 51 August-12 21255 18818 2437 11.5% 108 65 43 September-12 21448 18917 2531 11.8% 193 100 93 October-12 21549 19024 2525 11.7% 101 107 -6 November-12 21691 19133 2558 11.8% 142 109 34 December-12 21786 19190 2596 11.9% 95 57 38 January-13 21872 19293 2580 11.8% 86 103 -16 February-13 21930 19374 2556 11.7% 58 81 -23 March-13 22014 19431 2583 11.7% 84 57 27 April-13 22157 19553 2604 11.8% 143 121 21 May-13 22175 19533 2641 11.9% 18 -19 37 June-13 22194 19532 2662 12.0% 19 -2 21 July-13 22207 19440 2766 12.5% 13 -91 104 August-13 22275 19487 2788 12.5% 68 47 21 September-13 22279 19495 2784 12.5% 5 8 -4 October-13 22303 19606 2696 12.1% 23 111 -88 November-13 22387 19699 2688 12.0% 84 92 -8 December-13 22471 19855 2617 11.6% 84 156 -72 Source: TurkStat, Betam
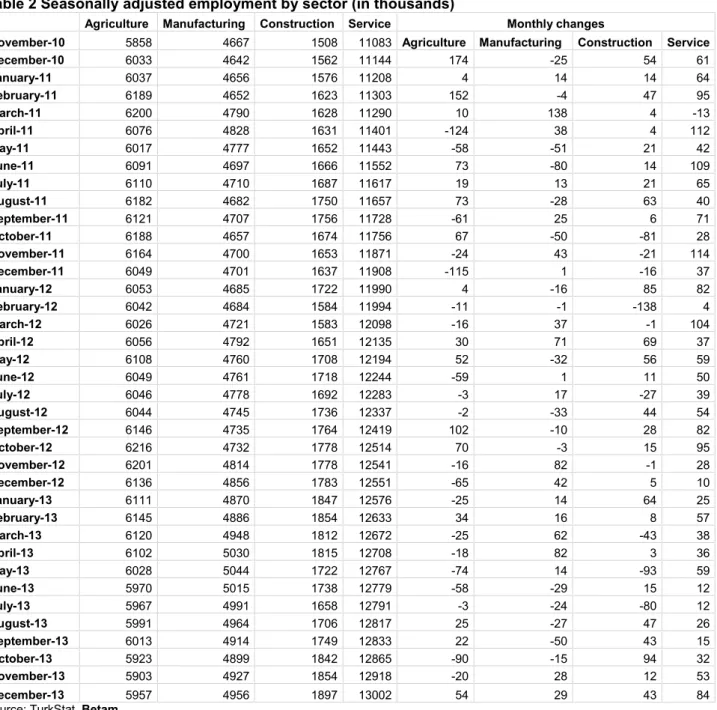
Table 2 Seasonally adjusted employment by sector (in thousands)
Agriculture Manufacturing Construction Service Monthly changes
November-10 5858 4667 1508 11083 Agriculture Manufacturing Construction Service December-10 6033 4642 1562 11144 174 -25 54 61 January-11 6037 4656 1576 11208 4 14 14 64 February-11 6189 4652 1623 11303 152 -4 47 95 March-11 6200 4790 1628 11290 10 138 4 -13 April-11 6076 4828 1631 11401 -124 38 4 112 May-11 6017 4777 1652 11443 -58 -51 21 42 June-11 6091 4697 1666 11552 73 -80 14 109 July-11 6110 4710 1687 11617 19 13 21 65 August-11 6182 4682 1750 11657 73 -28 63 40 September-11 6121 4707 1756 11728 -61 25 6 71 October-11 6188 4657 1674 11756 67 -50 -81 28 November-11 6164 4700 1653 11871 -24 43 -21 114 December-11 6049 4701 1637 11908 -115 1 -16 37 January-12 6053 4685 1722 11990 4 -16 85 82 February-12 6042 4684 1584 11994 -11 -1 -138 4 March-12 6026 4721 1583 12098 -16 37 -1 104 April-12 6056 4792 1651 12135 30 71 69 37 May-12 6108 4760 1708 12194 52 -32 56 59 June-12 6049 4761 1718 12244 -59 1 11 50 July-12 6046 4778 1692 12283 -3 17 -27 39 August-12 6044 4745 1736 12337 -2 -33 44 54 September-12 6146 4735 1764 12419 102 -10 28 82 October-12 6216 4732 1778 12514 70 -3 15 95 November-12 6201 4814 1778 12541 -16 82 -1 28 December-12 6136 4856 1783 12551 -65 42 5 10 January-13 6111 4870 1847 12576 -25 14 64 25 February-13 6145 4886 1854 12633 34 16 8 57 March-13 6120 4948 1812 12672 -25 62 -43 38 April-13 6102 5030 1815 12708 -18 82 3 36 May-13 6028 5044 1722 12767 -74 14 -93 59 June-13 5970 5015 1738 12779 -58 -29 15 12 July-13 5967 4991 1658 12791 -3 -24 -80 12 August-13 5991 4964 1706 12817 25 -27 47 26 September-13 6013 4914 1749 12833 22 -50 43 15 October-13 5923 4899 1842 12865 -90 -15 94 32 November-13 5903 4927 1854 12918 -20 28 12 53 December-13 5957 4956 1897 13002 54 29 43 84 Source: TurkStat, Betam
www.betam.bahcesehir.edu.tr
1
STRONG INCREASE IN EMPLOYMENT,
SHARP DECLINE IN UNEMPLOYMENT
Seyfettin Gürsel
*Gökçe Uysal
and Ayşenur Acar
Abstract
Seasonally adjusted labor market data shows that non-agricultural unemployment rate decreased by 0.4
percentage points to 11.6 percent in the period of December 2013 compared to that of November 2013. According
to our estimations, the growth rate has been accelerating since the second half of 2013 and thus has contributed to
the decline in the non-agricultural unemployment. In a parallel manner, we observe employment increases in all
sectors. Manufacturing employment increased in line with the increase in the manufacturing production index. The
increase in service employment is the largest in the past year. We also observe increases in construction and
agriculture.
Rapid increase in non-agricultural employment
According to the data released by TurkSTAT, non-agricultural labor force increased by 694 thousand (3.2 percent)
and non-agricultural employment increased by 675 thousand (3.5percent) in the period of December 2013 (Figure
1). Consequently, the number of persons unemployed in non-agricultural sectors increased only slightly by 19
thousand, and thus, non-agricultural unemployment rate decreased to 12.1 percent (0.3 percentage point).Note
that the annual increase in non-agricultural employment has increased to 700 thousand after three consecutive
periods of increases of 300 thousand. Non-agricultural employment increased by 3.3 percent in the second half of
2013. Meanwhile, estimated annual growth rate was 4.8 percent in the same period.
1In other words, we estimate
that employment elasticity of growth is about 0.7 points in the second half of 2013. Considering that the elasticity
has been hovering around 0.8 since the aftermath of 2008 crisis, we suppose that this decline in non-agricultural
unemployment is a result of the high growth rate.
Figure 1 Year-on-year changes in non-agricultural labor force, employment and unemployment
Source: TurkSTAT,Betam
*Prof. Dr. Seyfettin Gürsel, Betam, Director, [email protected] Yrd. Doç. Dr. Gökçe Uysal, Betam, Vice Director, [email protected] Ayşenur Acar, Betam, Research Assistant, [email protected]
1See a detailed information;"S.Gürsel, Z. İmamoğlu and Soybilgen B. "Growth Review: 2013 3th Quarter", Betam Research Brief.
Labor Market Outlook:
March 2014
www.betam.bahcesehir.edu.tr
2
Non-agricultural unemployment decreased by 0.4 percentage points
According to seasonally adjusted data, non-agricultural labor force increased by 84 thousand in the period of
December 2013 compared to the period of October 2013, and reached 22 million 471 thousand (Figure 2, Table
1). Non-agricultural employment increased by 156 thousand and reached 19 million 855 thousand. Hence, the
number of persons unemployed in non-agricultural sectors decreased by 72 thousand and non-agricultural
unemployment rate decreased to 11.6 percent in the period of December 2013. Increase in non-agricultural
employment is the highest observed in the past last year.
Figure 2 Seasonally adjusted non-agricultural labor force, employment and unemployment
Source: TurkStat,Betam
According to Kariyer.net data, non-agricultural unemployment might stagnate in the next period
Last month, seasonally adjusted application per vacancy statistics calculated using Kariyer.net series correctly
predicted a fall in the non-agricultural unemployment rate. This month's data indicates that non-agricultural
unemployment will stagnate in the period of January 2013.
2Figure 3 Seasonally adjusted non-agricultural unemployment rate and application per vacancy
Source: Kariyer.net, TurkStat,Betam
2 Betam has been calculating application per vacancy using series released by Kariyer.net for a while. Seasonal and calendar adjustment
procedure is applied to application per vacancy series. A decrease in applications per vacancy may be caused by an increase in vacancies or by a decrease in the number of applications. An increase in vacancies signals economic growth while decreasing number of applications indicates a decrease in number of people looking for a job.
www.betam.bahcesehir.edu.tr
3
Employment increased in all sectors
Seasonally adjusted labor market series show that employment increased in all sectors (Table 2, Figure 4).
3In the
period of December 2013, manufacturing employment increased by 29 thousand parallel to the increases in
manufacturing production index, which has been increasing in November, December and January. Service
employment increased by 84 thousand, which is the strongest increase observed in the past year. Also, we
observe that construction employment has been increasing since the period of August 2013. Agricultural
employment that has been decreasing for a while, increased unexpectedly in the period of December 2013.
Despite this increase, note that agricultural employment decreased by 179 thousand overall during the past year.
3Employment in each sector is seasonally adjusted separately. Hence the sum of these series may differ from the seasonally adjusted series of
www.betam.bahcesehir.edu.tr
4
Figure 4 Employment by sectors (in thousands)
4Source: TurkStat,Betam
5
Table 1 Seasonally adjusted non-agricultural labor force indicators (in thousands)
Labor force Employment Unemployment Unemployment rate Monthly changes
November-10 19983 17258 2725 13.6% Labor force Employment Unemployment December-10 20068 17347 2720 13.6% 85 90 -4 January-11 20127 17440 2687 13.4% 59 92 -33 February-11 20173 17578 2595 12.9% 46 138 -92 March-11 20288 17707 2581 12.7% 115 129 -14 April-11 20460 17861 2599 12.7% 171 154 17 May-11 20560 17872 2688 13.1% 100 11 89 June-11 20588 17915 2673 13.0% 29 43 -14 July-11 20601 18014 2587 12.6% 12 99 -86 August-11 20585 18089 2496 12.1% -16 75 -91 September-11 20567 18191 2376 11.6% -18 102 -120 October-11 20515 18088 2428 11.8% -51 -103 52 November-11 20576 18224 2352 11.4% 61 136 -75 December-11 20612 18246 2366 11.5% 35 22 13 January-12 20742 18397 2345 11.3% 130 151 -21 February-12 20627 18262 2365 11.5% -115 -135 20 March-12 20788 18401 2387 11.5% 161 140 21 April-12 20948 18578 2370 11.3% 160 177 -17 May-12 21034 18662 2373 11.3% 87 83 3 June-12 21067 18723 2343 11.1% 32 62 -30 July-12 21147 18752 2394 11.3% 80 29 51 August-12 21255 18818 2437 11.5% 108 65 43 September-12 21448 18917 2531 11.8% 193 100 93 October-12 21549 19024 2525 11.7% 101 107 -6 November-12 21691 19133 2558 11.8% 142 109 34 December-12 21786 19190 2596 11.9% 95 57 38 January-13 21872 19293 2580 11.8% 86 103 -16 February-13 21930 19374 2556 11.7% 58 81 -23 March-13 22014 19431 2583 11.7% 84 57 27 April-13 22157 19553 2604 11.8% 143 121 21 May-13 22175 19533 2641 11.9% 18 -19 37 June-13 22194 19532 2662 12.0% 19 -2 21 July-13 22207 19440 2766 12.5% 13 -91 104 August-13 22275 19487 2788 12.5% 68 47 21 September-13 22279 19495 2784 12.5% 5 8 -4 October-13 22303 19606 2696 12.1% 23 111 -88 November-13 22387 19699 2688 12.0% 84 92 -8 December-13 22471 19855 2617 11.6% 84 156 -72 Source: TurkStat,Betam
6
Table 2 Seasonally adjusted employment by sector (in thousands)
Agriculture Manufacturing Construction Service Monthly changes
November-10 5858 4667 1508 11083 Agriculture Manufacturing Construction Service December-10 6033 4642 1562 11144 174 -25 54 61 January-11 6037 4656 1576 11208 4 14 14 64 February-11 6189 4652 1623 11303 152 -4 47 95 March-11 6200 4790 1628 11290 10 138 4 -13 April-11 6076 4828 1631 11401 -124 38 4 112 May-11 6017 4777 1652 11443 -58 -51 21 42 June-11 6091 4697 1666 11552 73 -80 14 109 July-11 6110 4710 1687 11617 19 13 21 65 August-11 6182 4682 1750 11657 73 -28 63 40 September-11 6121 4707 1756 11728 -61 25 6 71 October-11 6188 4657 1674 11756 67 -50 -81 28 November-11 6164 4700 1653 11871 -24 43 -21 114 December-11 6049 4701 1637 11908 -115 1 -16 37 January-12 6053 4685 1722 11990 4 -16 85 82 February-12 6042 4684 1584 11994 -11 -1 -138 4 March-12 6026 4721 1583 12098 -16 37 -1 104 April-12 6056 4792 1651 12135 30 71 69 37 May-12 6108 4760 1708 12194 52 -32 56 59 June-12 6049 4761 1718 12244 -59 1 11 50 July-12 6046 4778 1692 12283 -3 17 -27 39 August-12 6044 4745 1736 12337 -2 -33 44 54 September-12 6146 4735 1764 12419 102 -10 28 82 October-12 6216 4732 1778 12514 70 -3 15 95 November-12 6201 4814 1778 12541 -16 82 -1 28 December-12 6136 4856 1783 12551 -65 42 5 10 January-13 6111 4870 1847 12576 -25 14 64 25 February-13 6145 4886 1854 12633 34 16 8 57 March-13 6120 4948 1812 12672 -25 62 -43 38 April-13 6102 5030 1815 12708 -18 82 3 36 May-13 6028 5044 1722 12767 -74 14 -93 59 June-13 5970 5015 1738 12779 -58 -29 15 12 July-13 5967 4991 1658 12791 -3 -24 -80 12 August-13 5991 4964 1706 12817 25 -27 47 26 September-13 6013 4914 1749 12833 22 -50 43 15 October-13 5923 4899 1842 12865 -90 -15 94 32 November-13 5903 4927 1854 12918 -20 28 12 53 December-13 5957 4956 1897 13002 54 29 43 84 Source: TurkStat,Betam