CURRENT ACCOUNT DEFICIT DECLINES
Zümrüt İmamoğlu* ve Barış Soybilgen
†Executive Summary
In November, Industrial Production Index (IPI) and imports decreased by 2.5 percent and 2 percent respectively whereas exports increased by 1.7 percent. We believe that the fall in investment expenditure continued in the fourth quarter. Export volume decreased compared to the third quarter but the decline in the import volume was larger, hence, we expect that contribution to GDP from net exports are small but positive in the fourth quarter. Betam’s quarter on quarter (QoQ) growth forecast for the fourth quarter is 1.2 percent. We expect annual growth to slow down. Betam’s year on year growth forecast for the fourth quarter is 5.9 percent and our annual growth estimate is 8.3 percent.
Increases in both the trade deficit and the current account deficit slowed down in the third quarter compared to previous quarters and in the fourth quarter, they began to decline. In nominal terms, annual current account deficit in the third quarter was 78 billion dollar and we forecast that it has reduced to 76 billion dollar in the fourth quarter. Betam’s current account deficit forecast for the end of fourth quarter is 9.8 percent.
* Dr. Zümrüt İmamoğlu, Betam, Research Associate. [email protected]
† Barış Soybilgen, Betam, Research Assistant,
Table 1. Betam’s quarterly and annual growth rate forecasts
Source: Betam
*sa: seasonally and calendar day adjusted **ca: calendar day adjusted
Slowdown continues
QoQ GDP growth in the third quarter, which was announced as 1.7 percent, was above our expectations. However, trends in GDP components were close to our forecasts. Only the magnitude of consumption expenditure’s contribution to the real GDP was significantly different than our forecast.
We expect that in the fourth quarter, the decline in investment expenditure continued, contribution of
2011 4th Quarter Forecast Real GDP growth, %
(quarter on quarter, sa*) 1.2
Real GDP growth, %
(year on year, ca**) 5.9
Current account deficit (% of GDP, annual) 9.8 2011 Annual Forecast Real GDP growth (annual) 8.3
Economic Outlook and Forecasts:
January 2011
net exports helped the QoQ GDP growth to increase and consumption made a strong contribution to growth.
On the policy front, fiscal stance is still tight. However, because of better than expected budget performance, it is anticipated that government increased its spending in December like last year. Therefore, we expect the government expenditure to contribute to GDP growth in the fourth quarter. In the face of these developments, our quarter on quarter growth forecast for the last quarter in 2011 is 1.2 percent and corresponding year on year growth forecast is 5.9 percent. Our annual growth estimate for 2011 is 8.3 percent.
In order to keep inflation expectations under control, it can be inferred that Turkish Central Bank (TCMB) will pursue a tight monetary policy. Monetary tightening and stagnation in Europe will slow down growth in Turkey. Istanbul Stock Exchange (ISE) Index continued its decline in the last two quarters. We believe that the disturbances in the global financial market will begin affecting economic growth as of first quarter of 2012.
Consumption indicators declined in November
Consumer Confidence Index increased by 1.5 percent in November. However, durable and nondurable goods manufacturing decreased by 2.7 and 1.5 percent, respectively. The fall in consumer goods imports continued in November and decreased by 5.6 percent. Decline in imports reduced Special Consumption Tax (SCT) income of government which fell by 2.9 percent in November. Even tough consumption indicators
declined in November, we expect that consumption expenditure made a positive contribution to the GDP growth in the fourth quarter.
Investment expenditure continued to fall
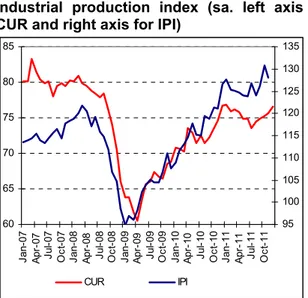
In November, imports of intermediate goods increased by 1.4 percent but IPI decreased by 2.5 percent. Capacity Utility Rate (CUR) increased by 0.4 and 1 percentage points in November and December, respectively. Imports of investment goods is one of the best leading indicators for forecasting investment expenditure and it fell by 3 percent in November. Real sector confidence index has high fluctuations as it is seen in Table 2. It can be inferred that the real sector has difficulties forecasting the future economic situation in the last two quarters. In the coming two quarters, both domestic and foreign shocks may continue to distort the future expectations of the real sector.
Export volume continues to increase
Figure 2 shows monthly changes of seasonally adjusted import and export volume indices. In November, exports increased by 1.7 percent and imports decreased by 2 percent. Both the slowdown in the Turkish economy and depreciation of Turkish Lira continue to curb imports. Stagnation in European Union may have negative affects on exports in the coming months. We believe that the contribution of net exports to quarterly GDP growth was positive in the fourth quarter.
Increase in current account deficit stopped
In November, current account deficit was 5.2 billion dollars. For the first time in more than a year, monthly current account deficit (CAD) is lower than the deficit of the same month in the previous year. Consequently, we expect the annual CAD to decline in the fourth quarter. In nominal terms, annual CAD was 77.8 billion dollar at the end of third quarter. Betam estimates that CAD was 76 billion dollar at the end of 2011.
In the third quarter, current account deficit to GDP ratio was 9.8 percent, we expect that it remained
same in the fourth quarter. Figure 4 shows the growth rate of current account deficit to GDP ratio in percentage points. In the last three quarters, current account deficit increased by 1.4 percentage points in each quarter and in the third quarter it increased by 0.7 percentage points. In the fourth quarter, the increase nearly came to a halt. We have to note that the strong base effect has an important role in this reversal because there was a surge in the deficit in the fourth quarter of 2010.
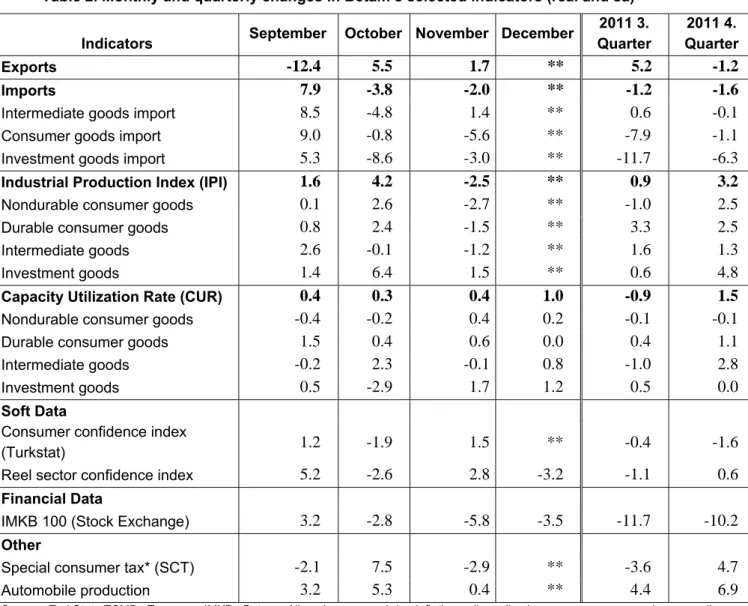
Table 2. Monthly and quarterly changes in Betam’s selected indicators (real and sa)
Indicators September October November December
2011 3. Quarter 2011 4. Quarter Exports -12.4 5.5 1.7 ** 5.2 -1.2 Imports 7.9 -3.8 -2.0 ** -1.2 -1.6
Intermediate goods import 8.5 -4.8 1.4 ** 0.6 -0.1
Consumer goods import 9.0 -0.8 -5.6 ** -7.9 -1.1
Investment goods import 5.3 -8.6 -3.0 ** -11.7 -6.3
Industrial Production Index (IPI) 1.6 4.2 -2.5 ** 0.9 3.2
Nondurable consumer goods 0.1 2.6 -2.7 ** -1.0 2.5
Durable consumer goods 0.8 2.4 -1.5 ** 3.3 2.5
Intermediate goods 2.6 -0.1 -1.2 ** 1.6 1.3
Investment goods 1.4 6.4 1.5 ** 0.6 4.8
Capacity Utilization Rate (CUR) 0.4 0.3 0.4 1.0 -0.9 1.5
Nondurable consumer goods -0.4 -0.2 0.4 0.2 -0.1 -0.1
Durable consumer goods 1.5 0.4 0.6 0.0 0.4 1.1
Intermediate goods -0.2 2.3 -0.1 0.8 -1.0 2.8
Investment goods 0.5 -2.9 1.7 1.2 0.5 0.0
Soft Data
Consumer confidence index
(Turkstat) 1.2 -1.9 1.5 ** -0.4 -1.6
Reel sector confidence index 5.2 -2.6 2.8 -3.2 -1.1 0.6
Financial Data
IMKB 100 (Stock Exchange) 3.2 -2.8 -5.8 -3.5 -11.7 -10.2
Other
Special consumer tax* (SCT) -2.1 7.5 -2.9 ** -3.6 4.7
Automobile production 3.2 5.3 0.4 ** 4.4 6.9
Source: TurkStat. TCMB. Treasury. IMKB. Betam. All series are real (or inflation adjusted) wherever necessary and seasonally adjusted.
*This tax is collected on sales of goods such as gas. fuel oils. alcohol. tobacco products and automobiles. **Data not yet released
Figure 1: Capacity utilization rate and industrial production index (sa. left axis for CUR and right axis for IPI)
60 65 70 75 80 85 Ja n-07 Ap r-07 Ju l-0 7 Oc t-07 Ja n-08 Ap r-08 Ju l-0 8 Oc t-08 Ja n-09 Ap r-09 Ju l-0 9 Oc t-09 Ja n-10 Ap r-10 Ju l-1 0 Oc t-10 Ja n-11 Ap r-11 Ju l-1 1 Oc t-11 95 100 105 110 115 120 125 130 135 CUR IPI
Source : TurkStat. Betam
Figure 2: Volume indices of exports and imports (sa) 120.00 130.00 140.00 150.00 160.00 170.00 180.00 190.00 200.00 210.00 Ja n-07 Ma y-07 S ep-07 Ja n-08 Ma y-08 S ep-08 Ja n-09 Ma y-09 S ep-09 Ja n-10 Ma y-10 S ep-10 Ja n-11 Ma y-11 S ep-11 Export Import
Source : TurkStat. Betam
Figure 3: Ratio of current account deficit to Figure 4: Ratio of current account deficit to
GDP (yearly) GDP’ growth rate (QoQ. percentage point)
Source: TCMB. TurkStat. Betam * Betam’s forecasts -1.5 -1 -0.5 0 0.5 1 1.5 2 2008 (1 ) 2008 (2 ) 2008 (3 ) 2008 (4 ) 2009 (1 ) 2009 (2 ) 2009 (3 ) 2009 (4 ) 2010 (1 ) 2010 (2 ) 2010 (3 ) 2010 (4 ) 2011 (1 ) 2011 (2 ) 2011 (3 ) 2011 (4 ) 0 2 4 6 8 10 12 200 8( 1) 200 8( 2) 200 8( 3) 200 8( 4) 200 9( 1) 200 9( 2) 200 9( 3) 200 9( 4) 201 0( 1) 201 0( 2) 201 0( 3) 201 0( 4) 201 1( 1) 201 1( 2) 201 1( 3) 201 1( 4)
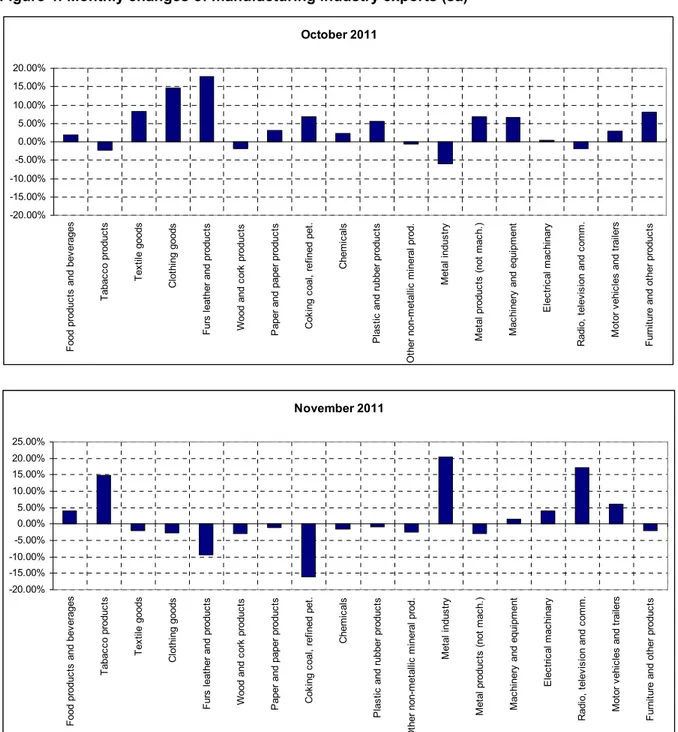
Figure 4: Monthly changes of manufacturing industry exports (sa)
Source: TurkStat. Betam
November 2011 -20.00% -15.00% -10.00% -5.00% 0.00% 5.00% 10.00% 15.00% 20.00% 25.00% F ood pr oduc ts and bev erages T abac co produc ts T ex til e goods C lot hi ng goods F urs leat her and pr oduc ts Wood and co rk produc ts P aper and paper pr oduc ts C ok ing c oal , ref ine d pet . C hem ic al s P las tic and r ubber pro duc ts O ther non-m et allic m in er al p ro d. M et al indus tr y M et al produc ts (not m ac h. ) M ac hi nery and e qui pm ent E lec tr ic al m ac hi nary R adi o, t el ev is ion and c om m . M ot or v ehi cl es and t rai le rs F urni tur e and ot her pr oduc ts October 2011 -20.00% -15.00% -10.00% -5.00% 0.00% 5.00% 10.00% 15.00% 20.00% F ood produc ts and bev erages T abac co produc ts T ex til e goods C lot hi ng goods F urs leat her and produc ts Wood and c or k produc ts P aper and paper produc ts C ok ing c oal , r ef ined pet . C hem ic al s P las tic
and rubber produc
ts O ther non-m et al lic m iner al prod. M et al indus tr y M et al pr oduc ts ( not m ac h. ) M ac hi nery an d equi pm ent E lec tr ic al m ac hi nary R adi o, t el ev is ion and c om m . M ot or v ehi cl es and t rai le rs F ur ni ture and ot her produc ts