DOI 10.3233/ISB-190472 IOS Press
Lower connectivity of tumor coexpression
networks is not specific to cancer
Ertu˘grul Dalgıc¸
a,∗, ¨
Ozlen Konu
b, Zehra Safi ¨
Oz
aand Christina Chan
caDepartment of Medical Biology, Zonguldak B¨ulent Ecevit University School of Medicine, Zonguldak, Turkey bDepartment of Molecular Biology and Genetics, Bilkent University, Ankara, Turkey
cDepartment of Chemical Engineering and Materials Science, Michigan State University, East Lansing, MI, USA
Abstract. Global level network analysis of molecular links is necessary for systems level view of complex diseases like cancer. Using genome-wide expression datasets, we constructed and compared gene co-expression based specific networks of pre-cancerous tumors (adenoma) and cancerous tumors (carcinoma) with paired normal networks to assess for any possible changes in network connectivity. Previously, loss of connectivity was reported as a characteristic of cancer samples. Here, we observed that pre-cancerous conditions also had significantly less connections than paired normal samples. We observed a loss of connectivity trend for colorectal adenoma, aldosterone producing adenoma and uterine leiomyoma. We also showed that the loss of connectivity trend is not specific to positive or negative correlation based networks. Differential hub genes, which were the most highly differentially less connected genes in tumor, were mostly different between different datasets. No common gene list could be defined which underlies the lower connectivity of tumor specific networks. Connectivity of colorectal cancer methylation targets was different from other genes. Extracellular space related terms were enriched in negative correlation based differential hubs and common methylation targets of colorectal carcinoma. Our results indicate a systems level change of lower connectivity as cells transform to not only cancer but also pre-cancerous conditions. This systems level behavior could not be attributed to a group of genes.
Keywords: Colorectal cancer, network analysis, gene co-expression, systems biology ORCID: 0000-0003-0536-4447
1. Introduction
Various studies have associated certain net-work level (topological) features to cancer [1–6]. Studies using protein-protein interaction networks showed that differentially expressed or mutated gene products in cancer are highly connected [1, 2]. Since, protein-protein interaction networks are less condition-specific than gene expression-based net-works, these studies give only a stationary view of cancer related genes. Gene co-expression based large scale condition specific networks could be
topo-∗Corresponding author: Ertugrul Dalgic, Zonguldak B¨ulent
Ecevit Universitesi Tip Fakultesi Dekanligi, Tibbi Biyoloji Anabilim Dali, Zonguldak, 67600, Turkey. Tel.: +90 3722613170; Fax: +90 3722610264; E-mail: [email protected].
logically analyzed and compared to reveal possible system-level changes [5, 7]. It was shown that the co-expression networks of colorectal, non-small cell lung, gastric, pancreatic and cervical cancers have lower connectivity as compared to normal samples [5]. Having the same observation for the various cancer types suggests the system level loss of con-nectivity could be a specific network characteristic of cancer. However, it is unclear how the connec-tivity changes progress during cancer development. Thus, the presence of datasets for a pre-cancerous stage (adenoma) and a cancerous stage (carcinoma) provides an opportunity for comparing network char-acteristics of the different phases during colorectal cancer progression at a systems level. Thus, one might gain some insight into the evolution of global 1386-6338/18/19/$35.00 © 2018/2019 – IOS Press and the authors. All rights reserved
gene relationships during the advancement of a non-malignant tumor (adenoma) to a malignant (car-cinoma) tumor. Furthermore, to obtain more reliable results in comparative studies, it is important to use matched tissue samples, such that both tumor and adjacent normal tissue samples are obtained from the same individual. We performed a comparative topo-logical analysis based on gene expression values from matched normal-tumor samples.
2. Results and discussion
2.1. Loss of connectivity in colorectal tumor networks
We constructed specific co-expression networks by using gene expression datasets from colorectal adenoma and colorectal carcinoma patient samples. The normal and tumor samples of the datasets were derived from the same patient and were paired. The networks consisted of pairs of highly expressed and varied genes with a significant differential Pearson Correlation Coefficient (PCC) value (see Methods). Several preprocessing steps eliminated genes or gene pairs, such as the genes with low expression levels based on an arbitrary threshold value. The preprocessing steps (differential correlation effect, correlation method; Pearson or Spearman, variation method; standard deviation or quartile coefficient of dispersion) and the threshold values (PCC value threshold, low expression threshold, low variation threshold) had no significant influence on our obser-vations (see Appendix).
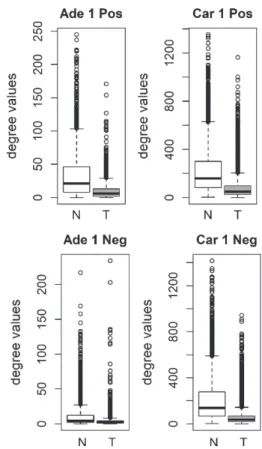
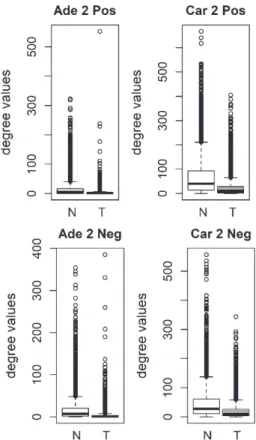
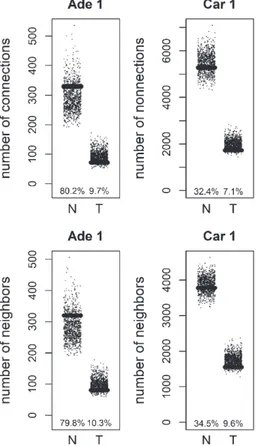
We compared the specific networks of the tumors to their respective paired normal networks. Positive and negative gene-gene correlations were analyzed separately. To gain an understanding of the connec-tivity changes in colorectal cancer, degree values of genes in tumor networks were compared to paired normal networks. The degree values in tumor net-works were lower than their paired normal datasets, for both adenoma and carcinoma (Fig. 1). The differ-ence between the normal and tumor was statistically significant (Mann-Whitney paired one-sided test p-value < 10−145). The same result was observed for both positive and negative correlation based net-works. In order to confirm this observation, we analyzed a second independent dataset (see Meth-ods). We observed the same results for the second dataset (Fig. 2, Mann-Whitney paired one-sided test p-value < 10−200). In addition to degree values, other
Fig. 1. Comparison of degree values for Normal (N) and Tumor (T) samples, in colorectal adenoma (Ade 1; GSE8671 dataset) and col-orectal carcinoma (Car 1; GSE18105 dataset). Positive (Pos) and Negative (Neg) correlations were analyzed and showed separately.
topological parameters of the tumor and normal net-works were also analyzed (Table 1). In general, tumor networks had parameters suggesting lower connectivity. For instance tumor networks had higher characteristic path length (average of shortest path lengths) than normal networks.
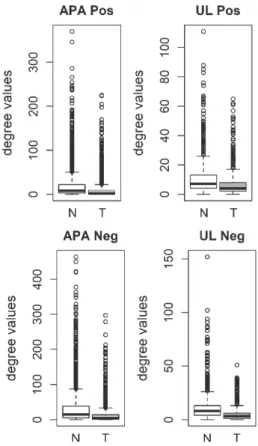
We also analyzed the degree distributions of two different pre-cancerous tumors, which were aldosterone producing adenoma (APA) and uterine leiomyoma (UL). Specific coexpression networks for APA and UL were constructed similarly and the degree values of genes in tumor networks were com-pared to paired normal networks. For both APA and UL, the degree values in tumor networks were lower than their paired normal datasets (Fig. 3). The differ-ence between the normal and tumor was statistically significant (Mann-Whitney paired one-sided tests; APA p-value < 10−268, UL p-value < 10−56).
Our results confirmed a previous report by Anglani et al. [5], where the colorectal carcinoma tumor net-work was significantly less connected than its paired normal specific network. Additionally, we observed
Fig. 2. Comparison of degree values for Normal (N) and Tumor (T) samples, in colorectal adenoma (Ade 2; GSE89076 dataset) and carcinoma (Car 2; GSE89076 dataset). Positive (Pos) and Negative (Neg) correlations were analyzed and showed separately.
the loss of connectivity trend in not only colorec-tal carcinoma but also in coloreccolorec-tal adenoma, which is considered a pre-cancerous disease stage [8]. We
also observed the same trend in two different pre-cancerous tumor types. Our observations suggest the loss of connectivity as a common systems-level trend, and it could be be initiated at an earlier stage of car-cinogenesis.
2.2. Differentially less connected genes and differential hubs
We observed the same topological change in different datasets which were generated by differ-ent microarray platforms (see Methods). We, next, focused on colorectal tumors to investigate which genes underlie the less connectivity trend. The genes in the paired normal networks of different colorectal tumor datasets, based on positive or negative coex-pression, had mostly low overlap, shown by Jaccard index (Table 2). Only the positive and negative cor-relation based networks of the same dataset (such as Ade1Pos and Ade1Neg) showed a high overlap. Therefore, the networks which all lost connectivity, mostly shared a low fraction of members. Next, we analyzed the genes which had less degree value in tumor specific network compared to paired normal specific network. Jaccard index values of the different colorectal tumor networks as well as randomization based p-values for Jaccard index values were calcu-lated (see Methods). There were mostly low overlap values between various differentially less connected genes, however, the overlap values were mostly statis-tically significant (Table 3). For instance, the positive and negative correlation based networks of Adenoma Table 1
Statistical topological parameters of Positive Correlation based Normal Networks (PCNN), Positive Correlation based Tumor Networks (PCTN), Negative Correlation based Normal Networks (NCNN), and Negative Correlation based Tumor Networks (NCTN) for colorectal
adenoma 1 (Ade 1), colorectal adenoma 2 (Ade 2), colorectal carcinoma 1 (Car 1) and colorectal carcinoma 2 (Car 2) datasets Number Number Density Average Clustering Diameter Characteristic Number of Power Power law
of of Degree Coefficient path connected law fit R
Nodes Edges length components value squared
Ade 1 PCNN 2820 45677 0.01 32.40 0.02 4 2.64 1 0.97 0.26 Ade 1 PCTN 2812 14688 0.004 10.45 0.01 7 3.56 1 1.75 0.65 Ade 1 NCNN 2815 16559 0.004 11.77 0.01 7 3.38 1 1.50 0.65 Ade 1 NCTN 2669 5509 0.002 4.13 0.002 11 5.11 6 2.12 0.86 Ade 2 PCNN 4724 60392 0.005 25.57 0.01 6 2.90 1 1.36 0.56 Ade 2 PCTN 3712 5675 0.001 3.06 0.005 15 5.43 68 1.68 0.79 Ade 2 NCNN 4721 73217 0.01 31.02 0.01 5 2.79 1 1.24 0.46 Ade 2 NCTN 4105 8093 0.001 3.94 0.005 13 5.00 30 1.83 0.83 Car 1 PCNN 7880 863446 0.03 219.15 0.04 3 1.99 1 1.07 0.25 Car 1 PCTN 7880 317777 0.01 80.65 0.02 4 2.39 1 1.48 0.48 Car 1 NCNN 7880 776269 0.03 197.02 0.03 3 2.00 1 1.18 0.31 Car 1 NCTN 7880 222308 0.01 56.42 0.01 4 2.61 1 1.58 0.57 Car 2 PCNN 6090 202178 0.01 66.40 0.02 4 2.44 1 1.25 0.38 Car 2 PCTN 6089 70276 0.004 23.08 0.01 6 3.02 1 1.50 0.59 Car 2 NCNN 6090 139454 0.01 45.80 0.01 4 2.66 1 1.25 0.40 Car 2 NCTN 6089 66193 0.004 21.74 0.01 6 3.08 1 1.52 0.60
Fig. 3. Comparison of degree values for Normal (N) and Tumor (T) samples, in aldosterone producing adenoma (APA; GSE60042 dataset) and uterine leiomyoma (UL; GSE31699 dataset). Positive (Pos) and Negative (Neg) correlations were analyzed and showed separately.
2 dataset (Ade2Pos and Ade2Neg) had a Jaccard value of 0.85 with a p-value of 0.001, therefore the less connectivity trend of these two sample sets were mostly based on the same set of genes. However, the negative correlation based networks of Carci-noma 1 dataset (Car1Neg) and AdeCarci-noma 1 dataset (Ade1Neg) had a Jaccard value of 0.19 with a p-value of 0.965, therefore the less connectivity trend of these two sample sets were not based on a com-mon set of genes. Hence, the presence of low Jaccard index values and high p-values showed that there was not a common set of gene list underlying the less connectivity trend in all colorectal tumor based net-works. However, there were some common gene lists which could be underlying the less connectivity trend of some networks such as the various networks of Adenoma 1 and Adenoma 2 datasets.
The topology of the colorectal tumor gene coex-pression networks were mostly weakly similar to scale-free networks (Table 1, see Appendix). Hub genes, the most highly connected genes, could be
Table 2
Jaccard index values of the coexpression networks of normal samples
Table 3
Jaccard index values of differentially less connected genes (upper value) and the p-values for the overlap (lower value)
considered responsible for most of the connectiv-ity of the networks. We examined the differential hub genes, which were the most highly differen-tially connected genes, thus greatly contributed to the loss of connectivity. Therefore, the less connectivity trend in tumor networks were investigated by ana-lyzing the lists of differential hub genes. Top 5% of genes were selected as differential hubs, based on the difference of the degree values between tumor and normal networks. Differential hub gene lists were defined for two separate colorectal tumor datasets for positive and negative correlations. Pairwise compar-ison of differential hubs between different networks
Table 4
Jaccard index values of the differential hubs (top 5% most highly differentially less connected genes) (upper value) and the p-values
for the overlap (lower value)
showed a very low overlap (Table 4). Jaccard index values ranged from 0.00 to a maximum of 0.13. How-ever, some differential hub pairs had a significant overlap suggesting that some common hub genes could underlie the differential connectivity trend for some cases. However, there were also some non-significant hub pairs (Table 4). In addition, there was no common gene among the hub lists. There was not also any common gene among hubs, when positive and negative correlation based networks were considered separately. These values indicate that no common list of important differential hub genes could be defined, therefore, different genes were responsible for the less connectivity of differ-ent tumor networks. Furthermore, we selected the direct neighbors of differential hub genes to gen-erate the hub neighborhoods. Pairwise comparison of the hub neighborhoods showed a greater over-lap, with Jaccard index values ranging from 0.04 to 0.99 (Table 5). However, the overlap of hub neigh-borhoods was mostly nonsignificant, so that these overlap values were randomly expected (Table 5). Therefore, differential hubs mostly have different dif-ferential connections among various colorectal tumor based networks. Thus, the presence of low overlap values and the lack of all significant Jaccard index values indicate that no common gene neighborhood
Table 5
Jaccard index values of the differential hub neighborhoods in the normal specific networks and the p-values for the overlap (lower
value)
is responsible for the loss of connectivity in colorectal tumors.
We also performed a functional gene set enrich-ment analysis for differential hub genes (see Meth-ods). Interestingly, the differential hubs obtained from positive correlation based networks did not have any significant gene ontology terms, whereas the negative correlation based differential hubs had several terms such as ‘extracellular space’, ‘extra-cellular matrix’, etc. (Table 6). Ade1Neg, Ade2Neg and Car2Neg shared ‘extracellular exosome’ as a significant term. In addition, Car1Neg also had ‘extra-cellular exosome’ with 21% coverage, however its Benjamini corrected p-value was 0.08, therefore it was omitted in Table 6. Thus, all negative correlation based differential hubs had an association with extra-cellular exosome. When we analyzed the overlaps among the extracellular exosome associated negative correlation based differential hubs, there was no com-mon gene acom-mong all 4 datasets; adenoma datasets did not share any gene, whereas carcinoma samples shared only 5 genes; FBXO2 (F-box protein 2), GPC1 (glypican 1), NEU1 (neuraminidase 1), PHGDH (phosphoglycerate dehydrogenase), and RARRES2 (retinoic acid receptor responder 2). Overall, differ-ential hubs generated from negative correlation based networks had an enrichment of genes which were
Table 6
Functional Gene Set Enrichment Values of Differential Hubs in Colorectal Samples and Common Methylation Targets of Carcinoma Networks
Gene Set Percentage of Benjamini
Genes (%) Corrected p-value
Ade 1 Pos – – –
Ade 2 Pos – – –
Ade 1 Neg O-glycan processing 7.4 0.0003
Extracellular space 22.3 0.0003
Extracellular exosome 27.7 0.046
Ade 2 Neg Extracellular matrix 8.0 0.0003
Extracellular space 15.9 0.003 Extracellular exosome 24.4 0.01 Plasma membrane 30.1 0.017 Heparin binding 6.2 0.0004 Car 1 Pos – – – Car 2 Pos – – –
Car 1 Neg Trans-Golgi network 3.4 0.025
Car 2 Neg Oxidation-reduction process 10.7 0.0013
Xenobiotic metabolic process 3.9 0.0075
Platelet degranulation 3.9 0.048
Extracellular exosome 26.2 0.0004
Blood microparticle 4.4 0.0025
Extracellular space 14.6 0.0056
Pyridoxal phosphate binding 3.4 0.01
Common Methylation Targets of Carcinoma Networks
Extracellular matrix organization 9.2 0.001
Planar cell polarity pathway involved in neural tube closure 3.3 0.037
Digestive tract morphogenesis 3.3 0.032
Extracellular space 20.8 0.0007
Extracellular matrix 9.2 0.0019
Basement membrane 5.0 0.0091
Plasma membrane 36.7 0.016
Sequence-specific DNA binding 14.2 0.0001
Calcium ion binding 12.5 0.035
RNA polymerase II core promoter proximal region sequence-specific DNA binding
8.3 0.049
Heparin binding 5.8 0.043
related to extracellular exosome, however, no com-mon gene list was responsible for this enrichment. 2.3. Mutation and methylation targets with less connectivity in tumor
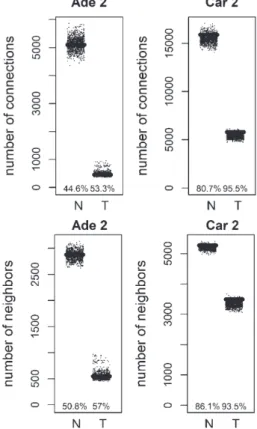
We analyzed the distribution of the degree values of mutation and methylation target genes for colorectal tumors. Mutation targets did not show a statistically significant degree distribution (see Appendix). Next, the degree distribution of methylation targets was compared to random gene lists. Methylation was pre-viously linked to loss of connectivity in colorectal cancer [9]. Genes with significantly higher methy-lation levels in colon cancer were obtained from COSMIC database [10]. Methylation targets, showed a decrease of connectivity in tumor samples, similar to the overall network (Figs. 4, 5). When compared to random distribution, methylation targets, had higher
connectivity in tumor samples of positive correla-tion based networks of colorectal carcinoma datasets (Figs. 4, 5). The connection and unique neighbor number distributions were close to being significant in the tumor networks of carcinoma 1, and car-cinoma 2. There were 199 methylation targets in the colorectal carcinoma 1 tumor network, whereas there were 233 methylation targets in the colorec-tal carcinoma 2 tumor network. 120 of them were common. Functional gene set enrichment of these common methylation targets showed extracellular-related terms (Table 6). This was similar to the enrichment results for the negative correlation based differential hubs. There was no consistent significant distribution in the other networks (normal and tumor networks of adenoma 1 and 2, and normal networks of carcinoma 1 and 2). There was also no consistent sig-nificant distribution of methylation targets in negative correlation based networks (results not shown).
Fig. 4. Total number of connections and unique number of neigh-bors of methylation targets compared to random lists for Normal (N) and Tumor (T) samples of positive correlation based networks of colorectal adenoma 1 (Ade 1; GSE8671 dataset) and colorectal carcinoma 1 (Car 1; GSE18105 dataset). The percentage of random values with lower values than methylation targets was shown.
3. Conclusion
In this study, we showed a trend for lower con-nectivity between genes in the gene coexpression networks of colorectal adenoma and carcinoma as well as aldosterone producing adenoma and uterine leiomyoma. The results suggest a loss of coexpres-sion in tumors, starting from precancerous stages. Our results confirm other studies suggesting that biological systems lose coherence when exposed to perturbations [11]. Thus, the loss of coherence starts from earlier stages than malignancy. We lim-ited our analysis only to those datasets which included paired normal-tumor samples from patients, therefore our conclusions about the transformation of normal networks to tumor networks are stronger than conclu-sions made from nonpaired normal-tumor network analysis. We analyzed 4 different datasets of 3 differ-ent types of pre-cancerous stages, which was limited by available public data. Future work should include more pre-malignant tumors so that a stronger conclu-sion could be made for the system level connectivity change of different tumor types. Additionally, future
Fig. 5. Total number of connections and unique number of neigh-bors of methylation targets compared to random lists for Normal (N) and Tumor (T) samples of positive correlation based networks of colorectal adenoma 2 (Ade 2; GSE89076 dataset) and colorectal carcinoma 2 (Car 2; GSE89076 dataset). The percentage of random values with lower values than methylation targets was shown.
studies could include more tumor stages to fully describe the stage by stage transformation of tumor networks, so that we could have a topological view of carcinogenesis. We also showed that no particular genes could be defined as being responsible for the loss of connectivity trend. There was mostly low or nonsignificant overlap among differentially less con-nected genes or differential hubs. Functional gene set enrichment analysis suggested exosome related genes to be enriched among differential hubs which were highly less connected in negative correlation based networks of tumor, when compared to paired normal networks. Lastly, methylation targets had higher con-nectivity values in the tumor networks of colorectal carcinoma samples. These genes also had enrich-ment of extracellular-associated gene ontology terms. Future studies could investigate more on the rea-sons for the loss of negative correlations of exosome related genes during tumorigenesis and the unex-pectedly higher connectivity levels of extracellular
space related methylation targets in colorectal carci-noma. Results from these studies could enable a better system level understanding of cancer so that more efficient perturbation strategies could be developed based on cancer system design principles.
4. Methods
4.1. Gene expression datasets
We collected patient-derived, paired tumor and normal (adjacent tissue to tumor) sample gene expres-sion data from NCBI GEO database (http://www. ncbi.nlm.nih.gov/geo/). The datasets in this study included 2 datasets for colorectal adenoma (GSE8 671, GSE89076) and 2 datasets for colorectal carcinoma (GSE18105, GSE89076), 1 dataset for aldosterone producing adenoma (GSE60042) and 1 dataset for uterine leiomyoma (GSE31699). For colorectal adenoma 1, GSM215051-GSM215114 of GSE8671 were used. For colorectal adenoma 2, GSM2358439, GSM2358440, GSM2358441, GSM 2358442, GSM2358443, GSM2358444, GSM2358 471, GSM2358472, GSM2358501, and GSM2358 502 of GSE89076 were used. For colorectal carci-noma 1, GSM452629-GSM452662 of GSE18105 were used. For colorectal carcinoma 2, GSM235 8438, GSM2358445-GSM2358470, GSM2358473-GSM2358516, GSM2358B7:BL7437 of GSE89076 were used. For aldosterone producing adenoma, GSM1464109- GSM1464122 of GSE60042 were used. For uterine leiomyoma, GSM786770- GSM 786801 of GSE31699 were used. The datasets con-tained paired samples from the same patient such that direct comparison can be made between the tumor and normal samples. The platforms of GSE8671 and GSE18105 were Affymetrix Human Genome U133 Plus 2.0 Array. The platform of GSE89076 and GSE60042 were Agilent SurePrint G3 Human GE 8x60K Microarray. The platform of GSE31699 was Illumina HumanHT-12 V3.0 expression bead-chip. The datasets contained paired samples from the same patient such that direct comparison can be made between the tumor and normal samples. For the Affymetrix Microarray based datasets (GSE8671, GSE18105), the raw values were obtained and nor-malized with Bioconductor Affy package Robust Multichip Average (RMA) method [12, 13]. For GSE89076 adenoma and carcinoma datasets, back-ground subtracted processed signal intensity values were obtained and were converted to log values and
quantile normalized. GSE8671 adenoma was denoted as adenoma 1, GSE18105 carcinoma was denoted as carcinoma 1, GSE89076 adenoma was denoted as adenoma 2 and GSE89076 carcinoma was denoted as carcinoma 2. For GSE31699 and GSE40062, already log transformed and quantile normalized values were obtained from NCBI GEO database.
There were 3 criteria for the pre-processing of the normalized datasets, before calculating pairwise correlations between genes. Firstly, there were mul-tiple probeset values for a single gene (based on the NCBI Entrez Gene ID) in microarray datasets, from which we selected only one probeset with the max-imum variation. Secondly, we removed the genes with average expression levels lower than a certain threshold (5), as very low values would cause false-positive correlations. Thirdly, we removed the genes with standard deviation values lower than a certain threshold (0.5), as very lowly varied values would also cause false-positive correlations. The arbitrary thresholds have no effect on our results as shown in the Appendix.
4.2. Co-expression networks
To construct networks with the most informa-tive lists of genes, we collected highly and variably expressed genes (see Appendix). Using these genes, we constructed specific networks for paired normal and tumor samples from adenoma, leiomyoma and carcinoma datasets. To assess for co-expression, PCC values were calculated for normal and tumor sam-ples separately. To test for the significance of the correlation, normal and tumor samples of a dataset were randomized and PCC values were re-calculated and a random value distribution was obtained. From this distribution a one-sided p-value was calculated for higher (or equal) values than the real (non-randomized) dataset PCC value. Then, the p-values were corrected for multiple testing by False Discov-ery Rate (FDR). FDR corrected p-value threshold of 0.05 was used to define significantly correlated gene pairs in normal or tumor samples separately. To denote a connection between a significantly cor-related gene pair in tumor samples a differential correlation threshold was used; PCC value above a threshold (0.5) in tumor samples and a PCC value below a threshold (0.2) in paired normal samples were required. The same approach was taken to denote a connection in normal samples. Defining the con-nections in this way provided us with differential connections. Changing the preprocessing threshold
values (for defining highly and variably expressed genes), the correlation threshold values, and even removing the differential correlation requirement had no effect on our results (see Appendix). Positive and negative gene-gene correlations were consid-ered separately. We constructed weighted positive and negative; normal and tumor networks. In each network, we calculated the degree value of a gene, as the sum of significant correlations of a gene with other genes, excluding the self-correlation. Visual-ization and topological analysis of the networks were performed by using Cytoscape 3.7.1 [14].
4.3. Differentially less connected genes, differential hubs and mutation/methylation targets
Differential degree values of genes were defined based on the difference of the normal network degree value from the tumor network degree value. The genes with positive differential degree values were defined as differentially less connected genes. For selecting differential hubs, differentially less con-nected genes were ranked from the one with the highest degree difference to the one with lowest, top 5% genes from the list were defined as differential hubs. Overlap of network members, differentially less connected genes and differential hubs were analyzed by Jaccard index, which is the ratio of intersection to union for two sets. For significance testing, a back-ground was selected (all genes in the normal network for the analysis of differentially less connected genes, all differentially less connected genes for the dif-ferential hubs) and random lists of the same size were generated and Jaccard index values for random sets were calculated, thus, a random value distribu-tion was obtained. From this distribudistribu-tion a one-sided p-value was calculated for higher (or equal) values than the real (non-randomized) Jaccard index value. Lastly, p-values were corrected for multiple testing by FDR.
Functional gene set enrichment analysis of differ-ential hubs was done by using DAVID 6.8 (https:// david.ncifcrf.gov/home.jsp) [15, 16]. For colorectal adenoma 1 and carcinoma 1 datasets, Affymetrix Human Genome U133 Plus 2.0 Array, for colorec-tal adenoma 2 and carcinoma 2 datasets, Agilent HumanGenome background were used. Significant Gene Ontology terms (Benjamini p-value < 0.05) were shown in Table 6.
Mutation targets were obtained from Cancer Gene Census as of April 2018 (https://cancer.sanger.
ac.uk/census) [17]. Both somatic and germline muta-tion targets of colorectal cancer were selected, which was a total of 50 genes. 11–25 out of 50 genes were in the differential correlation networks. Methylation targets were obtained from COSMIC database (https://cancer.sanger.ac.uk/cosmic) [10]. Genes with significantly higher levels of methylation in colon cancer, compared to normal, were obtained. We omitted the genes, which were grouped in both lower and higher methylation lists. Total number of methylation targets were 746. In the differential cor-relation networks 69–233 of them were present. The degree distribution of mutation targets was compared to random gene lists of the same size.
Acknowledgments
This work was supported by a TUBITAK (The Scientific and Technological Research Council of Turkey) 2232 grant [115C036 to E.D.].
Author contributions
ED, OK, ZSO and CC designed the study, ED performed the computational analysis.
References
[1] S. Wachi, K. Yoneda and R. Wu, Interactome-transcriptome analysis reveals the high centrality of genes differentially expressed in lung cancer tissues, Bioinformatics 21(23) (2005), 4205-4208.
[2] P.F. Jonsson and P.A. Bates, Global topological features of cancer proteins in the human interactome, Bioinformatics
22(18) (2006), 2291-2297.
[3] T. Ideker and R. Sharan, Protein networks in disease,
Genome Res 18(4) (2008), 644-52. doi: 10.1101/gr.071852.
107
[4] Y. Yang, L. Han, Y. Yuan, J. Li, N. Hei and H. Liang, Gene co-expression network analysis reveals common system-level properties of prognostic genes across cancer types,
Nat Commun 5 (2014), 3231. doi: 10.1038/ncomms4231
[5] R. Anglani, T.M. Creanza, V.C. Liuzzi, A. Piepoli, A. Panza, A. Andriulli and N. Ancona, Loss of connectivity in cancer co-expression networks, PLoS One 9(1) (2014), e87075. doi: 10.1371/journal.pone.0087075
[6] J. Wu, X. Zhao, Z. Lin and Z. Shao, A system level analysis of gastric cancer across tumor stages with RNA-seq data,
Mol Biosyst 11(7) (2015), 1925-1932. doi: 10.1039/c5mb
00105f
[7] S.L. Carter, C.M. Brechb¨uhler, M. Griffin and A.T. Bond, Gene co-expression network topology provides a frame-work for molecular characterization of cellular state,
[8] A. Leslie, F.A. Carey, N.R. Pratt and R.J. Steele, The colorectal adenoma-carcinoma sequence, Br J Surg 89(7) (2002), 845-860.
[9] Q. Wang, P. Jia, F. Cheng and Z. Zhao, Heterogeneous DNA methylation contributes to tumorigenesis through inducing the loss of coexpression connectivity in colorectal cancer,
Genes Chromosomes Cancer 54(2) (2015), 110-121. doi:
10.1002/gcc.22224
[10] S.A. Forbes, D. Beare, N. Bindal, S. Bamford, S. Ward, C.G. Cole, M. Jia, C. Kok, H. Boutselakis, T. De, Z. Sondka, L. Ponting, R. Stefancsik, B. Harsha, J. Tate, E. Dawson, S. Thompson, H. Jubb and P.J. Campbell, COSMIC: High-Resolution Cancer Genetics Using the Catalogue of Somatic Mutations in Cancer, Curr Protoc Hum Genet 91 (2016), 10.11.1-10.11.37. doi: 10.1002/cphg.21
[11] A. Lea, M. Subramaniam, A. Ko, T. Lehtim¨aki, E. Raito-harju, M. K¨ah¨onen, I. Sepp¨al¨a, N. Mononen, O. Raitakari, M. Ala-Korpela, P. Pajukanta, N. Zaitlen and J. Ayroles, Genetic and environmental perturbations lead to regulatory decoherence, bioRxiv, 2018. doi: 10.1101/369306 [12] R.A. Irizarry, B. Hobbs, F. Collin, Y.D. Beazer-Barclay, K.J.
Antonellis U. Scherf, T.P. Speed Exploration, normaliza-tion, and summaries of high density oligonucleotide array probe level data, Biostatistics 4(2) (2003), 249-264.
[13] L. Gautier, L. Cope, B.M. Bolstad and R.A. Irizarry, affy– analysis of Affymetrix GeneChip data at the probe level,
Bioinformatics 20(3) (2004), 307-315.
[14] P. Shannon, A. Markiel, O. Ozier, N.S. Baliga, J.T. Wang, D. Ramage, N. Amin, B. Schwikowski and T. Ideker, Cytoscape: A software environment for integrated models of biomolecular interaction networks, Genome Res 13(11) (2003), 2498-2504.
[15] W. Huang da, B.T. Sherman and R.A. Lempicki, Systematic and integrative analysis of large gene lists using DAVID bioinformatics resources, Nat Protoc 4(1) (2009), 44-57. doi: 10.1038/nprot.2008.211
[16] W. Huang da, B.T. Sherman and RA. Lempicki, Bioinfor-matics enrichment tools: Paths toward the comprehensive functional analysis of large gene lists, Nucleic Acids Res
37(1) (2009), 1-13. doi: 10.1093/nar/gkn923
[17] P.A. Futreal, L. Coin, M. Marshall, T. Down, T. Hubbard, R. Wooster, N. Rahman and M.R. Stratton, A census of human cancer genes, Nat Rev Cancer 4(3) (2004), 177-183.
5. Appendix
5.1. Scale-free distribution
Degree distribution of most networks in this study was weakly similar to scale-free topology. An exam-ple distribution was shown below (Fig. 6).
5.2. Analysis of preprocessing steps
Using the GSE8671 colorectal adenoma dataset, we experimented with the preprocessing steps and analyzed the possible effects on the networks. We omitted the randomization based assessment of sig-nificant correlations in these trials of the effects of preprocessing. Firstly, we examined various dif-ferential correlation thresholds, based on PCC. We analyzed positive and negative correlation separately. First, no differential correlation was required; so only a correlation threshold of 0.5 was used. In each case tumor network was significantly less con-nected for both positive and negative correlation (p-value < 10−33, paired Mann-Whitney test). Next, differential correlation was required; so that a corre-lation difference of at least 0.1 was required between the paired normal-tumor samples, in addition to the correlation threshold of 0.5. In each case tumor network was significantly less connected for both positive and negative correlation (p-value < 10−34, paired Mann-Whitney test). Next, correlation differ-ence threshold was raised to 0.3. Tumor network was significantly less connected for both positive and
Fig. 6. Degree distribution of colorectal adenoma 1 positive cor-relation based tumor network. Distribution of degree values were shown as open circles. Power-law fit line was shown as a solid line. Power value was 1.75 with an R squared value of 0.65.
Fig. 7. Comparison of degree values for Normal (N) and Tumor (T) samples, in colorectal adenoma (GSE8671 dataset). Positive and negative correlations were analyzed and showed separately. Networks were constructed by a PCC threshold of 0.8.
negative correlation (p-value < 10−34, paired Mann-Whitney test). This analysis showed that the differen-tial correlation threshold does not have an impact on the less connectivity trend of tumor networks com-pared to normal. The only effect of the differential correlation is the reduction in degree values.
We examined various PCC threshold values. Dif-ferential correlation was omitted. First, we used the correlation threshold of 0.4. In each case tumor network was significantly less connected for both positive and negative correlation (p-value < 10−35, paired Mann-Whitney test). Next, we tested the cor-relation threshold of 0.8. In each case tumor network was significantly less connected for both positive and negative correlation (Fig. 7, p-value < 10−4, paired Mann-Whitney test). This analysis showed that the correlation threshold does not have an impact on the less connectivity trend of tumor networks compared to normal.
We tried both Spearman and Pearson correlation tests for the construction of the specific networks. Spearman correlation gave the same result as tumor networks were significantly less connected for both positive and negative correlation (p-value < 10−16, paired Mann-Whitney test).
Genes with very low expression values can cause false positive results in correlation analysis. We chose arbitrary average expression cutoff values to remove the genes with values lower than the selected thresh-old. Considering the distribution of the average gene
Fig. 8. Total number of connections and unique number of neigh-bors of mutation targets compared to random lists for Normal (N) and Tumor (T) samples of positive correlation based networks of colorectal adenoma (Ade1; GSE8671 dataset) and colorectal car-cinoma (Car 1; GSE18105 dataset). The percentage of random values with lower values than mutation targets was shown.
expression values, we constructed specific networks for normal and tumor samples, with the low expres-sion thresholds of 3, 5 and 7. The original dataset had 20186 genes, which was based on NCBI Entrez Gene ID. The threshold of 3 reduced the number of genes to 19821. The low variation threshold of 0.5, resulted in 3472 genes. Tumor networks were significantly less connected for both positive and negative correlation (p-value < 10−89, paired Mann-Whitney test). The threshold of 5 reduced the number of genes to 12046. After applying the low variation threshold of 0.5, there were 2774 genes. The tumor network was significantly less connected for both positive and negative correlation (p-value < 10−34, paired Mann-Whitney test). Finally, the threshold of 7 reduced the number of genes to 5624. After apply-ing the low variation threshold of 0.5, there were 1130 genes. The tumor network was significantly less connected for both positive and negative corre-lation (p-value < 10−17, paired Mann-Whitney test).
Fig. 9. Total number of connections and unique number of neigh-bors of mutation targets compared to random lists for Normal (N) and Tumor (T) samples of positive correlation based networks of colorectal adenoma (Ade 2; GSE89076 dataset) and colorectal car-cinoma (Car 2; GSE89076 dataset). The percentage of random values with lower values than mutation targets was shown.
Increasing the low expression cut-off value decreased the number of genes in the network and resulted in lower degree values. However, in each case, normal networks had significantly higher degree values than tumor networks and the low expression threshold value did not have any effect on this result.
Genes with very low variation across samples can also cause false positive results in correlation analysis. Therefore, we chose arbitrary low varia-tion thresholds based on standard deviavaria-tion. Using the quartile coefficient of dispersion instead of stan-dard deviation did not affect the results. For instance, using the quartile coefficient of dispersion threshold of 0.035 resulted in 2315 genes, and both pos-itive and negative correlation based networks of tumor were significantly less connected than nor-mal (p-value < 10−30, paired Mann-Whitney test). The standard deviation threshold values of 0.4, 0.5 and 0.6 resulted in 4866, 2774, and 1567 genes to build correlation networks. In each case both
pos-itive and negative correlation based networks of tumor were significantly less connected than nor-mal (p-value < 10−19, paired Mann-Whitney test). Increasing the variation threshold made the networks smaller, however the trend of less degree values in the tumor networks remained the same.
5.3. Mutation targets with less connectivity in tumor
Common mutation targets in colorectal cancer were obtained from Cancer Gene Census [17]. The degree distribution of mutation targets was compared to random gene lists of the same size. Considering only positive correlation based networks, mutation
targets had lower degree values in tumor compared to normal network for both adenoma and carcinoma samples but their degree values were not statisti-cally significant (Figs. 8, 9). When unique number of neighbors instead of the total number of connec-tions were considered, a similar trend was observed (Figs. 8, 9). Similarly, mutation targets had lower degree values in tumor compared to normal network for both adenoma and carcinoma samples in nega-tive correlation based networks and the degree values of mutation targets were not statistically significant (results not shown).