Full Terms & Conditions of access and use can be found at
https://www.tandfonline.com/action/journalInformation?journalCode=wqah20
Journal of Quality Assurance in Hospitality &
Tourism
ISSN: 1528-008X (Print) 1528-0098 (Online) Journal homepage: https://www.tandfonline.com/loi/wqah20
The Relationship Between Destination
Performance, Overall Satisfaction, and Behavioral
Intention for Distinct Segments
Seyhmus Baloglu PhD , Aykut Pekcan , Shiang-Lih Chen & Joceline Santos
To cite this article: Seyhmus Baloglu PhD , Aykut Pekcan , Shiang-Lih Chen & Joceline Santos (2004) The Relationship Between Destination Performance, Overall Satisfaction, and Behavioral Intention for Distinct Segments, Journal of Quality Assurance in Hospitality & Tourism, 4:3-4, 149-165, DOI: 10.1300/J162v04n03_10
To link to this article: https://doi.org/10.1300/J162v04n03_10
Published online: 08 Sep 2008.
Submit your article to this journal
Article views: 349
Between Destination Performance,
Overall Satisfaction,
and Behavioral Intention
for Distinct Segments
Seyhmus Baloglu
Aykut Pekcan
Shiang-Lih Chen
Joceline Santos
SUMMARY. Destination performance, visitor satisfaction, and
favor-able future behavior of visitors are key determinants of destination com-Seyhmus Baloglu is Associate Professor and Joceline Santos is PhD Candidate, University of Nevada Las Vegas.
Aykut Pekcan is affiliated with Bilkent University, School of Tourism and Hotel Management.
Shiang-Lih Chen is Assistant Professor, Widener University, School of Hospitality Management.
Address correspondence to: Seyhmus Baloglu, PhD, Associate Professor, Univer-sity of Nevada Las Vegas, William F. Harrah College of Hotel Administration, Depart-ment of Tourism and Convention Administration, 4505 Maryland Parkway, Box 456023, Las Vegas, NV 89154-6023 (E-mail: [email protected]).
A condensed version of this article was published in the proceedings of Eleventh Annual World Business Congress of IMDA, which was held in Antalya, Turkey, July 10-14, 2002.
[Haworth co-indexing entry note]: “The Relationship Between Destination Performance, Overall Satis-faction, and Behavioral Intention for Distinct Segments.” Baloglu, Seyhmus et al. Co-published simulta-neously in Journal of Quality Assurance in Hospitality & Tourism (The Haworth Hospitality Press, an imprint of The Haworth Press, Inc.) Vol. 4, No. 3/4, 2003, pp. 149-165; and: Current Issues and Development in Hos-pitality and Tourism Satisfaction (ed: John A. Williams and Muzaffer Uysal) The Haworth HosHos-pitality Press, an imprint of The Haworth Press, Inc., 2003, pp. 149-165. Single or multiple copies of this article are available for a fee from The Haworth Document Delivery Service [1-800-HAWORTH, 9:00 a.m. - 5:00 p.m. (EST). E-mail address: [email protected]].
http://www.haworthpress.com/web/JQAHT 2003 by The Haworth Press, Inc. All rights reserved.
petitiveness. Most empirical work, assuming that overall tourist population is homogenous, investigates the relationships among product perfor-mance, satisfaction, and/or behavioral intentions in an aggregated man-ner. This study investigates these linkages for different segments of Canadian visitors of Las Vegas. The findings confirmed the mediating role of overall satisfaction for both segments and aggregated sample, and re-vealed variations in linkages and explanatory power of the models. The study concludes that the segment-based approach is more pragmatic be-cause it provides segment-specific implications for destination manage-ment and marketing.[Article copies available for a fee from The Haworth Document Delivery Service: 1-800-HAWORTH. E-mail address: <docdelivery@ haworthpress.com> Website: <http://www.HaworthPress.com> © 2003 by The Haworth Press, Inc. All rights reserved.]
KEYWORDS. Destination performance, satisfaction, behavioral
inten-tion, segmentainten-tion, path analysis, Canadian visitors
INTRODUCTION
The performance of a tourist destination and satisfaction of visitors with the destination are of paramount importance to the destination competitiveness since the pleasantness of the experience is more likely to influence visitors’ future behavior. There has been a noticeable increase in the number of stud-ies focusing on destination performance and satisfaction and how they are re-lated to revisitation intention and word-of-mouth behavior of travelers (Pizam, Neumann & Reichel, 1978; Pearce, 1980; Chon, 1992; Pizam & Milman, 1993; Ryan, 1995; Danaher & Arweiler, 1996; Yuksel & Rimmington, 1998; Kozak & Rimmington, 2000).
Most empirical work on tourist satisfaction, however, investigates the rela-tionships among product (attribute) performance, satisfaction, and behavioral intentions, in an aggregated manner (i.e., assuming that overall tourist popula-tion is homogenous). Tourist destinapopula-tions often offer a variety of products and tourists appealed to a destination are not a homogenous market. It is very likely that not only perceived importance of destination attributes, but also the per-ceived performance of the attributes and future behavior may differ from one segment to another. Pizam and Milman (1993) argued that when investigating tourist satisfaction, the analysis should be conducted separately for different segments because the importance of destination attributes may vary with market segments. The authors, using expectancy-disconfirmation paradigm,
examined the relationship between attribute-based satisfaction and overall sat-isfaction for three segments based on reasons for travel such as sun and sea, culture, and friends and relatives, and found that different destination attrib-utes contributed to overall satisfaction for each segment. Their analyses also showed that the segment-specific approach increased the explanatory power of the model in predicting overall satisfaction.
The purpose of this study is to investigate the relationship among attribute-based destination performance, overall satisfaction, and behavioral intention (return intention and recommendation) for Canadian visitors to Las Vegas. The study, however, examines these relationships for distinct benefit (socio-psychological motivations)-visitor status (first-time and repeat visitors) seg-ments separately to understand variations and similarities in hypothesized linkages due to unique nature of the segments. It also compares the model tested on aggregate data to the models tested for distinct segments in terms of similarities and differences, as well as the explanatory power of the models.
This study follows a procedure similar to the work of Pizam and Milman (1993), but it differs from it from several perspectives. First, it uses socio-psychological (push) motivations rather than destination attributes sought (pull motivations) to reveal the benefits segment. Second, the model includes attribute-based performance, operationalized by performance-only measures, and behavioral intention. Compared to Oliver’s (1980) expectancy disconfirmation theory, performance-only measure appears to be the lesser of the devil in the literature. The performance-only measure also outper-formed other alternative operationalizations in terms of predicting overall satisfac-tion and behavioral intensatisfac-tion (Crompton & Love, 1995; Baker & Crompton, 2000; Yuksel & Rimmington, 1998; Yuksel & Yuksel, 2001). Therefore, in this study, destination performance was assessed by performance-only measures. Finally, the model is tested for both first-time and repeat visitors rather than first-time visitors only.
LITERATURE REVIEW
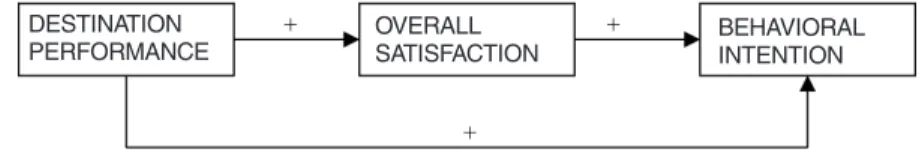
The relationships among perceived (attribute-based) performance, satis-faction, and behavioral intention have been investigated to a great extent in the literature and linkages are well-established by empirical studies (see Yi, 1990; Cronin & Taylor, 1992; Tse & Wilton, 1988; Fornell, Johnson, Anderson, Cha, & Bryant, 1996; Baker & Crompton, 2000; Szymanski & Henard, 2001). Therefore, they will not be repeated here in detail. The model in Figure 1 shows the hypothesized linkages among destination perfor-mance, overall satisfaction and behavioral intention. The literature reviews on customer satisfaction and perceived performance conducted by several
researchers have suggested that satisfaction is positively related to behav-ioral intent measures such as recommendation (positive word-of-mouth) and return intention (e.g., Yi, 1990; Oh & Parks, 1997). The empirical work on tourist satisfaction also demonstrated the usefulness of examining the effect of experience attributes on overall satisfaction to understand the relative con-tribution of product/service attributes to overall experience and/or behav-ioral intention (Pizam & Milmann, 1993; Yuksel & Rimmington, 1998; Kozak & Rimmington, 2000).
The Relationship Among Model Variables
The perceived performance strongly influences customer satisfaction (Chur-chill & Surprenant, 1982; Tse & Wilton, 1988; Patterson, 1993). According to proposed framework for linkages between trust, satisfaction, and loyalty by Singh and Sirdeshmukh (2000), post-purchase performance perceptions/ evaluations positively influence satisfaction. Understanding the effect of attribute-based performance on overall satisfaction enables firms to identify determi-nants of the overall satisfaction (Mittal, Katrichis, & Kumar, 2001). The attrib-ute-based performance also directly and positively influences behavioral intention (Yuksel & Rimmington, 1998; Baker & Crompton, 2000). The model proposed by Baker and Crompton (2000) posited that attribute-based perfor-mance positively influences both satisfaction and behavioral intention. The findings showed that performance influences behavioral intention both di-rectly and indidi-rectly through satisfaction. Therefore, the following hypotheses are proposed:
Hypothesis 1: Destination performance has a positive impact on overall satisfaction with destination.
Hypothesis 2: Destination performance has a positive impact on behav-ioral intention for destination.
DESTINATION PERFORMANCE OVERALL SATISFACTION BEHAVIORAL INTENTION
FIGURE 1. The Relationship Among Performance, Overall Satisfaction, and Behavioral Intention
Szymanski and Henard (2001) conducted a detailed meta-analysis of the customer satisfaction literature. The authors confirmed that performance posi-tively influences satisfaction, and overall satisfaction has a positive impact on repurchase intentions. The overall satisfaction has been found a good and strong predictor of repurchase intention because it represents a global evalua-tion and general attitudinal construct (Anderson, Fornell, & Lehmann, 1994; Mittal, Katrichis, & Kumar, 2001; Jones & Suh, 2000). The American Cus-tomer Satisfaction Index (ACSI) model of Fornell et al. (1996) posited overall satisfaction as key mediating variable between performance and repeat behav-ior. This leads to following hypothesis:
Hypothesis 3: Overall satisfaction with destination has a positive impact on behavioral intention for destination.
The Influence of Market Segments on Model Linkages and Segmentation Base
The segments have varying preferences and benefits sought. For different customer segments, varying destination attributes would determine overall sat-isfaction and behavioral intention. The socio-psychological motivations for travel (benefits-sought) and visitor status (first-time and repeat visitors) have been the most frequently used segmentation base in travel and tourism and found useful and effective by both academicians and practitioners. First-time and repeat visitors often represent two distinct segments to a destination and their evaluation of destinations attributes is different (Fakeye & Crompton, 1991). The level of tourist experience with a destination would be different for first-time and repeat visitors because of their expertise and expectations. For example, Crompton and Love (1995) have found that correlations between at-tribute-based evaluations and overall assessment were higher for the first time visitors. Likewise, the benefits sought or push motivations to visit destinations have tremendous impact on visitors’ attitudes, satisfaction and future behavior of their inherent effect on cognitive and affective process as well as behavior (Woodside & Jacobs, 1985; Uysal & Hagan, 1993, Baloglu & Uysal, 1996, Baloglu, 2000; Frochot & Morrison, 2000). The benefit segmentation potentially pro-vides wide implications for product development and revision, product bundles and packaging, promotion, and performance assessment (Baloglu & Uysal, 1996; Frochot & Morrison, 2000).
These all suggest that the relative contribution of destination performance attributes to global evaluations would be different for distinct segments. The segment-specific satisfaction, whether distinct segments develop their satis-faction and behavioral intentions based on different service aspects, has also
been emphasized in recent literature review of customer satisfaction con-ducted in hospitality and tourism (Yuksel & Yuksel, 2001, p. 101). Recently, Uysal and Williams (2003) found that different benefit segments moderate the impact of expressive (core attributes) and instrumental (facilitating attributes) on visitor satisfaction. Accordingly, the following hypotheses were derived:
Hypothesis 4: The destination performance attributes influencing overall satisfaction will differ by visitor status–benefit segments.
Hypothesis 5: The destination performance attributes influencing behav-ioral intention will differ by visitor status–benefit segments.
METHODOLOGY Research Design
The study utilized en route survey methodology. The major advantages of en route methodology are (1) it is cost effective, therefore, it is a preferred methodology by many travel managers; and (2) it reduces response errors (memory bias) because information is sought right after trip experience (Hurst, 1994; Danaher & Arweiler, 1996). The data was collected at Las Ve-gas McCarran International Airport departure gates while respondents were waiting for their flight to home. The study utilized a multi-stage sampling based on time/schedule domain through randomization. The flight schedules provided by the airport administration included all charter flights to Canada for the period of October 1999 through May 2000. The flights were mostly twice a week (Thursday and Sunday). The study focused on the October through December cluster. First, nine dates were randomly selected (five Sun-days and four ThursSun-days). Then, flight schedules were randomly selected on each day from morning, afternoon, evening, and late night flights. This proce-dure resulted in sixteen flights to be covered.
A questionnaire was developed based on discussions with selected univer-sity faculty, marketing managers of Las Vegas Convention and Visitors Au-thority and McCarran International Airport, print media and literature review, questionnaires used by the former USTTA and Tourism Canada for interna-tional travelers. The questionnaire was then pre-tested on 60 Canadian visitors from two separate flights at departure gates. The pre-test was conducted by two trained graduate students (one American and one Canadian) for wording, layout, content validity, and determining main data collection method. Two versions of the questionnaire were used during the pre-test: self-administered
and personal interview with response category cards. The pre-test showed that personal interviews took 25-30 minutes and created response fatigue whereas the respondents completed self-administered questionnaires in 10-15 minutes. Therefore, the self-administered questionnaire was judged a more appropriate data collection method for this study. The final questionnaire included sections on trip information, importance of socio-psychological travel motivations and destination attributes, performance of Las Vegas and the airport, and demo-graphics.
Socio-psychological (push) motivations were measured by 16 items on a 7-point scale, 1 being “Not At All Important” and 7 being “Extremely Impor-tant.” The performance items included 18 attributes measured on a 7-point scale, 1 being “Terrible” and 7 being “Excellent.” A “Don’t Know” option was also provided. Respondents were asked to indicate their overall satisfaction with Las Vegas on this trip on a 7-point scale (1 = Extremely Dissatisfied, 7 = Extremely Satisfied). Behavioral intention was measured by three items ask-ing revisitation intention for pleasure next year, revisitation intention for plea-sure in the next 3 years (1 = Definitely Will, 7 = Definitely Will Not), and recommending Las Vegas to their friends and/or relatives (1 = Definitely Will, 7 = Definitely Will Not).
The airport authority provided all logistics for data collection, including name badges for the graduate students. The students approached the visitors who were waiting for their flight, identified themselves, explained the purpose of the study, and emphasized that participation was confidential and voluntary. They also mentioned that only one person would be filling the questionnaire in case of couples, families or groups. This condition was also written in large and boldface letters on cover page of the questionnaire.
Data Analysis
Data analysis included several stages. First, a hierarchical clustering proce-dure by employing Ward’s method and squared Euclidean distance was uti-lized on socio-psychological motivations to identify the number of benefit segments. This was followed by a discriminant analysis to assess the internal consistency of the benefits segments identified. The clusters (segments) were validated by activities participated. Third, a principal component analysis of the performance attributes reduced them into fewer meaningful dimensions. The varimax rotation procedure and eigenvalue/scree plot were utilized to identify the number of components. A cut-off value of 0.40 was used for item inclusion in each component. Fourth, the model variables were prepared by averaging the multi-item scores. Finally, the path model was tested for each
visitor status-benefit segments by partial least squares and freeing all possible paths in the recursive model.
RESULTS AND DISCUSSION Response Rate and Profile of Respondents
The visitors were very participatory and exhibited a high level of interest as only 9% of the travelers approached rejected to participate. The required sam-ple size was determined as about 400 based upon proportion of first-time and repeat visitors at 95% confidence interval. A total of 412 questionnaires were generated, 36 of which were not usable because they had excessive missing data or response bias (i.e., consistently checking a particular number on a scale). Of the remaining 376, 307 respondents indicated that the main purpose of their visit was pleasure/vacation/gaming and were focus sample for this study.
The genders of respondents were 54.3% female and 45.7% male. The ma-jority of respondents (31.2%) reported an age 55 or above, which was followed by 24.3% who belonged to the 45-54 age bracket. Twenty-one percent of them were in the age group 35-44. Twenty-eight percent of the respondents held a university degree; 23.2% of them had some college, and 23% reported an edu-cation level of high school or less. The majority of the participants (71.7%) were currently married; 15.2% were never married. Forty-two percent of the respondents reported that their annual household income before taxes (in Ca-nadian $) was $80,000 or more. This was followed by 22% in the income group of $40,000 to $59,999, and 20.3% $60,000 to $79,999. In addition, twenty two percent of the respondents had a professional occupation; 14.5% of them were self-employed or business owner; 13.7% were retired, and 10.7% of them were in skilled/technical category.
Sixty percent traveled with spouse and 34.5% traveled with friends. About 53% had 2 persons in the immediate travel party and another 18% had four people. The majority spent 3 nights in Las Vegas (46.4%) while about 36% spent 4 nights. Only 14.1 spent a week in Las Vegas.
Benefit Segments and Validation
The cluster analysis, computed from two to four cluster solutions, sug-gested that two-clusters solution was more appropriate and revealed two benefit segments: “Excitement/Fun/Adventure Seekers” (n = 96, 36.1%) and “Relaxation/Novelty Seekers” (n = 164, 63.1%). The discriminant analysis
showed that 95% of the cases were correctly classified, indicating good in-ternal consistencies of the two segments (97.9% and 93.3%, respectively). Aldenderfer and Blashfield (1984) pointed out that high classification accu-racy is a strong evidence of the internal consistency (reliability), but not valid-ity. The authors suggested that, although not used frequently, a better approach to validate a clustering solution is to perform significance tests that compare clusters on some theoretically relevant criteria that are not used to generate the cluster solution. Therefore, the clusters generated were validated by activities participated. The “Excitement/Fun/Adventure Seekers” were more likely to par-ticipate in Thrill Rides, Special Concerts, Nightclubs and Dancing, and Regu-larly Scheduled Las Vegas Shows than the “Relaxation/Novelty Seekers” (p < .05).
Performance Dimensions
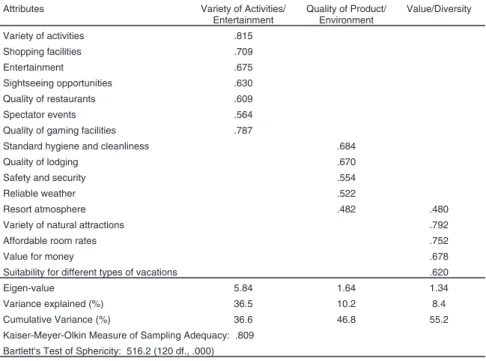
The principal component analysis of performance attributes resulted in three components: “Variety of Activities/ Entertainment,” “Quality of Prod-uct/Environment,” and “Value/Diversity” after excluding two attributes (“golf courses and facilities” and “outdoor activities”) from the analysis due to exten-sive “don’t know” responses and low communalities. These three dimensions explained 55.2% of the total variance in the performance attributes (Table 1). One attribute, “resort atmosphere,” was cross-loaded on two dimensions and retained in the factor where its loading was higher and more meaningful. The descriptive statistics and reliabilities (Cronbach’s alpha) for model variables were shown in Table 2. The reliability scores for multi-item measures were all satisfactory, ranging from 0.76 to 0.82.
The Model and Hypotheses Tests
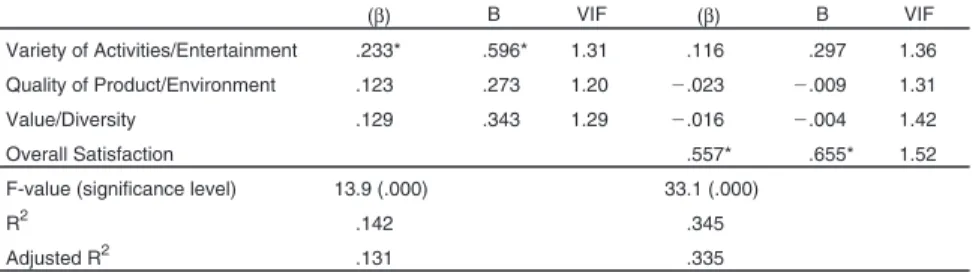
The model was first tested for the aggregate data (Table 3). The results showed that only “Variety of Activities/Entertainment” had a positive impact on Canadian visitors’ overall satisfaction with Las Vegas (p < 0.05). When be-havioral intention was regressed on three performance dimensions and the overall satisfaction, the overall satisfaction positively influenced the behav-ioral intention and none of the performance dimensions was significant at 0.05 probability level. In other words, the overall satisfaction was an intervening or mediating variable between destination performance evaluations and the be-havioral intention.
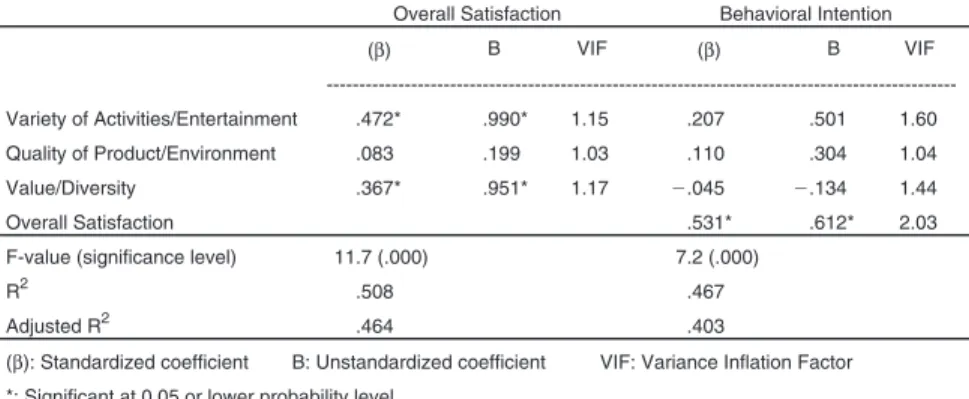
In the next stage, the model was tested separately for each segment (Table 4). For “First-Time Visitors–Excitement/Fun/Adventure Seekers,” the perfor-mance dimensions of “Value/Diversity” and “Variety of
Activities/Entertain-ment” were positively related to overall satisfaction (p < 0.05). The overall satisfaction had a positive impact on behavioral intention. For “First-Time Visitors–Relaxation/Novelty Seekers,” only “Value/Diversity” was positively related to overall satisfaction which, in turn, positively influenced behavioral intention (p < 0.05). For “Repeat Visitors–Excitement/Fun/Adventure Seekers,” “Quality of Product/Environment” and “Value/Diversity” had a positive
im-TABLE 1. Principal Component Analysis of Performance Attributes
Attributes Variety of Activities/ Entertainment Quality of Product/ Environment Value/Diversity Variety of activities .815 Shopping facilities .709 Entertainment .675 Sightseeing opportunities .630 Quality of restaurants .609 Spectator events .564 Quality of gaming facilities .787
Standard hygiene and cleanliness .684 Quality of lodging .670 Safety and security .554
Reliable weather .522
Resort atmosphere .482 .480
Variety of natural attractions .792
Affordable room rates .752
Value for money .678
Suitability for different types of vacations .620
Eigen-value 5.84 1.64 1.34
Variance explained (%) 36.5 10.2 8.4 Cumulative Variance (%) 36.6 46.8 55.2 Kaiser-Meyer-Olkin Measure of Sampling Adequacy: .809
Bartlett's Test of Sphericity: 516.2 (120 df., .000)
TABLE 2. Descriptive Statistics and Reliability Coefficients for Model Variables
Variables Mean Standard Deviation Number of Items Cronbach’s Alpha Variety of Activities/Entertainment 5.49 .66 7 .7943 Quality of Product/Environment 5.77 .70 5 .7629 Value/Diversity 5.06 .89 4 .8023 Overall Satisfaction 5.48 1.13 1 NA Behavioral Intention 5.45 1.41 3 .8252 Note: All variables were measured on a 7-point scale.
pact on overall satisfaction. Again, overall satisfaction was positively related to behavioral intention (p < 0.05). Finally, for “Repeat Visitors–Relaxation/ Novelty Seekers,” “Quality of Product/Environment” was the only perfor-mance dimension that positively influenced overall satisfaction which, in turn, had a positive impact on behavioral intention (p < 0.05).
Hypothesis 1, destination performance positively influencing overall sat-isfaction, was supported for the whole sample and across segments. Hypoth-esis 2, destination performance positively influencing behavioral intention, was not supported either for the whole sample or across samples. This also led to finding no support for Hypothesis 5, which stated that the destination perfor-mance attributes (dimensions) influencing behavioral intention will differ by visitor status–benefit segments. Hypothesis 3, overall satisfaction significantly influencing behavioral intention, was supported both for the whole sample and across segments. Finally, the results showed support for Hypothesis 4, which stated that the destination performance attributes (dimensions) influencing overall satisfaction will differ by visitor status–benefit segments.
It should also be noted that the models tested for segments had higher ex-planatory powers (R2) than that for the aggregate sample. In terms of
predict-ing overall satisfaction, the explanatory power (R2) of the whole sample model
was 0.141 whereas the explanatory powers for the segment models were 0.508 (first-time visitors seeking excitement, fun, and adventure), 0.493 (first-time visitors seeking relaxation and novelty), 0.512 (repeat visitors seeking excite-ment, fun, and adventure), and 0.259 (repeat visitors seeking relaxation and
TABLE 3. Results of Path Model for Aggregate Data (N = 256)
Endogenous Variables
---Overall Satisfaction Behavioral Intention ---(b) B VIF (b) B VIF Variety of Activities/Entertainment .233* .596* 1.31 .116 .297 1.36 Quality of Product/Environment .123 .273 1.20 ⫺.023 ⫺.009 1.31 Value/Diversity .129 .343 1.29 ⫺.016 ⫺.004 1.42 Overall Satisfaction .557* .655* 1.52 F-value (significance level) 13.9 (.000) 33.1 (.000)
R2 .142 .345
Adjusted R2 .131 .335
(b): Standardized coefficient B: Unstandardized coefficient VIF: Variance Inflation Factor
novelty). Similarly, in terms of predicting overall satisfaction, the explanatory power in the whole sample was 0.34. The explanatory power of segment-based models, on the other hand, ranged from 0.35 to 0.46.
The findings demonstrate that the impact of destination performance evalu-ations on overall satisfaction show varievalu-ations from one segment to another. Therefore, any model including attribute-based performance should be tested for specific samples to provide more effective practical implications for the
TABLE 4. Results of Path Model for Visitor Status–Benefit Segments
First-Time Visitors–Excitement/Fun/Adventure Seekers (n = 38)
Endogenous Variables
---Overall Satisfaction Behavioral Intention (b) B VIF (b) B VIF ---Variety of Activities/Entertainment .472* .990* 1.15 .207 .501 1.60 Quality of Product/Environment .083 .199 1.03 .110 .304 1.04 Value/Diversity .367* .951* 1.17 ⫺.045 ⫺.134 1.44 Overall Satisfaction .531* .612* 2.03 F-value (significance level) 11.7 (.000) 7.2 (.000)
R2 .508 .467
Adjusted R2 .464 .403
(b): Standardized coefficient B: Unstandardized coefficient VIF: Variance Inflation Factor *: Significant at 0.05 or lower probability level
First-Time Visitors–Relaxation/Novelty Seekers (n = 36)
Endogenous Variables
---Overall Satisfaction Behavioral Intention (b) B VIF (b) B VIF ---Variety of Activities/Entertainment .191 .379 1.39 .200 .504 1.47 Quality of Product/Environment .173 .382 1.42 ⫺.278 ⫺.782 1.48 Value/Diversity .472* .870* 1.62 ⫺.050 ⫺.117 2.06 Overall Satisfaction .598* .761* 1.97 F-value (significance level) 10.4 (.000) 4.2 (.008)
R2 .493 .354
Adjusted R2 .446 .270
(b): Standardized coefficient B: Unstandardized coefficient VIF: Variance Inflation Factor *: Significant at .05 or lower probability level
tourist destinations. If destinations do not have the understanding of how dif-ferent destination attribute performances influence global evaluations or fu-ture behavior of different segments, the implications generated by “one-for-all” models would not be useful for marketing activities. As a matter of fact, the destination marketing organizations or bodies would be wasting their re-sources. A segmented approach is more pragmatic than aggregated approach because it provides segment-specific implications for destination management
TABLE 4 (continued)
Repeat Visitors–Excitement/Fun/Adventure Seekers (n = 54)
Endogenous Variables
---Overall Satisfaction Behavioral Intention (b) B VIF (b) B VIF ---Variety of Activities/Entertainment .179 .424 1.69 .266 .691 1.35 Quality of Product/Environment .406* .677* 1.29 ⫺.058 ⫺.105 1.63 Value/Diversity .322* .718* 1.43 .096 .235 1.41 Overall Satisfaction .429* .470* 1.51 F-value (significance level) 17.5 (.000) 8.7 (.000)
R2 .512 .417
Adjusted R2 .483 .370
(b): Standardized coefficient B: Unstandardized coefficient VIF: Variance Inflation Factor *: Significant at 0.05 or lower probability level
Repeat Visitor–Relaxation/Novelty Seekers (n = 128)
Endogenous Variables
---Overall Satisfaction Behavioral Intention (b) B VIF (b) B VIF ---Variety of Activities/Entertainment .139 .325 1.16 ⫺.053 ⫺.136 1.19 Quality of Product/Environment .362* .655* 1.16 ⫺.059 ⫺.118 1.34 Value/Diversity .161 .393 1.22 ⫺.014 ⫺.030 1.25 Overall Satisfaction .662* .730* 1.35 F-value (significance level) 14.5 (.000) 19.2 (.000)
R2 .259 .385
Adjusted R2 .241 .365
(b): Standardized coefficient B: Unstandardized coefficient VIF: Variance Inflation Factor *: Significant at .05 or lower probability level
and marketing. This approach, however, requires a careful identification of the segments for a tourist destination. In other words, the destinations should first identify the most effective segmentation base to group their visitors, and then, examine how attribute-based performance is related to overall satisfaction and future behavior for the segments identified.
From a practical standpoint, the findings can be utilized in marketing efforts of Las Vegas to target specific Canadian visitors and to develop sound promo-tion and packaging tactics as well as product enhancement tactics. To serve this purpose, the segments were further profiled by employing a series of chi-square tests at 0.05 probability level. The results indicated that first-time visi-tors seeking excitement and adventure are more likely to be ages between 21 and 34. On the other hand, the first-time visitors seeking relaxation and/or nov-elty are more likely to belong to 35-44 age bracket. The repeat visitors seeking relaxation and/or novelty are more likely to be 55 or older. The first-time and repeat visitors seeking relaxation and or novelty are more likely to be married. They are also more likely to travel with their spouse. The first-time visitors seeking excitement are less likely to travel with family or relatives, but more likely to travel with friend(s). The first-time and repeat visitors seeking excite-ment and adventure are more likely to take thrill rides. The repeat visitors seek-ing excitement and adventure are more likely to attend special concerts and go to nightclubs whereas the first-time visitors seeking the same benefits are more likely to go to regularly scheduled Las Vegas shows.
CONCLUDING COMMENTS
This article tested a model involving destination performance, overall satis-faction, and behavioral intention in a path-analytic framework. It clearly dem-onstrated differences and similarities in model linkages when aggregate data and segment-based data were utilized. The findings strongly indicated that the overall satisfaction is an intervening variable between attribute-based destina-tion performance and behavioral intendestina-tion for destinadestina-tions. In other words, the destination performance indirectly influences behavioral intention through overall satisfaction. This finding was in line with the most previous research on customer satisfaction (i.e., Fornell et al., 1996; Szymanski & Henard, 2001). The model was also tested for each segment by treating re/visitation intention and recommendation behavior separately. They both produced consistent re-sults and were not different from when a composite measure of the two was used. This suggests that, if no other information is on hand, the global evalua-tions seems to be a good predictor of future visitaevalua-tions and word-of-mouth.
The segment-specific findings also help to reveal the destination attributes critical to ensure a pleasant experience for each segment. Therefore, it pro-vides a more pragmatic approach. As pointed out earlier, the segmentation ba-sis (or base) used by a destination is equally important in this approach. Future study would utilize some other segmentation base appropriate for the destina-tion of interest to advance our understanding on the nature of reladestina-tionship be-tween attribute-based performance, satisfaction, and behavioral intention for distinct markets. The findings are limited to linear relationships among model variables because non-linear or asymmetric relationships were not investigated (please see Mittal at al., 1998). The destination performance may have direct and asymmetric impact on behavioral intention. That would be an interesting future research area.
The model assumed unidirectional relationships between the variables and constructs. Therefore, the findings are limited to recursive model because bi-di-rectional linkages were not investigated. The results are limited to the time pe-riod of data collection and destination attributes included in the study. The study measured overall satisfaction by a single-item global measure. Although the single-item overall satisfaction measure has also been used in most recent customer satisfaction research and justified in large-scale surveys (see LaBar-bera & Mazursky, 1983; Fornell et al., 1996; Mittal, Ross, & Baldasare, 1998; Kozak & Rimmington, 2000; Yuksel & Rimmington, 1998; Mittal, Katrichis, & Kumar, 2001), future research would use multiple measures as several authors argue that the satisfaction construct has both cognitive and affective dimen-sions (see Oliver, 1993). The findings are also limited to period when data were collected and to those Canadian travelers who use air travel as their mode of transportation. Therefore, the findings would not be generalizable over Ca-nadian visitors to Las Vegas.
REFERENCES
Aldenderfer, M. S. & Blashfield, R. K. (1984). Cluster Analysis, Newbury Park: Sage Publications.
Anderson, E.W., Fornell, C., & Lehmann, D. R. (1994, July). Customer satisfaction, market share, and profitability: Findings from Sweden. Journal of Marketing, 58, 53-66.
Baker, D. A. & Crompton, J. L. (2000). Quality. Satisfaction and behavioral intentions.
Annals of Tourism Research, 27(3), 785-804.
Baloglu, S. & Uysal, M. (1996). Market segments of push and pull motivations: a ca-nonical correlation approach. International Journal of Contemporary Hospitality
Baloglu, S. (2000). “A path-analytical model of visitation intention involving informa-tion sources, socio-psychological motivainforma-tions and destinainforma-tion images” in Wood-side et al. (Eds). Consumer Psychology of Tourism, Hospitality and Leisure (pp. 63-90). Oxon:CABI Publishing.
Chon, K. S. (1992). Self-image/destination image congruity. Annals of Tourism
Re-search, 19(2), 360-76.
Churchill, G. & Surprenant, C. (1982, November). An investigation into the determi-nants of customer satisfaction. Journal of Marketing Research, 19, 491-504. Crompton, J. L. & Love, L. L. (1995). The predictive validity of alternative approaches
to evaluating quality of festival. Journal of Travel Research, 34(1), 11-24. Cronin, J. J. & Taylor, S. A. (1992). Measuring service quality: A reexamination and
extension. Journal of Marketing, 56(3), 55-68.
Danaher, P. J. & Arweiler, N. (1996). Customer satisfaction in the tourist industry: A case study of visitors to New Zealand. Journal of Travel Research, 35(1), 89-93. Fakeye, P.C. & Crompton J.L. (1991). Image differences between prospective,
first-time, and repeat visitors to the Lower Rio Grande Valley. Journal of Travel
Research, 30 (Fall): 10-16.
Fornell, C., Johnson, M. D., Anderson, E. W., Cha, J., & Bryant, B. E. (1996, October). The American customer satisfaction index: Nature, purpose, and findings. Journal
of Marketing, 60, 7-18.
Frochot, I. & Morrison, A. M.(2000). Benefit segmentation: A review of its applica-tions to travel and tourism research. Journal of Travel and Tourism Marketing, 9(4), 21-45.
Hurst, F. (1994). “En route surveys.” In J.R.B Ritchie and C. R. Goeldner (Eds.)
Travel, Tourism, and Hospitality Research: A Handbook for Managers and Re-searchers, 2nd ed. (pp. 453-471). New York: John Wiley & Sons, Inc.
Jones, M. A. & Suh, J. (2000). Transaction-specific satisfaction and overall satisfac-tion: An empirical analysis. Journal of Services Marketing, 14(2), 147-159. Kozak, M. & Rimmington, M. (2000). Tourist satisfaction with Mallorca, Spain as an
off-season holiday destination. Journal of Travel Research, 38 (February), 260-269.
LaBarbera, P. A. & Mazursky, D. (1983, November). A longitudinal assessment of consumer satisfaction/dissatisfaction: The dynamic aspect of the cognitive process.
Journal of Marketing Research, 20, 393-404.
Mittal, V., Ross, W. T., & Baldasare, P. M. (1998, January). The asymmetric impact of negative and positive attribute-level performance on overall satisfaction and repur-chase intentions. Journal of Marketing, 62, 33-47.
Mittal, V., Katrichis, J. M., Kumar, P. (2001). Attribute performance and customer sat-isfaction over time: Evidence from two-field studies. Journal of Services
Mar-keting, 15(5), 343- 356.
Oh, H. & Parks, S. C. (1997). Customer satisfaction and service quality: A critical re-view of the literature and research implications for the hospitality industry.
Hospi-tality Research Journal, 20(3), 35-64.
Oliver, R. L. (1980, November). A cognitive model of the antecedents and conse-quences of satisfaction decisions. Journal of Marketing Research, 17, 460-69.
Oliver, R. L. (1993). Cognitive, affective, and attribute bases of the satisfaction re-sponse. Journal of Consumer Research, 20, 418-430.
Patterson, P. (1993). Expectations and product performance as determinants of satis-faction for a high-involvement purchase. Psychology & Marketing, 10(5), 449-465. Pearce, P. L. (1980). A favorability-satisfaction model of tourist evaluations. Journal
of Travel Research, 19 (Summer): 13-17.
Pizam, A., Neumann, Y. & Reichel (1978). Dimensions of tourist satisfaction with a destination. Annals of Tourism Research, 18: 226-37.
Pizam, A. & Milman, A. (1993). Predicting satisfaction among first time visitors to a destination by using the expectancy disconfirmation theory. International Journal
Hospitality Management,12(2), 197-209.
Ryan, C. (1995). Researching tourist satisfaction: Issues, Concepts, Problems. Lon-don: Routledge.
Singh, J. & Sirdeshmukh, D. (2000). Agency and trust mechanisms in consumer satis-faction and loyalty judgements. Journal of the Academy of Marketing Science, 28(1), 150-167.
Szymanski, D. M. & Henard, D. H. (2001). Customer satisfaction: A Meta analysis of the empirical evidence. Journal of the Academy of Marketing Science, 29(1), 16-35. Tse, D. & Wilton, P. (1988, May). Models of consumer satisfaction formation: An
ex-tension. Journal of Marketing Research, 25, 204-212.
Uysal, M. & Hagan, L.A.R. (1993), “Motivation of Pleasure Travel and Tourism,” In
VNR’s Encyclopedia of Hospitality and Tourism, M. Khan, M. Olsen, and T. Var
(Eds.), New York: Van Nostrand Reinhold, pp. 798-810.
Uysal, M. & Williams, J. (2003). The role of expressive and instrumental factors in measuring visitor satisfaction. The paper presented at The Third Symposium of the
Consumer Psychology of Tourism, Hospitality and Leisure (CPTHL) Conference,
January 5-8, Melbourne, Australia.
Woodside, A. G. & Jacobs, L. W. (1985). Step two in benefit segmentation: Learning the benefits realized by major travel markets. Journal of Travel Research, 24(1), 7-13.
Yi, Y. (1990). A critical review of consumer satisfaction. In V. A. Zeithaml(Ed.),
Re-view of Marketing (pp. 68-123). Chicago: American Marketing Association.
Yuksel, A. & Rimmington, Y. (1998). Tourist satisfaction and food service experi-ence: Results and implications of an empirical investigation. Anatolia: An
Interna-tional Journal of Tourism and Hospitality Research, 9(1), 37-57.
Yuksel, A. & Yuksel F. (2001). Measurement and management issues in customer sat-isfaction research: Review, critique and research agenda: Part two. Journal of