IDENTIFICATION OF RELATIVE PROTEIN BANDS IN POLYACRYLAMIDE
GEL ELECTROPHORESIS (PAGE) USING MULTIRESOLUTION SNAKE
ALGORITHM
Metin
NaJi
Gui-cant, Mehmet Koyuturkt,
H. Serkan Yzldzzt,
Rengul
getin-Atalag,
A . Enis Cetint
t
Dept. of Electrical and Electronics Engineering
*
Dept. of Molecular Biology and Genetics
Bilkent University
Bilkent, Ankara TR-06533, Turkey
E-mail: [email protected] .edu.tr
Phone:
(90)
312-266 4307
Fax:
(90) 312-266 4126
ABSTRACT
Polyacrylamide Gel Electrophoresis (PAGE) is one of the most widely used techniques in protein research. In the protein purification process, it is important t o determine the efficiency of each purification step in terms of percentage of protein of interest found in the protein mixture. This study provides a rapid and re- liable way t,o determine this percentage. The region of interest containing the protein is detected using the snake algorithm. The iterative snake algorithm is im- plemented in a mult,iresolutional framework. The snake is initialized on a low resolution image. Then, the final position of the snalke at low resolution is used as the initial position in the higher resolution image. Finally, the area of the protein is estimated as the area enclosed by the final position of the snake.
1. INTRODUCTION
Polyacrylamide Gel Electrophoresis (PAGE) is one of the most widely used techniques in protein research
[
11. Denaturing Sodium Dodecyl Sulfate Polyacrylamide Gel Electrophoresis (SDS-PAGE) is a significant method used for the separation of proteins based on the migra- tion of negatively c’harged proteins depending on their molecular weight in an electrical field. This procedure is often used during protein purification process. Its advantage is t h a t proteins can be visualized as well as separated. SDS-PAGE technique provides information about, protein concentrations of the protein mixture ap- plied on a certain lane of the PAGE and the degree of purity of a particular protein in this mixture during This work was supported by the Technology DevelopmentFoundation of Turkey under TTGV-199.
0-7803-5073- 1/98/$10.00 0 1998 IEEE
277
protein purification process. Each band in the SDS- PAGE image represents a different protein band.
In the protein purification process, it is important t o determine the efficiency of each purification step in terms of percentage of protein of interest found in the protein mixture. This study provides a rapid and reli- able way t o determine the percentage. Currently, the percentage is determined by eye and the results are quite subjective. In the currently available gel analysis systems, the analysis is usually based on the one di- mensional profile of manually extracted lanes. The po-
sitions of the proteins of interest are determined from the peak points in the horizontal profile and the ar- eas of the rectangular regions are measured. Finally, these measurements are used for efficiency calculation. However, rectangular approximations are not accurate representations of the prot,ein areas.
In our scheme, the region of interest containing the significant protein is detected using the snake algo- rithm [4]. The iterative snake algorithm is implemented in a multiresolutiona.1 framework. The snake is initial- ized on a low resolution image. Then, the final position of the snake at the low resolution is used as the initial position in the higher resolution image. The area of the protein is estimated a.s the area enclosed by the final position of the snake.
In Section 2, t,he characteristics of the SDS-PAGE images are described. In Section 3, the snake algo- rithm is reviewed. In Section 4, the multiresolution implementation of the snake algorithm is described. In Section 4.1, the computational complexity of the pro-
posed scheme is analyzed and simulation results are
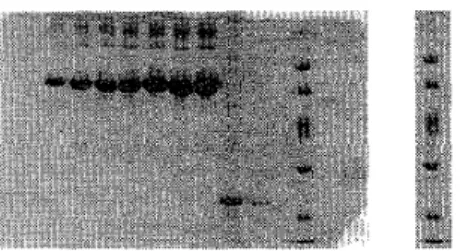
Figure 1: (a) Denaturing PAGE image, (b) a lane of the denaturing PAGE image
Figure 2: Histograms of three different regions of a PAGE image.
2. SDS-PAGE IMAGES
Figure l ( a ) shows a typical SDS-PAGE gel image. The vertical stripes containing several protein bands in this gel image are called lanes and one of them is shown in Figure l ( b ) . The SDS-PAGE image is composed of three parts. The background does not carry any use- ful information, The second part corresponding to the images of protein bands have darker appearance. The proteins of interest appear as dark stripes and consti- tute the third part. The ratio of total area of the dark regions to the total area of other proteins is the mea- sure of the efficiency of each purification step. The histograms of the three regions corresponding t o the significant protein, other proteins and the background on a typical lane are given in Figure 2.
The regions containing protein of interest are nearly elliptic regions which have the smallest gray level on the image. Thus, the boundary of such a region is an elliptic closed contour having small total intensity and high gradient.
3. THE SNAKE ALGORITHM
Snakes
are
deformable contour models increasingly used in image segmentation [4, 51. They are planar curves. The shape and location of the curve is determined ac- cording to an objective function. Snakes are influenced278
by image structure and pulled toward the edges and lines on the image. The energy of a snake is defined in a way that its total energy becomes minimum when the snake lies around the region of interest. The total energy of the snake that defines a closed contour v(s)
is defined as:
E(4.3))
=j(EiT&
U+
E,,t(s))ds (1)where Eint and Eout represent t,he internal and external energies of the snake, respectively. The internal energy,
Eint is determined according to the length and bending of the snake and defined as
dv
d2vds +
p's
& n t ( s ) = a s -
where the first term denotes the length energy and the second term denotes the bending energy. The external energy, Ee,t, represents the energy created by image structure depending on the location of the snake on the image. Two main components of external energy are gradient and intensity and these affect the line and edge energies of the snake. The external energy of the snake is defined a.s
Ee,t(s) = W h e I ( - $ S ) , Y(S)) - w e d g e l q + ) , Y(S))l
(3)
where the first term denotes the line energy, the sec- ond term denotes t,he edge energy, and I(.(.), y(s)) de- notes the intensity of the image at location (., y) along the snake contour parameterized by s. The parameters
(Y,
p,
w l z n e , W w e d g e are set in such a way t h a t the energy should be minimum on the region of interest.At each iteration of the snake algorithm, the snake moves to a location having less energy. In our applica- tion, a fast greedy algorithm described in
[e]
is used. The algorithm is adapted to this problem in such a way that the resultant snake has an ellipse like shape. This is provided by putting constraints on the internal an- gles of the snake. In our algorithm, the important pa- rameters that affect the convergence of the algorithm are the energy coefficients, the search radius and the number of snaxels which are the control points of the snake curve.4. MULTIRESOLUTIONAL FRAMEWORK
The snake algorit,hm is implemented in a niultiresolu- tion framework. The original SDS-PAGE image is first processed by the filter banks described in
[a,
31 andIOW resolution quarter size subimages, I l l , Iih
,
I h l , I h hare obtained. The snakes are initialized on the low- low subimage. The initial form of the snakes are cir- cles centered a t the peak points of the
l-D
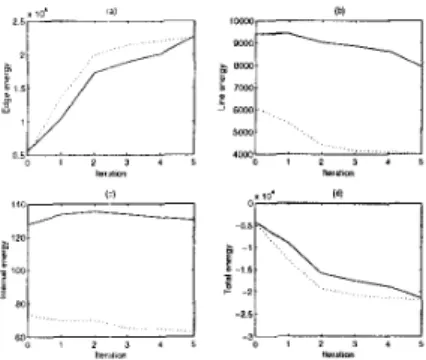
profile ofFigure 3: Change of different energy components. Solid lines indicate the energy changes in the high-resolution image and dashed lines show the energy changes in the lower-resolution image
the lane image. Another initialization is based on the
It*, Ih1, I h h subimages which contain the edge informa-
tion about the original SDS-PAGE image. Therefore, the edges of the protein regions can be detected from these subimages and used as the initial positions of the snakes.
After the initialization on the low resolution ima.ge, t3he snake adapts it,self to the contour around the pro- tein region in an iterative manner. The final snake ob- tained on the low resolution image is used as the initial estimate on a finer resolution SDS-PAGE image. This process is repeated until the snake has closely covered the protein regions in the original full-resolution SDS- PAGE image. The advantage of this multiresolutional approach is three-fold: i) The snake converges better, ii) it brings robust,ness t o the process, i.e., it is not easily affected by the scanning artifacts in the original SDS-PAGE image, and iii) computational cost is less as smaller images axe processed in lower resolutions.
The behavior of the different energy components and the total energy of a snake at several iterations at different resolutions are given in Figure
3
for the SDS- PAGE image shown in Figure 2.At
the beginning of the convergence process, the slope of the total energy of the snake in the low resolution image is higher than that of the snake in the high resolution image as shown in Figure 3(d). In other words,(4) This means that the snake converges faster on the low resolution ima.ge. This observation verifies the validity
of the inultiresolutional approach. In our simulation
studies we use only one level of subband decomposi- tion but this methodology can be considered in multi- ple resolution levels, as well.
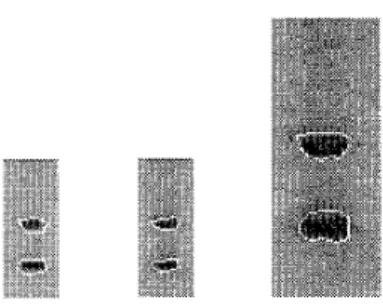
Figure 4: Protein of interest, is enclosed within the snake : (a) 0rigina.l lane image (b) Snake obtained us- ing only the low-resolution image (c) Snake obtained using only the high-resolution image (d) Snake ob- tained using the multiresolutional approach
The energy parameters defined in Equations 2 and 3
( a ,
P,
W l i n e , W e d g e ) must be adapted t o the energy levelchanges in different resolutions. In the niultiresolu- tional scheme, a t the final iteration of the low reso- lution i m a g e , a , p a.nd toline va.lues are ha.lved a.nd the iterations are continued in the higher resolution im- age. At the low resolution these values are LY = 4,
p
=Figure 4 shows an original lane of the image as well as the final positions of different snakes obtained us- ing different methodologies. T h e result in Figure 4(c) is obtained a.fter six itrerations of the sna.ke algorithm on the original ima.ge. Figure 4(d) shows the result of the multiresolutional approach. T h e snake obtained a t the low resolution after two iterations (shown in Fig- ure 4(b)) is used as the initial position of the snake in the high resolution image. Another t,liree iterations in the high resolution inmge result in Figure 4(d). The comparison of Figures 4(c) and (d) indicates that the final snake converges bet>ter t,o the boundary of the pro- tein area if a multiresolutional approach is used. Ad- ditionally, the number of comput,at,ions required in the multiresolutional approach is siiia.ller.
Figure 5 shows the results of the initialization pro- cedure based on the edge information extracted from
I l h , I h l , I h h subimages. Figure 5(a) depicts the init,ial
position of the snake a.t the subiinage I l l . T h e six snax-
els are located on the extracted edges of tjhe protein re- gion. This snake ta.kes the form shown in Figure 5(b) after only one iteration. This form is very close t o the final position of the snake on the low-resolution image obtained with the other initialization procedure based on the 1-D profile of the la.ne image. Figure 5(c) shows the final position of the sna.l<e on thc high resolution image after two iterations. There is no significant dif- ference between this result and the result shown in Fig- ure 4(d) obtained with the other initia.lization p r o w 4, W l i n e = 0.2, w e d g e = -0.1.
Figure 5: Prot,ein of interest is enclosed within the snake : (a) Initial position of the snake located on the extracted edge (b) The snake in (a) after one iteration on low-resolution image (c) Snake obtained using the inultiresolutioiial approach with the initial snake in (a)
Resolution Edge Line Length High 3517 3517 648
L O W 756 756 132
dure. Edge information based initialization procedure produce similar results with less number of iterations. However, this initialization procedure requires the ex- traction of edges from the subimages.
Bending 324
66 4.1. Computational Complexity
For each iteration of energy calculations, the number of computations depends on the length of the snake and the radius of the search window. With search radius of n pixels and snake length of N pixels, the number of computations for a single iteration of energy calcula- t,ioiis is O ( N n 2 ) [ 6 ] . In this study, the number of snaxels and t,he radius of the search window are halved in the lower resolution images. Therefore, the ratio, RI of the tota.1 computational complexity in the low resolution image to that in the high resolution image is
( n
+
R =
2 x (an
+
1)’(5)
where ( i 1 + 1 ) ~ and (2n+1)’ are areas ofsearch windows at the high and low resolution images, respectively.Table I shows the number of times each energy com- ponent is coiiiputed on high and low resolution images at the last iteration. The total number of energy com- ponent, c,oinputations in the low resolution image is re- duced to approximately i t h of that in the high reso- lution image. This figure is almost equivalent to the value we get if we take n = 2 in Equation 5.
Table 1: Number of computations for high and low resolution
5. CONCLUSIONS AND FUTURE WORK In this work, we present a multiresolution snake algo- rithm for the identification of relative protein bands in PAGE images. The algorithm is more accurate com- pared to usual eye-exams or some commercially avail- able programs that utilize rectangular approximations. Furthermore, the algorithm is fast as a. multiresolu- tional framework is used.
The multiresolutional snake fmmework can be used in other applications such as the detection of mass and stellate lesions in mammograms using the snake algo- rithm [7].
6. REFERENCES
[l]
R. C.
Allen,C.
A. Savaris and H.R.
Marier, Gel Electrophoresis and Isoelectric Focusing of Pro-teins : Selected Techniques, Walter de Gryten: Berlin, 1984.
[a]
C.
W . Kim,R.
Ansa.ri and A. E. Cetin, ‘A class of linear-phase regular 1iiorthogona.l wavelets,’ IEEE International Confereme on. Acoiist., Speech, and Signal Processing (ICASSP’92), Sa.n Francisco,USA,
March 1992.[3] Omer Nezih Gerelr, A. Eiiis Cetin, “Lin- ear/Nonlinear Adaptive Polyphase Subband De- composition Structures for Image Compression,”
IEEE Int’l. Conf. on ASSP., ICASSP’98, Seattle, WA, USA, May 12-15, 1998.
[4] M. Kass, A. Witkin, and D. Terzopoulos, “Snakes: Active contour models,” Int.
J.
Coinpiiter Vision,vol.
1,
no. 4 , pp. 321-331, 1988.[5] F. Leyinarie and M. D. Levine, “Traclting De- formable Objects in the Plane Using an Active Contour Model,” IEEE Trans. on Pattern Anal-
ysis and Machine Intelligence, vol. 15, no. 6 , pp.
617-633, 1993.
[6] D. J . Williams and M. S1ia.h. ” A fa.st algorithm for active contours.” IEEE Trails. on PAMI, vol.
4, pp. 592-595, 1990.
[7] Mehmet Koyuturk, Metin Nafi Gurca.11,
A .
Enis Cetin, “Ma.mmogramla,rda Kutle Lezyonlarinin Yilan Algoritmasiyla Otomatik Olarak Sezinlen- mesi,” 6. Sinyal Isleme pie Uygulamalari Ir‘onfer-ansi Kitapcigi, 28-30 Mayis, 1998, Kizilcahamam, Ankara. (Detection of Mass Lesions in Mammo- grams Using Snake Algorithm) (in Turkish).