Managing Office
: Ağrı İbrahim Çeçen University, Graduate School of Natural
and Applied Sciences
Web Site
:
http://www.agri.edu.tr/tr/e-dergiler/eajs
http://dergipark.ulakbim.gov.tr/eajs/
:
[email protected]
Managing Office Tel
: +90 472 215 50 82
Publication Language : English
Publication Type
: International Journal
Publication Frequency : Two times in a year
Online Published
: May 7, 2015
Owner on Behalf of Ağrı İbrahim Çeçen University
Prof. Dr. İrfan Aslan
Rector
Editor-in-Chief
Prof. Dr. Yusuf Bayrak
[email protected]
Associate Editor
Asst. Prof. Dr. Ahmet Ocak Akdemir
[email protected]
Technical Committee
Adem ÖZKAN
Adem AKALIN
Ahmet Selçuk AKDEMİR
EDITOR-IN-CHIEF
Yusuf BAYRAK, Ağrı İbrahim Çeçen University, Turkey
ASSOCIATE EDITOR
Ahmet Ocak AKDEMİR, Ağrı İbrahim Çeçen University, Turkey
TECHNICAL COMMITTEE
Adem ÖZKAN, Ağrı İbrahim Çeçen University, Turkey Adem AKALIN, Ağrı İbrahim Çeçen University, Turkey Ahmet Selçuk AKDEMİR, Ağrı İbrahim Çeçen University, Turkey
Serdar TAKVA, Ağrı İbrahim Çeçen University, Turkey
SECTION EDITORS
Emir Alper TÜRKOĞLU, Ağrı İbrahim Çeçen University, Turkey (Nanoscience and Nanotechnology)
Harun GÜNEY, Ağrı İbrahim Çeçen University, Turkey (Physics) Mucip GENİŞEL, Ağrı İbrahim Çeçen University, Turkey (Biology) Ramazan DEMİRDAĞ, Ağrı İbrahim Çeçen University, Turkey (Chemistry) Selvinaz YAKAN, Ağrı İbrahim Çeçen University, Turkey (Agricultural Sciences)
Yalçın KARAGÖZ, Ağrı İbrahim Çeçen University, Turkey (Health Sciences) Yusuf KOÇAK, Ağrı İbrahim Çeçen University, Turkey (Mathematics) Yusuf BAYRAK, Ağrı İbrahim Çeçen University, Turkey (Earth Sciences)
EDITORIAL BOARD
Abdullah ÇAĞMAN, Ağrı İbrahim Çeçen University, Turkey Abdullah MAĞDEN, Atatürk University, Turkey Adem KILICMAN, University Putra Malaysia, Malaysia
Adem TATAROĞLU, Gazi University, Turkey Adem ÜN, Ağrı İbrahim Çeçen University, Turkey
Adil DENİZLİ, Hacettepe University, Turkey Ahmet ÇAKIR, Kilis 7 Aralık University, Turkey
Ali PINAR, Boğaziçi University, Turkey Alper EKİNCİ, Ağrı İbrahim Çeçen University, Turkey
Attila HÁZY, University of Miskolc, Hungary
Binod Chandra TRIPATHY, Institute of Advanced Study in Science and Technology , India
Claudiu T. SUPURAN, University of Florence, Italy Deniz TÜRKMEN, Hacettepe University, Turkey
Ebru SENEMTAŞI ÜNAL, Ağrı İbrahim Çeçen University, Turkey Elvan AKIN BOHNER, Missouri University of Science and Technology, USA
Engin KILIÇ, Kafkas University, Turkey Erkut YILMAZ, Aksaray University, Turkey Eylem GÜVEN, Hacettepe University, Turkey Fahri BAYIROĞLU, Yıldırım Beyazıt University, Turkey Fatih DADAŞOĞLU, Ağrı İbrahim Çeçen University, Turkey Fazile Nur EKİNCİ AKDEMİR, Ağrı İbrahim Çeçen University, Turkey
Feng QI, Tianjin Polytechnic University, China Fikrettin ŞAHİN, Yeditepe University, Turkey Furkan ORHAN, Ağrı İbrahim Çeçen University, Turkey
Gabil YAGUB, Kafkas University, Turkey
Handan YAVUZ, Hacettepe University, Turkey İbrahim CENGİZLER, Çukurova University, Turkey İbrahim DEMİRKAN, Afyon Kocatepe University, Turkey
İbrahim HAN, Ağrı İbrahim Çeçen University, Turkey Kadirhan POLAT, Ağrı İbrahim Çeçen University, Turkey Kadiriye URUÇ PARLAK, Ağrı İbrahim Çeçen University, Turkey
Kenan KARAGÖZ, Ağrı İbrahim Çeçen University, Turkey Lokman UZUN, Hacettepe University, Turkey
Mikail ET, Fırat University, Turkey
Mohammad W. ALOMARI, Jerash University, Jordan Mustafa BAYRAM, Yıldız Technical University, Turkey
Mustafa CEMEK, Yıldız Technical University, Turkey Mümtaz NAZLI, Mehmet Akif Ersoy University, Turkey
Müslüm KUZU, Ağrı İbrahim Çeçen University, Turkey Nilay BERELİ, Hacettepe University, Turkey
Olena Viktorivna SHYNKARENKO, V. Lashkaryov Institute of Semiconductor Physics of the National Academy of Science of Ukraine, Ukraine
Orhan POLAT, Dokuz Eylül University, Turkey Özgür AKSOY, Kafkas University, Turkey Özlem GÜZEL, İstanbul University, Turkey Ramazan GÖNENCİ, Mustafa Kemal University, Turkey
Sanja VAROSANEC, University of Zagreb, Croatia Serkan IRMAK, Kocaeli University, Turkey
Sever Silvestru DRAGOMIR, Victoria University, Australia Sinan AKGÖL, Ege University, Turkey
Süleyman GÜL, Kafkas University, Turkey
Syed Abdul MOHIUDDINE, King Abdulaziz University, Saudi Arabia Taha Yasin ÖZTÜRK, Kafkas University, Turkey
Tayfun KARATAŞ, Ağrı İbrahim Çeçen University, Turkey Theodoros TSAPANAOS, Universityof Thessaloniki, Greece
Tuba AYDIN, Ağrı İbrahim Çeçen University, Turkey Vesile DÜZGÜNER, Ardahan University, Turkey Veysal ÇOMAKLI, Ağrı İbrahim Çeçen University, Turkey
Yücel ÜNAL, Ağrı İbrahim Çeçen University, Turkey Zeynep ERDOĞAN, Mustafa Kemal University, Turkey
Dear Colleagues,
First of all, let me express that our university, set off with the motto ‘the light arising from the east’, has
completed its physical structure to a large extent and is going on its development through scientific activities. In
this context, we are glad to present “Eastern Anatolian Journal of Science” (EAJS), a newly appeared scientific
journal under the name of Ağrı İbrahim Çeçen University.
Today, universities need to get their power of existence from their own studies by setting strong relationships with
economic, social and cultural resources of their territory as access to information has been simplified, education
has become a lifelong activity and rivalry has become dominant. One of the basic features of universities is to
produce information, science and technology to serve to next generation and to the people of the region as well
as the country, since the responsibilities of universities are not restricted to equip their students with occupation.
Universities are those institutions where scientific, technologic, cultural and social benefits are shared with
society. In other words, one of the responsibilities of universities is to become institutional leaders as well.
Under abovementioned conscious of responsibility, Ağrı İbrahim Çeçen University leads and collaborates with
private and official institutions as well as leading the society. Our university endeavours to convey its scholarly
studies to social, cultural, technologic and commercial products by developing interdisciplinary collaboration.
We think that, university is a place where reasoning, questioning, sense of responsibility, imagination,
gaining a universal vision towards learning is learnt along with learning to learn. Regardless of the conditions,
the methods of accessing information are investigated at universities.
Universities are universal and dynamic institutions. They are driving powers of their people, society,
country and civilization in terms of development. A sustainable, beneficial, humanistic, peaceful and ecologic
development necessitates lifelong learning and teaching. University education is one of the crucial phases of
a person’s educational life; and universities are those institutions where beneficial and scientific knowledge is
created and the knowledge is transmitted. The ways of accessing knowledge is also taught at universities. All
kinds of views are discussed at universities. Universal peace and love is organised at universities where the
main principle is based on the fact that the most dutiful person is the one who is of help to others.
Our university aims to provide successful careers to the students by gaining the way approaching to the
problems within the scope of solutions oriented and the skill of thinking analytically.
By constituting a prestigious and well-known university on the Gateway of Civilization among the universities
in the world, Ağrı İbrahim Çeçen University’s vision is to be a leading university that works within the light
of Atatürk’s Principles and Reforms, to carry out education in high-quality standards accepted all over the
world, to raise young people that have professional and communication abilities required by the 21st century’s
global competition atmosphere, to carry out satisfactory scientific researches, to utilize from regional sources
in ideal manner, to work with a human centred mentality, to manage competing in science, technology, art and
sports internationally, to own social responsibility and citizenship conscious; to implement “Modern Education
Programmes”, and to contribute scientific, technological, cultural life of our region and country via combining
this programme with particular social, cultural and human science programmes.
Our university carries out the educational facilities by taking the students, the reason of our university’s
existence, into the centre. Interactive education model is adopted in our university. Our university aims to provide
successful careers to the students by gaining the way approaching to the problems within the scope of solutions
oriented and the skill of thinking analytically. Ağrı İbrahim Çeçen University will become a universal university
making powerful relations with the society by the scientific studies and education services and adopting the
universal values and also making effort to be a leading university in higher education.
Ağrı İbrahim Çeçen University has science education units at several schools such as Patnos Sultan Alpaslan
Faculty of Natural Sciences and Engineering, Faculty of Science and Letters, Faculty of Education, Vocational
Russia and Iran, the journal will contribute international recognition of our university. The articles which will
be published in EAJS will have a great role in the cultural development of our city and region.
EAJS will provide our students and scholars the opportunity of getting the genuine science from its sources
as well as enabling us to publish our scholars’ scientific works which are of good quality. In this regard, our
university will become more renowned in international scientific communities.
I, hereby, would like to send my sincere thanks to the editorial board, exclusively to the Editor-in-Chief, of
EAJS for their precious efforts. I’d like to express my gratitude to all our authors and contributing reviewers. I
believe we will see the best papers of scholars in EAJS. Last but not least, my special thanks go to the respectable
businessman Mr. İbrahim Çeçen, who unsparingly supports our university financially and emotionally, to his
team and to the director and staff of IC foundation.
Prof. Dr. İrfan ASLAN
On behalf of the Editorial Board and my Associate Editor, I am very happy to announce the publication of the first
issue of Eastern Anatolian Journal of Science (EAJS). I believe that EAJS, which is the fruit of an intensive and devoted
teamwork, will have an invaluable contribution to the scientific world.
At the end of busy schedule of nearly one year, we have now achieved to publish the first issue of EAJS under the
name of Ağrı İbrahim Çeçen University. As part of our efforts, we have decided on the frequency and publication type
of the journal as well as determining aim and scope.
Then, we have contacted with distinguished scholars in order to appoint the Editorial Board members. Meanwhile,
we have officially launched the journal’s website and completed necessary infrastructure for ULAKBİM’s JournalPark
membership.
As a result of this meticulous work, we reunite six research articles from Chemistry, Earth Sciences, Mathematics and
Physics disciplines with readers. These articles, which have undergone review and language editing process, have been
published in the first issue of EAJS. I would like to thank to all contributing authors and reviewers of this issue.
Ağrı İbrahim Çeçen University, which was founded in 2007 and completed its physical development in a short
time, is on its way to be at the top among Turkish universities. With his great efforts for our university, Prof. Dr. İrfan
Aslan, our esteemed rector, sets the goal of being also a top-ranking university in scientific sense. My sincere thanks
go to Prof. Dr. İrfan Aslan, the president of Ağrı İbrahim Çeçen University, for supporting and motivating us in every
respect. Special thanks are also due to the Associate Editor of EAJS, Dr. Ahmet Ocak Akdemir, for completing all legal
procedures that are necessary for the publication of EAJS. I am also grateful to our section editors and members of
editorial board of the journal. I express my gratitude to the members of technical committee of the journal for the design
and proofreading of the articles.
Last but not least, I owe Mr. İbrahim Çeçen, distinguished businessman, and the staff of IC Foundation a debt of
gratitude for their boundless support on the publication process of our journal.
I invite scientists from all branches of science to contribute our journal by sending papers for publication in EAJS.
Prof. Dr. Yusuf BAYRAK
Editor-in-Chief
Dean of Patnos Sultan Alpaslan Faculty of
Natural Sciences and Engineering
An Evalua•on of Earthquake Hazard Parameters in and
around Ağrı, Eastern Anatolia, Turkey ... 1-9
YUSUF BAYRAK, AYŞE NUR ATMIŞ, FATMA TEMELLİ,
HIWA MOHAMMADI, ERDEM BAYRAK, SEYDA YILMAZ,
TUĞBA TÜRKER
A Preliminary Indoor Gamma-ray Measurements in Some of
the Buildings at Karadeniz Technical University
(Trabzon, Turkey) Campus Area ... 10-19
HAKAN ÇINAR, SUNA ALTUNDAŞ
Effec•ve annealing of ZnO thin films grown by three different
SILAR processes ... 20-24
Harun GÜNEY, M. Emrah ERTARĞIN
Effects of some heavy metals on the ac•vi•es of carbonic
anhydrase enzymes from tumorous and non-tumorous
human stomach ... 25-28
EMRAH YERLİKAYA, RAMAZAN DEMİRDAĞ,
ÖMER İRFAN KÜFREVİOĞLU, CEMAL GÜNDOĞDU
Further instability result on the solu•ons of nonlinear vector
differen•al equa•ons of the fi"h order ... 29-34
MELİKE KARTA
3-People non-zero-sum games and geometric presenta•on
on game theory ... 35-42
ÇİĞDEM İNCİ KUZU, BÜLENT KARAKAŞ
An Evaluation of Earthquake Hazard Parameters in and around Ağrı,
Eastern Anatolia, Turkey
YUSUF BAYRAK1, AYSE NUR ATMIŞ1, FATMA TEMELLİ1, HIWA MOHAMMADI2, ERDEM BAYRAK3,
ŞEYDA YILMAZ3, TUĞBA TÜRKER3 1 Ağrı İbrahim Çeçen University, Ağrı, Turkey 2 Shiraz University, Department of Earth Sciences, Iran
3 Karadeniz Technical University, Department of Geophysics, Trabzon, Turkey
Abstract
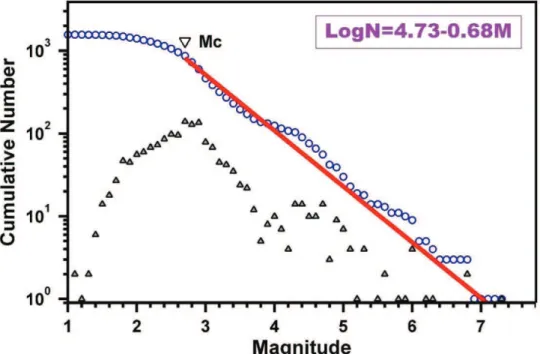
The earthquake hazard parameters of a and b of Gutenberg-Richter relationships, return periods, expected maximum magnitudes in the next 100 years and probabilities for the earthquakes for certain magnitude values are computed using the earthquakes occurred between 1900 and 2014 years in and around Ağrı. The relation of LogN=4.73-0.68M is calculated for the studied area. The mapping of b values show that the regions in the east and southeast of Ağrı, east of Horasan and around Patnos where low b values are computed have high stress levels and capacity to generate large earthquakes in the future. It is found that earthquakes larger than 5.5 may be occurred in the regions where b values lower than 0.8 have been observed in the next 100 years. The return periods for magnitudes between 5.0 and 7.3 are estimated between 5 and 176 years in the studied area, respectively. The probabilities of an earthquake with M=6.0, 6.5 and 7.0 in the next 100 years are computed 99%, 86% and 59%, respectively. The largest earthquake occurred in the studied area is 7.3 and its occurrence probability is 43% in the next 100 years. The faults around Ağrı are seismically active and have potential for an earthquake larger than 6.0. Since the sediment basin of Ağrı is very young and alluvial layer is tick, there is very high hazard on the buildings and human’s life in Ağrı.
Keywords: b values, return period, expexted maxium, magnitude, Ağrı, Eastern Anatolia.
1. Introduction
The region in and around Ağrı (42.0-44.2 oE and 39.0-40.5 oN) covers seismically tectonic features such as Ağrı Fault, Bulanık Fault, Çaldıran Fault, Ercis Fault, Horasan Fault, Çobandede Fault Zone, Iğdır Fault, Malazgirt
Accepted date: 15.04.2015 Corresponding author: Yusuf Bayrak, PhD
Agri İbrahim Çeçen University, Ağrı, Turkey E-mail: [email protected]
Fault, Balıklıgölü Fault Zone, Kağızman Fault Zone, Doğubayazıt Fault Zone, Karayazı Fault and Tutak Fault Zone. Since these faults produce some large earthquakes (04 April 1903 Malazgirt (M=6.3), 13 September 1924 Pasinler (M=6.8), 24 November 1976 Çaldıran (M=7.3) and 30 October 1983 Horasan–Narman (M=6.8) during instrumental earthquake time period, it is very important to reveal earthquake hazard and risk in the area (BOZKURT 2001).
Many quantitative methods have been applied over the years to estimate seismicity in various regions of the world. Several local and regional seismic hazard studies (ASLAN 1972; BATH 1979; YARAR et al. 1980; ERDIK
et al. 1999; KAYABALI and AKIN 2003; BAYRAK et al.
2005; 2009) have been performed in order to estimate the seismic hazard in Turkey using the statistical processing of instrumental earthquake data.
The most popular method used is the frequency-magnitude relationship of Gutenberg-Richter (G-R). A large number of studies on a and b parameters of G-R relationship have been presented since Gutenberg and Richter introduced their law about the earthquake magnitudes distribution. The different methods such as least square (LS) or maximum likelihood estimation (MLE) can be applied to compute these parameters which are very important in earthquake hazards and risk studies. The different hazard parameters such as the mean return period for an earthquake occurrence, the most probable maximum magnitude of earthquakes in a certain time interval and the probabilities for the large earthquakes occurrences during certain times using the parameters of G-R relationships. BAYRAK et al. (2015) applied this method to the different regions of the East Anatolian Fault.
Aim of this study is to evaluate the earthquake hazard in and around Ağrı in terms of different hazard parameters. For this purpose, the mean return period, expected maximum magnitude of earthquakes in the next 100 years and the probabilities for the large earthquakes occurrences in the next 25, 50 and 100 years are computed from the parameters of G-R relationships using MLE.
2. Data
The database used was compiled from different sources and catalogs such as Turkey National Telemetric Seismic Network (TURKNET), Incorporated Research Institutions for Seismology (IRIS), the International Seismological Centre (ISC) and The Scientific and Technological Research Council of Turkey (TUBITAK) and is provided in different magnitude scales. The catalogs include different magnitudes scales (Mbbody wave magnitude, Ms surface wave magnitude, ML local magnitude, MD duration magnitude and MW moment magnitude), the origin time epicenter and depth information of earthquakes.
An earthquake data set used in seismicity or seismic hazard studies must certainly be homogenous, in other words, it is necessary to use the same magnitude scale. However, the earthquake data obtained from different catalogs have been reported in different magnitude scales. Therefore, all earthquakes must be defined in the same
magnitude scale. BAYRAK et al. (2009) developed some relationships among different magnitude scales (Mb body wave magnitude, Ms surface wave magnitude, ML local magnitude, MD duration magnitude and MW moment magnitude) in order to prepare a homogenous earthquake catalog from different data sets.
We prepared a homogenous earthquake data catalog for Ms magnitude using relationships and have considered only instrumental part of the earthquake catalogue (1900-2014). Finally, the catalog includes 1569 earthquakes with
Ms ≥1.1. The graphs of magnitude-earthquake number and years-cumulative earthquake number are shown in Figure 1. The recorded earthquake numbers have increased after 1976 depending on installed seismograph stations in the studied area. Also, a large amount of magnitude of recorded earthquakes are lower than 4.0 and the size of nine earthquakes are larger than 6.0.
Figure 1. The graphs of, a) Earthquake number versus magnitude and b) cumulative number versus time for earthquakes in and around Ağrı
3. Tectonics and Seismicity
The neotectonic evolution of the eastern Anatolian region has been dominated by the collision of the Arabian plates with the Eurasian plate along the Bitlis-Zagros suture zone (Figure 2). The eastern Anatolian contractional province including the eastern Anatolian high plateau and the Bitlis-Pötürge thrust zone consists of an amalgamation of fragments of oceanic and continental crusts that squeezed and shortened between the Arabian and Eurasian plates. This collisional and contractional zone is being accompanied by the tectonic escape of most of the Anatolian plate to the west by major strike-slip faulting on the right-lateral north Anatolian transform fault zone and left-lateral east Anatolian transform fault zone which meet at Karlıova (ELITOK and DONMEZ 2011).
Depending on a N–S compressional tectonic regime, intra-plate deformation is dominant in the eastern Anatolian. Conjugate strike-slip faults of dextral and
sinistral character paralleling to North and East Anatolian fault zones are the dominant structural elements of the region. Some of these structures include Ağrı Fault (AF), Bulanık Fault (BF), Çaldıran Fault (ÇF), Ercis Fault (EF), Horasan Fault (HF), Çobandede Fault Zone (ÇFZ), Iğdır Fault (IF), Malazgirt Fault (MF), Balıklıgölü Fault Zone (BFZ), Kağızman Fault Zone (KFZ), Doğubayazıt Fault Zone (DFZ), Karayazı Fault (KYFZ) and Tutak Fault Zone (TFZ), in the studied area shown by rectangular area in Figure 1. Many pull-apart basins have developed along these structures (e.g., Erzurum and Ağrı basins). Although the conjugate strike-slip fault system dominate the active tectonics of eastern Anatolia, the E–W trending basins of compressional origin form the most spectacular structures of the region as they indicate the N–S convergence and shortening of the Anatolian plateau. Muş, Lake Van and Pasinler basins form the best examples of ramp basins in the region (BOZKURT 2001).
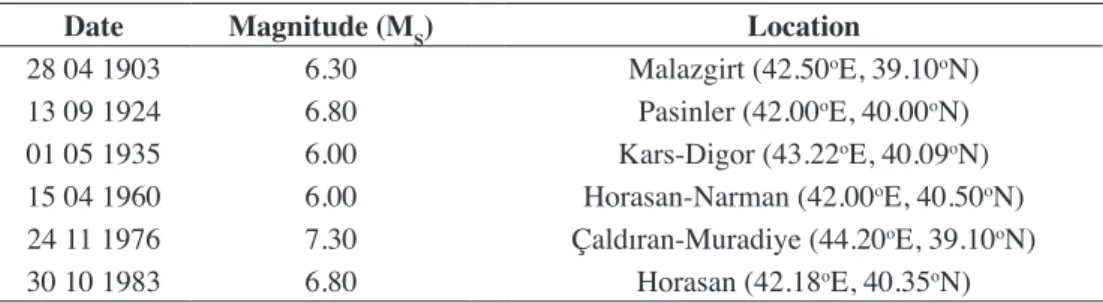
The epicenter distribution of earthquakes larger than M=3.0 is shown in Figure 3. The faults in the studied area are seismically active and form the source for many earthquakes. The largest earthquakes, listed in Table 1,
occurred in the region are 04 April 1903 Malazgirt (M=6.3), 13 September 1924 Pasinler (M=6.8), 24 November 1976 Çaldıran (M=7.3) and 30 October 1983 Horasan–Narman (M=6.8) (BOZKURT 2001).
Figure 2. The tectonics in and around Ağrı. The rectangle shows the study area. Ağrı Fault (AF), Bulanık Fault (BF), Çaldıran Fault (ÇF), Ercis Fault (EF), Horasan Fault (HF), Çobandede Fault Zone (ÇFZ), Iğdır Fault (IF), Malazgirt Fault (MF), Balıklıgölü Fault Zone (BFZ), Kağızman Fault Zone (KFZ), Doğubayazıt Fault Zone, Karayazı Fault (KYFZ) and Tutak Fault Zone (TFZ) (BOZKURT,
2001).
Figure 3.The epicenter distribution of earthquakes occurred in around Ağrı.
4. Methods
The empirical relationship, known as G–R law, between the frequencies of earthquake occurrences and magnitudes can be expressed in the following formula:
(1)
where N is the cumulative number of earthquakes with a magnitude of M and greater, a and b are constants. b is the slope of the frequency–magnitude distribution, and a is the activity level of seismicity. GUTENBERG and RICHTER (1944) firstly estimated the constants known as seismicity parameters. The parameter a exhibits significant variations from region to region as it depends on the level of seismic activity, the period of observation and the length of the considered area as well as the size of earthquakes. The b value for a region not only reflects the relative proportion of the number of large and small earthquakes in the region, but is also related to the stress conditions over the region. Many factors can cause perturbation of the normal b value. On average, the b value is near unity for most seismically active regions on the Earth (e.g. FROHLICH and DAVIS 1993). In a tectonically active region, the b value is normally close to 1.0 but varies between 0.5 and 1.5 (PACHECO et al. 1992; WIEMER and WYSS 1997). However, a detailed mapping of b value often reveals significant deviations. The spatial variations of b values are related to the distribution of stress and strain (MOGI 1967; SCHOLZ 1968). In addition, some researchers link the b-value with the parameters of the rupture process. An example is SCHORLEMMER et al. (2005), who showed that the b-value is dependent on the faulting style. As pointed out by AMITRINO (2012), in laboratory experiments with brittle rocks, the b-value depends on the mechanical loading, which is the type of faulting, the confining pressure, or the roughness of the fault sliding surfaces. These observations agree with the dependence of the b-value on friction and/or mean stress. The distinction between these two factors remains difficult because they are correlated, as friction decreases when the confining pressure increases (GOEBEL et al. 2012). On the other hand, high b values are reported from areas of increased geological complexity (LOPEZ et al. 1995), indicating the importance of a multifracture area. Increased
material heterogeneity or crack density results in high b values (MOGI 1962). Thus, a low b value is related to a low degree of heterogeneity, large stress and strain, large velocity of deformation and large faults (MANAKOU and TSAPANOS 2000).
b values were first estimated by GUTENBERG and RICHTER (1944) for various regions of the world. They suggested that b values range from 0.45–1.50, while MIYAMURA (1962) found that b values change from 0.40–1.80 according to the geological age of the tectonic area. Global seismicity has been studied by several authors, and it has been found that b values vary between 1.0 and 1.6 (MOGI, 1962), 0.8–1.2 (McNALLY 1989), 0.6–1.5 (UDIAS and MEZCUA 1997) and 0.53–1.19 (BAYRAK
et al. 2002). The b value for any region can be computed using several methods such as linear least squares regression or by MLE which is the most robust and widely accepted method in which the b value is calculated using the formula (AKI 1965);
(2) Where Where is the average magnitude, and
presenting the data. In order to evaluate these parameters, we used to ZMAP is the average magnitude, and Mmin is the
minimum value of the magnitude presenting the data. In order to evaluate these parameters, we used to ZMAP 6 software package (WIEMER 2001).
The parameter at depends on the seismicity of the area, on the time interval for which we have reported events and also on the surface area S outlined by the epicenters. For seismicity study purposes usually at is expressed in one year by the equation:
(3)
where t is the whole time period covered by the data set. The expected time interval for the occurrence of an earthquake with a magnitude greater than or equal to M is defined as the mean return periods Tm and is given by:
(4) This quantity is adopted as a measurement of seismicity. The most probable maximum magnitude of earthquakes in a time period of t years:
Table 1. The large earhquakes occurred in and around Ağrı.
Date Magnitude (MS) Location
28 04 1903 6.30 Malazgirt (42.50oE, 39.10oN) 13 09 1924 6.80 Pasinler (42.00oE, 40.00oN) 01 05 1935 6.00 Kars-Digor (43.22oE, 40.09oN) 15 04 1960 6.00 Horasan-Narman (42.00oE, 40.50oN) 24 11 1976 7.30 Çaldıran-Muradiye (44.20oE, 39.10oN) 30 10 1983 6.80 Horasan (42.18oE, 40.35oN)
Where is the average magnitude, and
(5) The probability Pt for an earthquake occurrence with magnitude ≥ M during the time span of t years:
(6) In this paper, we aimed to make a quantitative appraisal of earthquake hazard parameters in and around Ağrı. Particularly the analysis of the expected time interval for the occurrence of an earthquake, the most probable maximum magnitude of earthquakes in a given time period and the probability of an earthquake occurrence supply information on the earthquake hazard. We used a
MSmagnitude scale in these equations since our catalogue is uniform of MS.
5. Discussion and Conclusions
We used 1569 earthquakes occurred between 1900-2014 years in the region of 42.0-44.2 oE and 39.0-40.5 oN in order to evaluate earthquake hazard parameters in and around Ağrı. For this purpose, a and b parameters
of G-R relationships, return periods, expected maximum magnitudes in the next 100 years and probabilities for the earthquakes for certain magnitude values are computed.
In this study, b value is calculated using ZMAP 6 software (WIEMER 2001). In particular, the b value was obtained by MLE estimation, using Equation (2). An estimation of standard deviation (δb) in b value can be obtained using the equation derived by AKI (1965) and modified by SHI and BOLT (1982):
(7) where, n is the sample size.
The cut-off magnitude (Mc) for the studied area shown in Figure 3 was estimated to be equal to 2.7 ± 018 with 90% goodness of fit level (Figure 4). The a and b values for this sequence shown in Figure 4 were estimated to be equal to 4.73 ± 0.22 and 0.68 ± 0.04, respectively with 90% goodness of fit level. The b value is lower than the global mean value of 1.0, which indicates that the data consists of larger earthquakes and high differential crustal stress in the region (WIEMER and KATSUMATA 1999; WIEMER and WYSS 2002).
The probability P for an earthquake occurrence with magnitude ≥ M during the time span of
Figure 4. The relationship of Gutenberg- Richter for the earthquakes occurred in around Ağrı.
Figure 4.The relationship of Gutenberg- Richter for the earthquakes occurred in around
Spatial mapping of b values provides detailed information about seismotectonic situation in the studied area. For this purpose, data are projected onto a plane to visualize values of b as a function of space. The mapping of b values is performed in a 0.1° × 0.1° grid, selecting the nearest 50 events in each node and 25 events of the minimum number. The estimated b value varies from 0.4 to 1.55 as seen from Figure 5. The b values lower than 0.8 are related to the area with high-stress regions including IF, DBFZ, BFZ, ÇF, EF and HF. b values between 0.8 and
1.0 are found in the region covering TF and KYFZ. It is observed b values larger than 1.0 in the west, northwest and southwest of Ağrı. It reveals that this region is associated with highly heterogeneous and fractured rock matrix that may be associated with fluids or viscous materials with fluids into the fractured rock matrix (SINGH et al. 2012a, b). The regions in the east and southeast of Ağrı, east of Horasan and around Patnos are related to b values lower than 0.8. It can be concluded that these regions have high stress levels and capacity to occur large earthquakes in the future time.
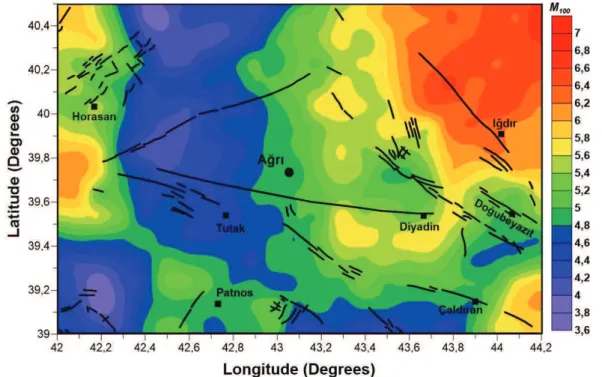
Spatial mapping of M100values which computed by Equation 5 is shown in Figure 6. M100is the most probable maximum magnitude of earthquakes in a time period of next 100 years. The mapping of M100 values is performed in a 0.1° × 0.1° grid interval. The computed values change between 3.6 and 7.0 as shown in Figure 6. The values larger than 6.0 are computed in the IF, DBFZ, ÇF, HF and ÇFZ which produce large earthquakes as shown in Figure 2. The earthquake hazard level in the regions of Doğubeyazıt-Iğdır, Horasan-Pasinler and Çaldıran-Muradiye is very high and there is a probability to occur an earthquake larger than
6.0 in this region in the next 100 years. The magnitudes of expected earthquakes in the region between Ağrı and Horasan are lower than 5.0. The results show that there is an earthquake hazard about 5.5 around Patnos. The results show that the earthquakes larger than 5.5 may be occurred in the regions of the east and southeast of Ağrı, Horasan-Pasinler and around Patnos where b values lower than 0.8 have been observed (Figure 5), It can be concluded that these regions have high stress levels and capacity to occur large earthquakes in the next 100 years.
Figure 5. The spatial distribution of b values computed from Gutenberg-Richter relationships for the earthquakes occurred in around Ağrı.
Figure 6. The spatial distribution of M100 values (expected maximum earthquake in the next 100 years) computed from Gutenberg-Richter relationships for the earthquakes occurred in around Ağrı.
Figure 5.The spatial distribution of b values computed from Gutenberg-Richter relationships
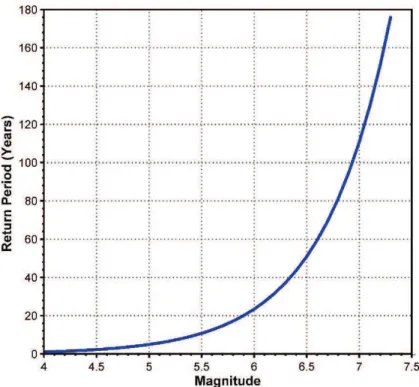
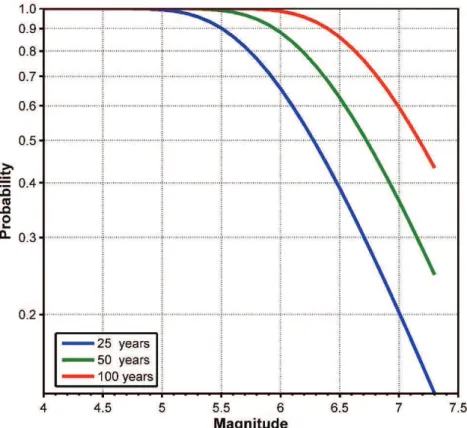
Earthquake recurrence times (return periods, Tm) computed from equation 4 and the probability of occurrence computed from equation 6 using the parameters of G-R relationship for the earthquakes larger a certain magnitude value during a given time span are listed in Table 2. Also, earthquake hazard curves expressed in terms of the return period and probabilities of earthquakes are shown in Figures 7 and 8. The mean return periods estimated for the studied area change between 5 and 176 years for magnitudes of 5.0-7.3 as listed in Table 2 and shown in Figure 7. For example, an earthquake equal to 6.0 which could cause damage to buildings and lost human may be occurred every 23 years. This is very high seismic risk value and we can conclude that the studied area very dangerous. Earthquake hazard curves expressed by the probability expected for earthquakes with the maximum observed magnitudes and plotted for magnitudes (and during the time span of 25, 50 and 100) are shown in Figure 8. The probabilities of an earthquake with M=6.0, 6.5 and 7.0 in the next 100 years are 99%, 86% and 59%, respectively. The magnitude of the largest earthquake occurred in the studied area is equal to 7.3 and the probability of it in the next 100 years is 43%.
Table 2. The large earhquake risk values for next 25, 50 and 100 years. Ms Earthquake Risk (%) Return Period(Tm) Years 25 50 100 5.0 0.99 1.00 1.00 5 5.1 0.99 1.00 1.00 6 5.2 0.98 1.00 1.00 7 5.3 0.96 1.00 1.00 8 5.4 0.93 1.00 1.00 9 5.5 0.9 0.99 1.00 11 5.6 0.86 0.98 1.00 13 5.7 0.82 0.97 1.00 15 5.8 0.77 0.95 1.00 17 5.9 0.71 0.92 0.99 20 6.0 0.66 0.88 0.99 23 6.1 0.6 0.84 0.97 27 6.2 0.54 0.79 0.96 32 6.3 0.49 0.74 0.93 37 6.4 0.44 0.68 0.9 44 6.5 0.39 0.63 0.86 51 6.6 0.34 0.57 0.81 59 6.7 0.3 0.51 0.76 69 6.8 0.27 0.46 0.71 81 6.9 0.23 0.41 0.65 95 7.0 0.2 0.36 0.59 111 7.1 0.18 0.32 0.54 129 7.2 0.15 0.28 0.48 151 7.3 0.13 0.25 0.43 176
Figure 7. The return periods of earthquakes in around Ağrı.
There is not any risk to occur earthquake larger than 5.0 in the center of Ağrı according to spatial distribution of
b and M100 shown in Figures 6 and 7 in the next 100 years. But, Ağrı is surrounded by active faults and probability of earthquakes greater than 6.0 in these faults is very high. There is a liquefaction risk in Ağrı due to a young sediment basin and alluvial layer is tick. We can concluded that there is very high hazard on the buildings and human’s life considering liquefaction associated with an earthquake might occur and this alluvium layer grows up to ten times the earthquake waves (SEMBLAT et al. 2005).
6. Results
The earthquake hazard parameters in and around Ağrı was evaluated for time interval of 1900-2014 years. For this purpose, a and b parameters of G-R relationships, return periods, expected maximum magnitudes in the next 100 years and probabilities for the earthquakes for certain magnitude values are computed. a and b values for this time period were estimated to be equal to 4.73 and 0.68, respectively. This b value shows that that the data consists of larger earthquakes and high differential crustal stress in the region. The regions in the east and southeast of Ağrı, east of Horasan and around Patnos have high stress levels and capacity to occur large earthquakes in the future time according to the mapping of b values. It is found that earthquakes larger than 5.5 may be occurred in the regions where b values lower than 0.8 have been observed in the next 100 years. The return periods in the
studied area are estimated between 5 and 176 years for magnitudes of 5.0-7.3. The probabilities of an earthquake with M=6.0, 6.5 and 7.0 in the next 100 years are computed 99%, 86% and 59%, respectively. The probability of the largest earthquake occurred in the studied area is 43% in the next 100 years. The faults around Ağrı are seismically active and have potential to an earthquake larger than 6.0. Since the sediment basin of Ağrı is very young and alluvial layer is tick, there is very high hazard on the buildings and human’s life in Ağrı.
Acknowledgements: The authors would like to express their sincere thanks to Prof. Dr. Ali Pınar and the reviewers for the suggestions made in order for the paper to be improved. Also, the authors are grateful to Ağrı İbrahim Çeçen University BAP (Turkey) for partially supporting this work (with project number: PDBMF.15.001).
REFERENCES
AKI, K. (1965), Maximum likelihood estimate of b in the formula
log N = a - bM and its confidence limits. Tokyo Univ. Bull. Earthq. Res. Inst. 43, 237–239.
AMITRANO, D. (2012), Variability in the power-law distribution
of rupture events. How and why does b-value change?
European Physical Journal Special Topics. 205, 199-215.
ASLAN, E. (1972), Magnitude and time distributions of
earthquakes in Turkey. Bull Int Inst Seismol Earthq Eng.
7, 1–10.
BATH, M. (1979), Seismic risk in Turkey—a preliminary
approach. Tectonophysics. 54, 9–16.
BAYRAK,Y., YILMAZTURK, A., and OZTURK, S. (2005),
Relationships between fundamental seismic hazard parameters for the different source regions in Turkey. Nat Hazards. 36, 445–462.
BAYRAK, Y., OZTURK, S., CINAR, H., KALAFAT, D., TSAPANOS, T. M., KORAVOS, C.G., and LEVENTAKIS, G.A. (2009), Estimating earthquake
hazard parameters from instrumental data for different regions in and around Turkey. Eng Geol. 105, 200–210. BAYRAK, Y., OZTURK, S., and ERDURAN, A., (2002),
The relationships between maximum magnitudes and modal values for different regions of Turkey. 3rd balkan geophysical congress and exibition. 8–4, 24–28 June, Sofia, Bulgaria.
BAYRAK, E., YILMAZ, Ş., SOFTA, M., TURKER, T., and BAYRAK, Y. (2015), Earthquake hazard analysis for
East Anatolian Fault Zone, Turkey, Nat. Hazards. 76, 1063-1077.
BOZKURT, E. (2001), Neotectonics of Turkey – a synthesis. Geodinamica Acta. 14, 3-30.
ELITOK, O. and DOLMAZ, M.N. (2011), Tectonic Escape
Mechanism in the Crustal Evolution of Eastern Anatolian Region (Turkey), New Frontiers in Tectonic Research - At the Midst of Plate Convergence, Dr. Uri Schattner (Ed.), ISBN: 978-953-307-594-5, InTech, Available from: http://www.intechopen.com/books/newfrontiers-in-tectonic-research-at-the-midst-of-plate-convergence/ tectonic-escape-mechanism-in-the-crustalevolution-of-eastern-anatolian-region-turkey
ERDIK, M., ALPAY, B. Y., ONUR, T., SESETYAN, K., and BIRGOREN, G. (1999), Assesment of earthquake hazard
in Turkey and neighboring regions. Ann Geophys. 42, 1125–1138.
FROHLICH, C., and DAVIS, S.C. (1993), Teleseismic b values;
or, much ado about 1.0. J Geophys Res. 98, 631–644. GUTENBERG, R., RICHTER, C.F. (1944), Earthquake
magnitude, intensity, energy and acceleration, Bull Seismol Soc Am. 32, 163–191.
GOEBEL, T.H.W., SCHORLEMMER, D., DRESEN, G., and BECKER, T.W. (2012), Stress-driven in bv alues during
stick-slip on laboratoty fracture granite surfaces. Journal of Geophysical Research. Doi:10.1029
KAYABALI, K., AKIN, M. (2003), Seismic hazard map of
Turkey using the deterministic approach. Eng GeoL.
69,127–137.
LOPEZ, C.C., SANZ DE GALDANO, C., DELGADO, J., and PEINADO, M.A. (1995), The b parameter in the Betic
Cordillera, Rif and nearby sectors. Relations with the Tectonics of the region. Tectonophysics. 248, 277–292. MANAKOU, M.V., and TSAPANOS, T.M. (2000), Seismicity
and seismic hazard parameters evaluation in the island of Crete and the surrounding area inferred from mixed files. Tectonophysics. 321, 157–178.
MIYAMURA, S. (1962), Magnitude–frequency relations and its
bearing on geotectonics. Proc Jpn Acad. 38, 27–30. MOGI, K. (1962), Magnitude–frequency relationship for elastic
shocks accompanying fractures of various materials and
some related problems in earthquakes. Bull Earthq Res Inst Univ Tokyo. 40, 831–883.
MOGI, K. (1967), Earthquakes and fractures, Tectonophysics.
5, 35–55.
MCNALLY, K.C. (1989), Earthquakes and seismicity. In: James
DE (ed) The encyclopedia of solid earth geophysics.
Springer, 308–315.
PACHECO, J., SCHOLZ, C., and SYKES, L. (1992), Changes
in frequency–size relationship from small to large earthquakes. Nature. 355, 71–73.
SCHOLZ, C.H. (1968), The Frequency–magnitude relation of
microfracturing in rock and its relation to earthquakes,
Bull Seismol Soc Am. 58, 399–415.
SCHORLEMMER, D., WIEMER, S., and WYSS, M. (2005),
Variations in earthquake size distribution across different stress regimes, Nature. 437, 539–542.
SEMBLAT, J.F, KAHAM, M., PARARA, E., BARD, P.Y., PITILAKIS, K., MAKRA, K. and RAPTAKIS, D. (2005),
Seismic wave ampications: Basin Geometry vs soil layering, Soil Dynamics and Earthquake Engineering. 25 (7-10), 529-538.
SHI, Y., and BOLT, B.A. (1982), The standard error of the
magnitude-frequency b-value, Bull. Seismol. Soc. Am.
72, 1677 – 1687.
SINGH, A.P., MISHRA, O.P., YADAV, R.B.S., and KUMAR, D. (2012a), A new insight into crustal heterogeneity beneath
the 2001 Bhuj earthquake region of northwest India and its implications for rupture initiations, Journal of Asian Earth Sciences. 45, 31–42.
SINGH, A.P., MISHRA, O.P, KUMAR, D., KUMAR, S., and YADAV, R.B.S. (2012b), Spatial variation of the
aftershock activity across the Kachchh Rift Basin and its seismotectonic implications, Journal of Earth System Sciences. 121 (2), 439–451.
UDIAS, A., and MEZCUA, J. (1997), Fundamentos de Geofisica,
QE 501. Alianza Editorial, Madrid.
WIEMER, S., and WYSS, M. (1997), Mapping the frequency–
magnitude distribution in asperities: an improved technique to calculate recurrence times, J. Geophys Res.
102, 15115–15128.
WIEMER, S., and KATSUMATA, K. (1999), Spatial variability
of seismicity parameters in aftershock zones. J. Geophys. Res. 13, 135-151.
WIEMER, S. (2001), A software package to analyze seismicity:
ZMAP. Seismol Res Lett. 72, 373–382.
WIEMER, S., and WYSS, M. (2002), Mapping spatial variability
of the frequencymagnitude distribution of earthquakes,
Adv. Geophys. 45, 259–302.
YARAR, R., ERGUNAY, O., ERDIK, M., and GULKAN, P. (1980), A preliminary probabilistic assessment of the
seismic hazard in Turkey. In: Proceedings of the 7th World conference on earthquake Engineering, Istanbul. 309–316.
A Preliminary Indoor Gamma-ray Measurements in Some of the Buildings at
Karadeniz Technical University (Trabzon, Turkey) Campus Area
HAKAN ÇINAR1, SUNA ALTUNDAŞ1
1 Karadeniz Technical University, Department of Geophysical Engineering, Trabzon, Turkey
Abstract
Indoor gamma radiation dose rate and natural radionuclide concentrations (238U, 232Th, and 40K) were measured inside former Geoscience Faculty Buildings of Karadeniz Technical University in Trabzon using a 512-channel portable gamma-ray spectrometer with a sodium iodide during the six-month period. Spectrometry data were collected on all floors for each building. The average radionuclide concentrations of 238U, 232Th, 40K and dose rate in the buildings were found to be about 4.07 ppm, 11.58 ppm, % 1.98 and 79.03 nGy/h for Dean Building, 4.81 ppm, 13.38 ppm, % 2.52 and 94.2 nGy/h for Geophysical Engineering Building, 4.03 ppm, 13.14 ppm, %2.59 and 89.99 nGy/h for Geology Engineering Building, 3.76 ppm, 14.15 ppm, %2.68 and 92.34 nGy/h for Geomatics Engineering Building, respectively. In addition to this, the radiation hazard parameters (absorbed dose in the air, radium equivalent activity, internal hazard index and annual effective dose equivalent) for indoor environment were calculated and then jointly interpreted in order to find out the whether a radiological hazard exists in these buildings. As a result from this study, there is no significant radiologic hazard for human in studied buildings.
Keywords: Gamma-ray spectrometer, Uranium,
Thorium, Potassium, Indoor radiation level, Radiation hazard parameters.
1. Introduction
Earth has a radioactivity since its existence. Radionuclides (radioactive elements) found in nature can be divided into three categories RAVISANKAR et al. (2012): The first one is called as primordial (terrestrial) radionuclides, which are naturally occurred in the Earth’s crust since creation of the Earth. The second is cosmogenic
Accepted date: 16.04.2015 Corresponding author: Hakan Çınar, PhD
Karadeniz Technical University, Trabzon, Turkey E-mail: [email protected]
radionuclides formed as a result of cosmic-rays from space includes energetic protons, electrons, gamma ray, and x-ray. And the last one is human produced radionuclides enhanced or formed due to human actions.
Natural radionuclides are the components of the Earth. These are widely spread in Earth’s environment and exist in soil, sediment, water, building materials, plants and air. They are even found in the human body. There is nowhere on the Earth that one cannot find natural radioactivity. Radionuclides are unstable atoms that undergo spontaneous nuclear transformations and release excess energy in the form of ionizing radiation. The majority of human exposure to ionizing radiation occurs from natural sources (i.e. cosmic rays and terrestrial radiation) UNSCEAR (2000). Gamma rays as an electromagnetic ray often accompany the emission of alpha or beta particles from a nucleus. Gamma ray accounts for the majority of external human exposure to radiation from all source types due to its high penetration ability (ATSDR 1999; AL-SALEH 2007). Physical and chemical processes occurring following the radiation exposure involve successive changes at the molecular, cellular, tissue and whole body levels that may lead to a wide range of health effects varying from simple irritation, radiation-induced cancer, and hereditary disorders to immediate death (ATSDR 1999). Indoor exposure to gamma rays is often greater than outdoor exposure if earth materials are used as construction materials (HAZRATI et al. 2010).
All building materials such as concrete, brick, sand, aggregate, marble, granite, limestone, gypsum, etc., contain mainly natural radionuclides, including uranium (238U) and Thorium (232Th) and their decay products, and the radioactive potassium (40K). The knowledge of the
natural radioactivity of building materials is important for the determination of population exposure to radiations, as most of the residents spend about 80% of their time indoors. Building materials contribute to natural radiation exposure in two ways. First, by gamma radiation, from 40K, 238U, 232Th, and their decay products to an external whole
body dose exposure and secondly by radon exhalation to an internal dose exposure due to deposition of radon decay products in the human respiratory tract (STOULOS et al. 2003).
During the last decades, there has been an increasing interest in the study of radioactivity in various building materials, and in-situ determination of indoor and outdoor radiation levels and their main effects on living environment (KUMAR et al. 2003; AHMAD and MATIULLAH HUSSAIN 1988; AMRANI and TAHTAT 2001; BERETKA and MATHEW, 1985; CHONG and AHMAD 1982; MOLLAH et al. 1986; VIRESHKUMAR et al. 1999; ZAIDI et al. 1999; EL-ARABI 2005; EL-TAHAWY and HIGGY 1995; KHAN et al. 2002; MCAULAY and MORAN 1988; ALI et al. 1996; STOULOS et al. 2003; TUFAIL et al. 2007, BALCIOĞLU and APAYDIN 2013, ÇINAR et al. 2013).
Indoor gamma exposure measurements-related studies have mainly been carried out using Gamma-ray spectrometry and HPGe detector by various authors (CLOUVAS et al. 2001; BALDASSARRE and SPIZZICO 2002; CLOUVAS et al. 2004; XINWEI and XIAOLAN 2006; BRAHMANANDHAN et al. 2007; MAVI and AKKURT 2010; MEHRA et al. 2010; MEHDIZADEH
et al. 2011; CEVIK et al. 2011; DAMLA et al. 2012; QUARTO et al. 2013). Soil-originated bricks and roof-tiles and their raw material in the Salihli-Turgutlu area were tested in situ for natural radiation levels using a gamma-ray spectrometer by UYANIK et al. (2013). DAMLA et
al. (2011) measured the natural radioactivity of the bricks and roofing tiles in the seven region of the Turkey. CELIK
et al. (2010) determined radioactivity levels in Ordu soil and building materials using gamma-ray spectrometry. As a result of this study, calculated all hazard parameters were found to be within the acceptable limits.
The main aim of this work is to measure indoor concentration levels (indoor gamma exposure) of naturally occurred 40K, 238U and 232Th in former Geoscience Faculty Buildings of Karadeniz Technical University using the 512-channel (NaI) gamma-ray spectrometer. Moreover, using obtained data, it is mainly aimed to calculate radiological hazard parameters such as the absorbed gamma dose rate in the air at 1 m above the ground level, annual effective dose, radium equivalent activity, and internal hazard index. Also, radionuclide concentrations that could be measured inside of buildings are graphed in order to show variations on the natural radiation level. Apart from these, all the calculated parameters are compared with the worldwide acceptable values in order to assess the possible radiological risks for human health in the studied buildings.
2. Materials and Method
In order to obtain the radiometric data for this study, indoor gamma exposure measurements were carried out, using the 512-channel (NaI) portable gamma-ray spectrometer (GF Instrument) (Figure 1), in the former Geoscience Faculty Buildings (Geophysical Engineering, Geology Engineering, Geomatics Engineering Departments and Engineering Faculty Dean Building).
Gamma-ray spectrometer was delivered with a factory calibration set to high-volume standards. To create a new user calibration, the probe is placed at the middle of the calibration pad. Concentrations of the calibration pad corrected by the geometrical factor (i.e. multiplied by the geometrical factor value). Geometrical factor G = 1- h/r, where h is the height of the middle of the detector above the pad (the value is given in the description of the probes) and r is the diameter of the pad. The recommended time for recalibration is 3–5 years (For more detailed information see IAEA 2003) (GF INSTRUMENTS 2009). The total energy window of instrument was set from 100 keV to 3.00 MeV. One channel is equal to 5,877 keV. The 1.76 MeV 214Bi peaks of the 238U series were used for the equivalent uranium analysis (eU), whereas equivalent thorium (eTh) was determined from the 2.62 MeV 208Tl peak of the 232Th series. The concentration of radioactive potassium was determined directly from 1.46 MeV 40K (KALYONCUOĞLU 2014).
Indoor gamma exposure measurements were performed in each floor of the buildings during the six-month period from November to April. Time duration of each measurement is about 300 seconds per point.
Figure 1. The Gamma-ray spectrometer (NaI detector and control unit)
As a result of the measurements, Potassium (K, %), equivalent Thorium (eTh, ppm), equivalent Uranium (eU, ppm) and dose rate (D, nGy/h) values for each point were obtained.
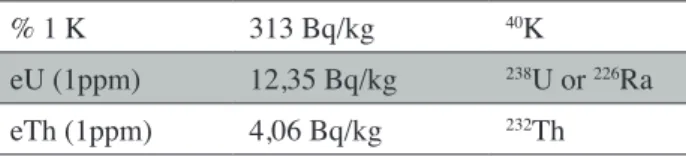
Measured radionuclide concentrations were converted to the main activity unit (Bq/kg) using an appropriate conversion factor given in Table 1 in order to determine the radiation hazard parameters of each point. After the activity concentrations of radionuclides determined, hazard parameters such as adsorbed dose rate in air, radium equivalent activity, annual effective dose equivalent, and internal hazard index for points inside the building were calculated.
Table 1. Conversion factors from equivalent concentration (ppm, %) to activity (Bq/kg) (IAEA 1989) % 1 K 313 Bq/kg 40K eU (1ppm) 12,35 Bq/kg 238U or 226Ra eTh (1ppm) 4,06 Bq/kg 232Th
The calculations described below were performed to determine the radiological risk in addition to the measured natural radionuclide concentrations. Gamma dose rate in air, one meter above the ground, is used for the description of terrestrial radiation, and is usually expressed in nGy/h or pGy/h. The absorbed dose rate due to gamma radiation of naturally occurring radionuclide (238U, 232Th, and 40K), were calculated on guidelines provided by (UNSCEAR 2000).
(1) Where 0.462, 0.621 and 0.0417 are the conversion factors for 238U, 232Th and 40K assuming that the contribution natural occurring radionuclide can be neglected as they contribute very little to total dose from environmental background.
To estimate annual effective doses, account must be taken of the conversion coefficient from absorbed dose in air to effective dose and the indoor occupancy factor. The average numerical values of those parameters vary with the age of the population and the climate at the location considered.
In the UNSCEAR 1993 Report, the Committee used 0.7 SvGy/y for the conversion coefficient from absorbed dose in air to effective dose received by adults and 0.8 for the indoor occupancy factor, i.e. the fraction of time spent indoors is 0.8. The annual effective dose is determined as follows: (UNSCEAR 1993).
(2) To represent the activity levels of 238U, 232Th and 40K which take into account the radiological hazards associated with them, a common radiological index has been
introduced. This index is called radium equivalent activity (Raeq) and is mathematically defined by (UNSCEAR 2000).
(3) Where AU, ATh and AK are the specific activities of Uranium, Thorium, and Potassium respectively. This equation is based on the estimation that 10 Bq/kg of 238U equal 7 Bq/kg of 232Th and 130 Bq/kg of 40K produced equal gamma dose. The maximum value of Raeq must be less than 370 Bq/kg.
To reflect the internal exposure, a widely used hazard index, called the internal hazard index (Hin), which is defined as following:
(4) The value of the index must be less than the unity in order to keep the radiation hazard to be insignificant unity corresponds to the upper limit of radiation equivalent activity (370 Bq/kg).
3. Result and Discussions
The indoor gamma exposure measurements were performed inside (including all floors) of buildings (Geophysical, Geology, and Geomatics Engineering Departments and Engineering Faculty’s Dean Building) during six-month period using portable NaI (Tl) detector in order to determine total gamma dose rates and radionuclide concentrations. Table 2 shows the average values of the 238U, 232Th, 40K concentrations, measured (D) and calculated absorbed dose in air (Dabsorbed), radium equivalent activity (Raeq), internal hazard index (Hin) and annual effective dose equivalent for indoor environment (AEDE) of buildings.
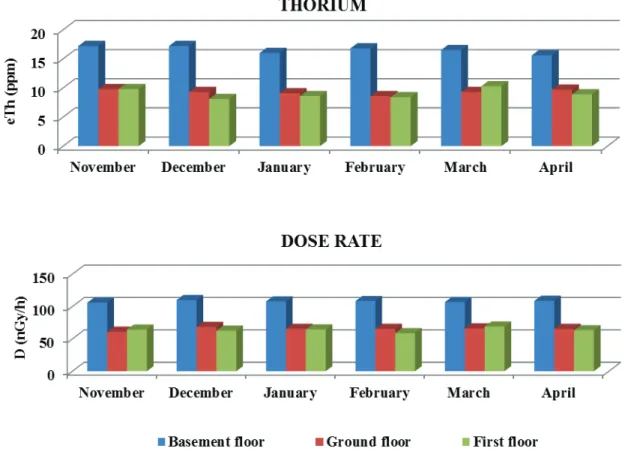
In general, these buildings are more than thirty years old. They were constructed with bricks, concrete (including sea-gravels as an aggregate) and sea-sands. Accordingly, relative contribution of different natural gamma emitters (238U, 232Th and 40K) to the gamma dose rate varies from building to building due to the construction materials. Following figures (Figs 2, 3, 4 and 5) show semi-annual radionuclide and dose rate distributions for each building.
The value of the index must be less than the unity in order to keep the radiation hazard
U (ppm) Th (ppm) K (%) Basement floor 5,58 16,55 2,65 Ground floor 3,3 9,3 1,76 First floor 3,33 8,9 1,54 Entire Building 4,07 11,58 1,98 Basement floor 3,83 11,93 2,29 Ground floor 5,35 14,1 2,49 First floor 5,083 13,76 2,58 Second floor 4,98 13,75 2,745 Entire Building 4,81 13,38 2,52 Basement floor 3,55 10,5 2,31 Ground floor 4,05 13,85 2,67
Table 2: Semi-annual average values for the radionuclideconcentrations and the gamma radiation hazard indicesfor studied buildings (including each floors and entire building).
U (ppm) Th (ppm) K (%) D (nGy/h) Dabsorbed (nGy/h) Ra(eq) (Bq/kg) Hin AEDE (mSv/y) Dean Building Basement floor 5,58 16,55 2,65 108,01 109,8 229,05 0,804 0,53 Ground floor 3,3 9,3 1,76 65,35 66,23 137,24 0,48 0,32 First floor 3,33 8,9 1,54 63,75 64,47 133,92 0,47 0,31 Entire Building 4,07 11,58 1,98 79,03 80,16 166,3 0,584 0,386 Geophysical En -gineering Basement floor 3,83 11,93 2,29 82,05 83,41 172,11 0,59 0,409 Ground floor 5,35 14,1 2,49 98,75 99,94 208,26 0,741 0,490 First floor 5,083 13,76 2,58 97,41 98,81 205,12 0,723 0,484 Second floor 4,98 13,75 2,745 98,81 100,40 207,64 0,727 0,492 Entire Building 4,81 13,38 2,52 94,2 95,64 198,28 0,695 0,468 Geology Engineering Basement floor 3,55 10,5 2,31 76,96 78,28 160,68 0,55 0,384 Ground floor 4,05 13,85 2,67 92,75 94,76 194,93 0,661 0,464 First floor 4,12 13,41 2,675 92,083 93,99 193,32 0,659 0,461 Second floor 3,88 13,73 2,68 91,71 93,68 192,40 0,649 0,459 Third floor 4,58 14,23 2,65 96,46 98,33 203,27 0,701 0,482 Entire Building 4,036 13,14 2,59 89,99 91,80 188,92 0,644 0,45 Geomatics Engineering Basement floor 4,06 14,56 2,73 95,65 97,65 200,87 0,678 0,479 Ground floor 3,91 13,83 2,6 91,28 93,13 191,62 0,648 0,456 First floor 3,33 14,08 2,72 90,1 92,28 188,64 0,62 0,452 Entire Building 3,76 14,15 2,68 92,34 94,35 193,71 0,648 0,462
While higher U concentration (5.9 ppm) was observed in Geophysical Engineering building, the lowest one (2.3 ppm) was in Geomatics building. Lower and higher Th values were measured in Dean Building about 8.1 ppm, and 17.2 ppm, respectively. Higher K value (% 2.93) was measured in Geophysical Engineering building and lowest (% 1.54) was in Dean building. These higher concentration values are originated from different building materials such as sea sand and gravel used for building construction in the past. MAVI and AKKURT (2010) determined radionuclide concentrations (226Ra, 232Th and 40K) of some building materials such as brick clay, gravel, cement and gypsum. These researchers found that all samples have higher Potassium activity concentration, and brick clay samples have also highest Potassium activity concentration. Furthermore, sea-sands have more Silicon and mafic mineral contents, and they showed high radioactivity value depending mostly on their acidic properties. DAMLA et al. (2012) carried out chemical analyses on sand, cement, gas concrete, tile and brick samples using energy dispersive X-ray fluorescence (EDXRF) spectrometer. These researchers found that Silicon dioxide (SiO2) content of sand, cement and bricks samples were to be % 64.6, % 34.7 and % 57.88, respectively. Thus, it could be said that the building materials have higher Silicon content show greater radioactivity values.
On the other hand, the soils which surround the foundation of these buildings are volcanic origin. Leakage of radionuclides from the soil via to micro-cracks exist
in buildings increases the measured indoor radiaton level. Furthermore, the concentrations of radionuclides in the air depend on their emanation rate from the soil, meteorological and geographical factors, and on the height above the ground surface. Even though the ventilation rate is higher in summer the higher exhalation rate of radon and thoron (daughter elements of Uranium decay) results in higher contribution to indoor gamma dose rate. The high moisture content in atmosphere, on walls and floor acts as a shield to indoor gamma radiation, which results in lower dose rate in winter (SIVAKUMAR et al. 2002). In this study, measurements were carried out in winter and spring, and lower indoor gamma dose rate was observed in winter, and highest one was in spring.
In UNSCEAR (2000), it is reported that median values of 238U, 232Th, 40K activities of 35 Bq/kg, 30 Bq/kg, and 400 Bq/kg, respectively. The world population-weighted average for the indoor gamma dose rate is 89 nGy/h. The mean values of both radionuclide concentration and dose rate for each building are slightly higher than the values given by UNSCEAR (2000).
The radiological hazard parameters calculated for each building are all well below the acceptable limit. The highest absorbed dose rate in air was observed in Geophysical Engineering department, this may be attributed to the higher concentration of uranium and thorium in building materials, and the lowest in Engineering Faculty’s Dean Building 112.23 and 59.69 nGy/h, respectively. The results