77
A Comparison of Romanian Economy’s Macro Indicators with Other
Countries That Have the Same Credit Score
YILMAZ ONUR ARİ
International Business and Trade Department, Bayburt University
TURKEY
[email protected], ORCID: 0000-0001-7634-2531
Abstract: Credit Rating Agencies have become active promoter of neo-liberal policies since 1980s, and a strong credit rating plays an important role in determining the cost of borrowing. Although the transparency of credit rating agencies is discussed, the credit ratings given by these institutions shed light on the economies of the countries. These credit scores can be affected not only from economic factors, but also social and politic factors of a country. Romania has been given a credit score since 1996. According to 2018 ratings, Romania has been placed in lower medium grade countries category. This paper compares the macroeconomic indicators of countries in the lower medium grade category with Romania. This study also aims to determine whether the credit rating agencies consider the economic factors of a country objectively or act politically when they give a credit score. The results showed that Romania had a good performance at Total Debt/GDP ratio and relatively at interest rate, unemployment rate and real GDP growth rate, while it showed a bad performance at budget balance and inflation rate. According to the results, Romania had not the best or worst macroeconomic indicators in its category so it could be interpreted as credit rating agencies acted objectively by assessing Romania’s macroeconomic indicators and placed a deserved investible category.
Key Words: credit rating, credit rating agencies, Romanian economy, lower medium grade, macroeconomic indicators, political economy
JEL Classification: F40, F50, F53, G23, G24
1. Introduction
Credit rating agencies announce their assessments of a country to the world at the same time in a global economy. In this way, investors measure the degree of risk they will receive. Standard and Poor’s (S&P), Fitch and Moody’s are the major and most well-known credit rating agencies today. It is an indisputable fact that ratings given by these institutions have an impact on capital flows in financial markets.
There are increasing debates about the objectivity of credit rating agencies and the various opinions that credit rating agencies serve many political purposes, such as the lack of transparency of credit ratings. Credit rating agencies’ non-objective assessments may cause economic and financial risks especially in developing countries. Nevertheless, a credit rating exudes enourmous externality because it acts like a globally collective property.
A credit rating helps to determine the borrowing cost of a country, also have an impact on investors who want to borrow money in that country. In this sense, the various macroeconomic indicators take significant weight when credit rating agencies make country credit score decisions. The essential macroeconomic determinants of the sovereign credit ratings provided by the three major rating agencies are GDP per capita, government income, and inflation rate. In general, relatively significant macroeconomic factors, which are cited in rating agency reports as determinants of sovereign ratings, are economic growth, current account debt and savings, real exchange rate, foreign direct investment, fiscal balance, foreign debt and public debt (Aras and Öztürk, 2018). Although there are many macroeconomic indicators used by rating agencies, some of the key indicators were analysed in the study. This paper questions the impact of macroeconomic indicators of Romanian economy on the country credit score decisions of major credit rating agencies. Thus, the study compares the macroeconomic indicators of countries in the lower medium grade category with Romania.
The paper is organized as follows: Section-2 mentions about the historical development of the rating agencies in this paper. Section 3 and 4 explains the importance and the meaning of rating. Section 5 examines the rating history of Romania. Finally, Section 6 compares the macroeconomic indicators of Romania with the macroeconomic indicators of countries in the same category.
78
2 Historical Background of the Rating Agencies
The services provided by credit rating agencies today were provided by specialized commercial and financial press, credit reporting centers and investment bankers affiliated to the 19th century. Specialized commercial press reported on the business conditions of companies and industries. The first of them was the American Railroad Journal, which was founded in 1832, and after Henry Varnum became the editor of Poor Magazine, he published “Poor’s Manual of the Railroads of the United States” in 1849 (Bayar, 2015). The Poor Company entered into the bond-rating sector in 1916. In 1941, Standart Statistics firm, which has been already in the rating sector, merged with the Poor Company, and they created Standart and Poor’s (S&P) company (Fernandez and Vila, 2015).
Accordingly, credit rating activity, which started in the commercial life in 1840s, for the first time in the world, became important in the financial sector at the beginning of the 20th century after 50 years. Louis Lewis Tappan founded the first credit valuation company in the world in 1841 in 1841. With the company founded by John Bradstreet, a lawyer in Cincinnati, Tappan’s company operated separately until the Great Depression in the US and merged into Dun&Bradstreet. In 1909, John Moody presented his first work called “Analysis of Railways Investments” in the United States. He evaluated the management, financial situation and operations of the railways. Moody’s work contributed significantly to the development of the rating concept. In 1914, John Moody (Setty and Dodd, 2003) established “Moody’s Investors Service”.
Fitch Ratings is the third largest rating agency. John Knowles Fitch founded it in 1913 under the name “Fitch Publishing Company”. Two books about Fitch Ratings attracted great interest in the United States and made it known then internationally. In 1924, he created the three-letter rating symbols that we use now. Fitch Ratings created a difference to the rating sector by offering a wide scale from AAA to D to show credit ratings in letters (Günal, 2019).
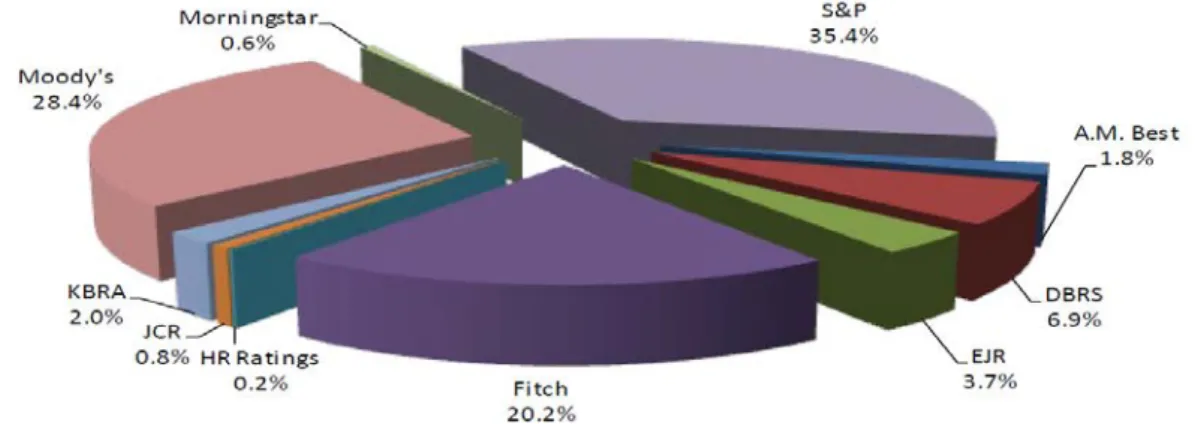
Although there are over 70 rating agencies, only three of them- Standart& Poor’s, Moody’s and Fitch Ratings are followed considerably by governments, banks and investors in order to evaluate the credibility of governments and financial products (Filip, 2019). After all, Moody’s, Standart and Poor’s and Fitch ratings dominated the credit rating sector. (Figure-1).
Figure 1. Market Share of Credit Rating Agencies in 2017
Source: SEC, 2018
3 The Meaning of a Credit Rating
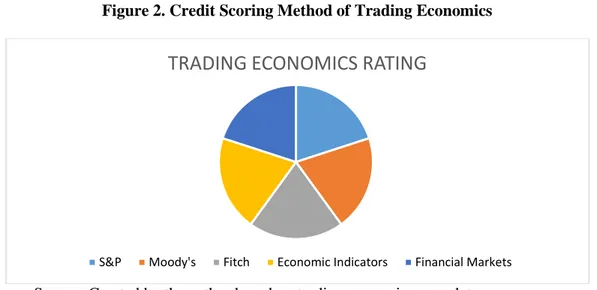
The most well-known and the most effective credit rating agencies such as Moody’s, Standard and Poor’s and Fitch often symbolize their ratings with letter grades from A to D. Except little differences, these symbols are very similiar. The New York-based research institute, Trading Economics, gives ratings between 1 and 100, including Moody’s, Standard and Poor’s and Fitch ratings, as well as countries’ economic indicators and financial market indicators at an equal rate (Coşkun, 2016) (Figure-2).
79
Figure 2. Credit Scoring Method of Trading Economics
Source: Created by the author based on tradingeconomics.com data
Moody’s conducts the government bond assessment process in four main stages. At first stage, economic strength of a country, including GDP per capita, nominal GDP and long-term economic strength, is assessed. At second stage, institutional strength of a country is analyzed, including the assessments on World Bank Government Effectiveness Index, World Bank Rule of Law Index and Transparency. At third stage, government financial strength is tested. There are some assessments about debt affordibility, access to external liquidity and access to resources at this stage. At fourth stage, political risk, economic risk and financial risk of a country are qualitatively assessed under the susceptibility to event risk topic (Moody’s, 2012).
S&P assesses countries’ credit rating by making the use of the political score that reflects the corporate efficiency and political risks, the economic score that reflects the economic structure and growth expenditures, the external score reflecting external that reflects external liquidity and international investment position, the financial score that reflects financial burden, financial performance and flexibility and finally the monetary score that reflects the monetary flexibility (S&P, 2011).
Fitch, on the other hand, determines the credit rating of countries by taking into account the macroeconomic performance, expectations and structural characteristics that make the economy vulnerable to shocks. In addition to this, Fitch analyses public finance, including public debt structure and sustainability and also external financing factors, including external debt level and structure of private and public sectors, international trade balance, funding of current account balance and sustainability of capital flow (Fitch, 2019).
Table 1. The Meaning of Credit Ratings
Source: Created by the author based on tradingeconomics data
TRADING ECONOMICS RATING
80
The symbols used by Fitch, Moody's and S&P in their country's credit ratings are given in Table 1. According to Trading Economic’s credit scoring system, countries that have a point in the range of 55-100 are considered as investible countries. The lowest grades of the investible countries are in the lower medium grade group. Countries with the grade “BBB+, BBB and BBB-” and “Baa1, Baa2 and Baa3” are considered to have sufficient capacity in terms of capital and interest solvency. Although these countries have sufficient solvency, it is highly probable that the solvency may weaken due to negative changes in economic conditions. Lower medium grade countries are more sensitive to economic changes than the upper medium grade countries. The risk of nonredemption of a debt must always be taken into consideration. Countries in the range of 0 and 54 are considered as non-investible countries and they have highly speculative characteristics. They have a weak solvency so they carry a risk for investors.
4 The Effects of Credit Rating on Countries
The increase in the volume of international trade, the development of international relations, the acceleration of international monetary movements, more liberal policies of the countries increased the need for rating. International companies operate in other countries through foreign direct investments. An international firm wants an economically and politically reliable country, when it intends to make an investment. This is also determined by the credit rating of that country. For this reason, international companies prefer to invest in countries with high credit ratings (Coşkun, 2016).
Country credit rating not only determines the borrowing cost of a country, but also affects all investors who want to borrow money in that country. Therefore, a credit rating has a crucial importance for a country’s economy (Cantor and Packer, 1996). Credit worthiness of a country is measured according to short-term, long-term, borrowing with domestic currency and borrowing with foreign exchange criterias. In the long-term assessment, basic structural characteristics about economic, political and social situation of a country are discussed, in line with the national and global possible developments. In the short-term assessment, power of the debtor’s financial balance sheet is tried to be determined in order to confirm the repayability of short-term debts. Countries that get high scores from these assessments have an advantage to borrow more easily with lower interest rates and longer maturities (Elkhoury, 2008).
Despite positive effects of credit ratings, academic and political authorities for credit rating agencies have voiced many criticisms. Particularly after the bankruptcy of Lehman Brothers, the criticism of credit rating agencies-, which claim that derivative products were misrated- growed on the country’s credit ratings due to the increasing problems specific to Eurozone countries (Gür ve Öztürk, 2011). The common point of the criticisms is that the process of issuing country credit ratings is not transparent. Another criticism is that the credit ratings follow the market indicators very far behind and changes in credit rating hava potential to distort the market perception unnecessarily. Credit rating agencies are perceived as systematic triggers of the crisis by the continual increase in the problems of a country after the downgrade of that country –which is having financial or economic problems.- Intensive use of country credit ratings in risk management is also criticised and it is recommended to use different indicators as an alternative to credit ratings (Partnoy, 2001).
Following the credit rating agencies’ assessments, more closely and with great importance, brings along several risks in developing countries. The credit rating agencies’ wrong predictions about developing countries may cause national and global crisis with a higher cost (Kraussl, 2005). This paper examines whether the credit rating agencies consider the economic situation of a country or politic interests, so the study compares the economic ratings of Romania, a developing country, with the countries in the same grade category.
5 Romania’s Credit Rating Development
On March 6, 1996, 3 major credit rating agencies started to give rating credits for Romania. The Balkan country received valuations of its long-term obligations from three major credit rating agencies- Moody’s gave Ba3, S&P and Fitch gave BB-. These ratings lie within the desired “investment grade”, and are somewhat lower than those of Hungary and Poland. The agencies took note of Romania’s low level of indebtness, which according to the country’s National Bank, amounts to 24 % of GDP. Other positive development include a steady three-year economic growth to 6.9 % in 1995, and a drastic decline in the inflation rate from 61.7 % in 1994 to 35 % in 1995 (Zwass, 1999).
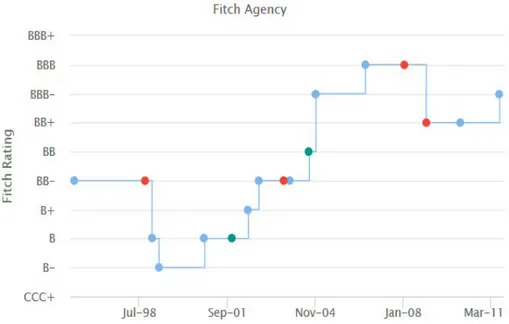
We can see from the three graphs that although there are little differences in the progress of the ratings given by S&P, Fitch and Moody’s in some periods, there is generally a parallelism. Although the credit ratings
81
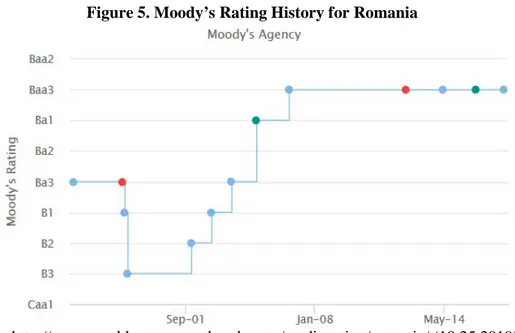
of Romania reached their lowest level in 1998-2001 due to crisis in Russia and Balkan countries, it recovered rapidly in 2002. With Romania’s accession to the EU membership in 2007, the credit ratings reached their highest level and have been generally stable since the beginning of 2010s (Figure-3,4,5).
Figure 3. S&P Rating History for Romania
Source: http://www.worldgovernmentbonds.com/credit-rating/romania/ (10.25.2019)
Figure 4. Fitch Rating History for Romania
82
Figure 5. Moody’s Rating History for Romania
Source: http://www.worldgovernmentbonds.com/credit-rating/romania/ (10.25.2019)
6 A Comparison of Romanian Economy’s Macro Indicators with Other Countries
that Have the Same Credit Score
As it is mentioned before, a New York based research organization called Trading Economics gives credit scores between 1 and 100 points to countries. This scoring system includes not only credit rating agencies’ notes (Moody’s, Standart and Poor’s and Fitch), but also countries’ economic indicators and their financial market indicators. The meaning of the scores given by this organization is explained in the Table-1. According to it’s classification, 21 countries which has the range of 55-69 points, are placed in lower-medium grade category. Romania has 55 points and is considered as a lower-medium grade economy. Countries that are in lower-medium grade category are listed at Table-2.
The data of Romania’s and other lower-medium category countries’ macroeconomic indicators was extracted from the Global Economy website. Because the complete annual data for 2019 could not be obtained, data for 2018 was used in this study. Some key macroeconomic indicators such as export, import, foreign direct investment, trade openness etc. couldn’t be included in the study because some of the countries only had data for 2017 and earlier.
Table-2: Countries in Lower Medium Grade Category
83
0 500 1000 1500 2000 2500 3000GDP (2018 Million $)
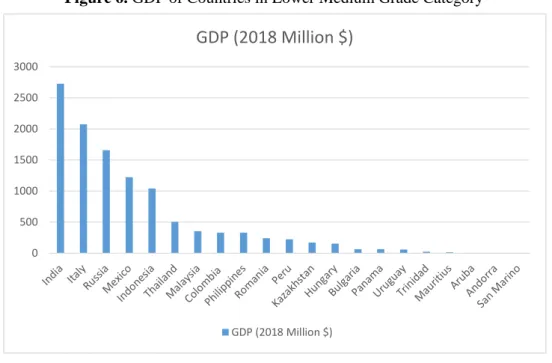
GDP (2018 Million $)If we look at the amount of GDP of countries in lower-medium grade category, we see that Romania ranked at 10th in 2018. 8 of 21 countries had GDP lower than 100 billion dollars. Romania is in the same category with neighbour EU countries Hungary, Bulgaria and charter member Italy. Poland, a developing EU member country like Romania, had a credit score between 70 and 84 so placed in upper medium grade category. Last EU member country Croatia’s credit score was in the range of 40-55 and showed a worse performance than Romania. Germany, Netherlands and Sweden had the best credit scores among EU member countries (Figure-6).
Figure 6. GDP of Countries in Lower Medium Grade Category
When we analyzed the population of the countries in lower medium grade category, the result indicated that Romania was the 11th the most crowded country in the middle of the list. The population of 10 countries is below 20 million. Four of the top five countries (India, Indonesia, Russia and Mexico) are G20 countries (Figure-7).
Figure 7. Population of Countries in Lower Medium Grade Category
0 200 400 600 800 1000 1200 1400 Ind ia In do ne sia Rus sia M ex ic o Phi lippi nes Tha ila nd Italy Col om bi a Pe ru M al ay sia Ro man ia Kaz ak hs tan Hung ar y Bu lg ar ia Pan ama Uru gu ay Ma uri tiu s Tr in id ad Ar uba An do rr a Sa n Ma rin o
Population, 2018, Million People
84
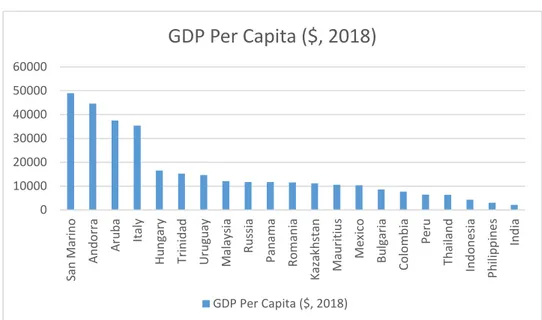
Romania placed in 11th, according to GDP per capita ranking. GDP per capita of Romania was 11534$ in 2018. Micro countries like San Marino, Andorra and Aruba shared the top three position respectively. The countries that are in the range of 95-100 credit score have generally a per capita GDP more than 40000$ (Figure-8).
Figure 8. GDP Per Capita of Countries in Lower Medium Grade Category
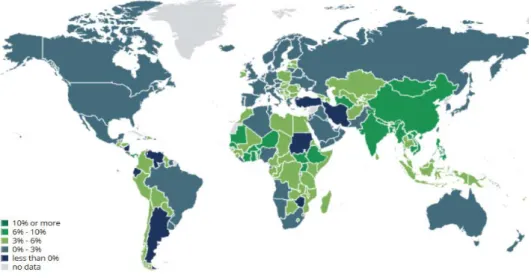
In terms of real GDP growth rate in 2018, Romania ranked 6th with a growth rate of 4,1 % among lower medium grade category countries (Figure-9). Romania’s neighbour country, Hungary, showed a better growth performance than Romania in 2018, but the other neighbour Bulgaria had a lower growth rate. While the real growth rate is low in developed countries with high credit ratings, it is noteworthy that the growth rate in developing countries is high. Eastern European EU countries like Romania, Hungary, Poland, Bulgaria, Latvia and Estonia have a growth rate between 3 % and 6 % (Figure-10).
Figure 9. Real GDP Growth Rate in Lower Medium Grade Category
0 10000 20000 30000 40000 50000 60000 Sa n Ma rin o An do rr a Ar uba Italy Hun ga ry Tr ini da d Uru gu ay M al ay sia Rus sia Pan ama Ro man ia Kaz ak hs tan M au rit iu s M ex ic o Bu lg ar ia Co lo m bi a Pe ru Th ai la nd In do ne sia Phi lipp ine s Ind ia
GDP Per Capita ($, 2018)
GDP Per Capita ($, 2018) 0 1 2 3 4 5 6 7 8Real GDP Growth Rate (%, 2018)
85
Figure 10. Growth Rate in the World
Source:https://www.imf.org/external/datamapper/NGDP_RPCH@WEO/OEMDC/ADVEC/WEOWORLD (05.10.2019)
When we examined the unemployment rate of countries in the lower medium grade category, the result showed that Romania had an unemployment rate about 4,3 % in 2018 and ranked at 13th among 21 countries. In other EU countries, Italy and Bulgaria, the unemployment rate was higher, while Hungary’s unemployment rate was lower than Romania’s (Figure-11).
Figure 11. Unemployment Rate in Lower Medium Grade Category
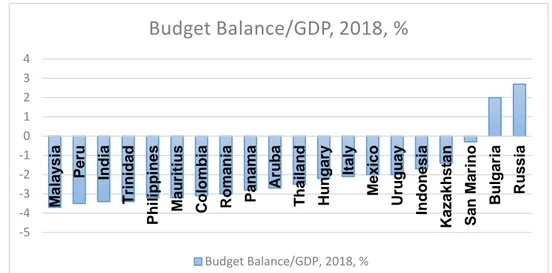
In terms of Budget Balance/GDP ratio, Romania was the 8th country with the worst budget balance (Figure-12). Contrarily, Romania showed a good performance in 2018 in terms of Total Debt/GDP ratio. Romania had a better condition than 15 countries in this category, including Italy and Hungary (Figure-13).
0.00 2.00 4.00 6.00 8.00 10.00 12.00 Ital y Co lo m bi a Sa n Ma rin o Uru gu ay Ar uba M au rit iu s Pan ama India Phi lipp ine s Bu lg ar ia Rus sia Kaz ak hs tan Ro man ia In do ne sia Hun ga ry M al ay sia M ex ic o Pe ru Tr ini da d An do rr a Th ai la nd
Unemployment Rate, 2018, %
Unemployment Rate, 2018, %86
Figure 12. Budget Balance/GDP Ratio of Countries in the Lower Medium Grade Category
Figure 13. Total Debt/GDP Ratio of Countries in the Lower Medium Grade Category
In terms of interest rate, Romania showed a good performance in 2018 and had the 6th lowest interest rate in this category, but had one the highest inflation rate in 2018. Romania’s inflation rate was approximately 5 %. Although this rate is considered as moderate, Romania’s inflation is higher than many developing countries like Hungary, Bulgaria and Russia (Figure-14).
Figure-14: Inflation and Interest Rates in the Lower Medium Grade Category
7 Conclusions
Many academicians, politicians and other members of the public have criticized credit notes given by credit rating agencies. This study aims to determine whether the credit rating agencies consider the economic
-5 -4 -3 -2 -1 0 1 2 3 4 Ma lays ia P e ru In d ia T ri n id a d P h il ip p in e s M a u rit iu s C o lo m b ia R o m a n ia P an am a A ru b a T h a ila n d H u n g a ry It a ly Me xi co U ru g u a y In d o n e s ia K a z a kh st an S an Mar in o B u lg a ria R u ss ia
Budget Balance/GDP, 2018, %
Budget Balance/GDP, 2018, % 0 50 100 150 Ital y Ar uba Hun ga ry Ind ia M au rit iu s Tr ini da d Sa n… M al ay sia Uru gu ay Co lo m bi a M ex ic o Phi lipp in… Th ai la nd Pan ama An do rr a Ro man ia In do ne sia Pe ru Bu lg ar ia Kaz ak hs … Rus siaTotal Debt/GDP, 2018, %
Total Debt/GDP, 2018, % 0 2 4 6 8 10Inflation and Interest Rates (2018, %)
87
situation of a country or politic interests, so the study compared the economic ratings of Romania, a developing country, with the countries in the same grade category.
After a successful development during the mid 90s, Romania got BB- grade from Fitch and S&P, and Ba3 from Moody’s, as the country’s first credit rating assessment. Although the credit ratings of Romania reached their lowest level in 1998-2001 due to crisis in Russia and Balkan countries, it recovered rapidly after 2002. Romania got high credit ratings from three major credit rating agencies after the country’s EU membership in 2007. According to trading economics’ credit score system, Romania has 55 points and is assessed as a lower medium grade economy with the other 20 countries in that category. A lower medium grade country is an investible country which has a credit score in the range of 55 and 69, according to trading economics.
When we investigated the economic statistics of 2018 for Romanian economy, we realized that Romania wasn’t the country that had the best or the worst macroeconomic indicator in the lower medium grade category. Romania has an average GDP, GDP per capita and population in the lower medium grade category. Romania has a GDP per capita about 10000$, but the countries which are in the upper medium grade category have a GDP per capita more than 40000$. Romania showed a good performance at Total Debt/GDP ratio and relatively at interest rate, unemployment rate and real GDP growth rate. Despite the country’s good statistics, Romania showed partially bad performance at budget balance and inflation rate among 21 countries in lower grade category. A high budget deficit may trigger the inflation rate and that may affect the growth rate. According to the results, Romanian government should apply tight monetary policy with budget discipline. This situation may be effective in preventing foreign investment to come to Romania. It can be concluded that credit rating agencies give credit scores by considering macroeconomic indicators of Romania rather than making political decisions. Thus, we can say Romania places a deserved, investible rating category.
References:
[1] Aras, O. N & Öztürk, M. (2018). The Effect of the Macroeconomic Determinants on Sovereign Credit Rating in Turkey,
Journal of Management, Economics, and Industrial Organization, 2(2), pp. 62-75.
[2] Bayar, Y. (2015). Kredi Derecelendirme Kuruluşları ve Yunanistan Borç Krizi, International Journal of Economic and
Administrative Sciences, 8(15), 41-58.
[3] Cantor, R & Packer, F. (1996). Determinants and Impact of Sovereign Credit Ratings, FRBNY Economic Policy Review, October 1996, pp. 37-53.
[4] Coşkun, M. (2016). Türkiye ile Aynı Kredi Notuna Sahip Ülkelerin Makroekonomik Göstergelerinin Karşılaştırılması,
Anadolu University Journal of Social Sciences, November Special Issue, pp. 259-276.
[5] Elkhoury, M. (2008). Credit Rating Agencies and Their Potential Impact on Developing Countries, United Nations
Conference on Trade and Development, Discussion Papers No: 186, pp. 1-33.
[6] Fernandez, J. L. & Vila, R. S. (2015). The Credit Rating Agencies, Institutional Strengths and Methodological Weaknesses: The Banks’ Rating Case, A Thesis in the Master in Economics and Business Administration, Universitat Autonoma de Barcelona.
[7] Filip, P. (2019). The Role of Big Rating Agencies in Intensfying the Economic Crises, Global Economic Observer, 7 (1), pp. 109-117.
[8] Fitch (2019). Procedures and Methodologies for Determining Credit Ratings. 2019 Form. Item:5.
[9] Günal, M. (2019). Kredi Derelendirme Kuruluşlarının Rolü ve Krizlerdeki Etkileri, Ordu Üniversitesi Sosyal Bilimler
Araştırmaları Dergisi, 9(1), 147-155.
[10] Gür, T. H. & Öztürk, H. (2011). Ülke Riski, Derecelendirme Kuruluşları, Aksaklıklar ve Yeni Düzenlemeler,
Sosyo-Ekonomi, Issue Nr:2, pp. 69-92.
[11] Kraussl, R. (2005). Do Credit Rating Agencies Add to the Dynamics of Emerging Market Crisis?, Journal of Financial
Stability, 1, pp. 355-385.
[12] Moody’s (2012). Moody’s Sovereign Rating Methodology, Moody’s Investor Service.
[13] Partnoy, F. (2001). The Paradox of Credit Ratings, Law and Economics Research, Paper Nr: 20, pp. 1-23.
[14] SEC (Securities and Exchange Commision) (2018). Annual Report on Nationally Recognized Statistical Rating
Organizations, pp. 1-30.
[15] Setty, G and Dodd, R. (2003). Credit Rating Agencies: Their Impact on Capital Flows to Developing Countries, Financial
Policy Forum, Special Policy Report 6.
[16] S&P (Standard and Poor’s) (2011). Sovereign Government Rating Methodology and Assumptions, Global Credit Portal, Ratings Direct, pp. 1-43.
[17] Zwass, A. (1999). Incomplete Revolutions: The Successes and Failures of Capitalist Transition Strategies in
Post-Communist Economies. Armonk: New York.
[18] http://www.worldgovernmentbonds.com/credit-rating/romania/ (10.25.2019)
[19] https://www.imf.org/external/datamapper/NGDP_RPCH@WEO/OEMDC/ADVEC/WEOWORLD (05.10.2019) [20] https://tradingeconomics.com/ (05.10. 2019)