Contents lists available atScienceDirect
Bioresource Technology
journal homepage:www.elsevier.com/locate/biortech
Thermal degradations and processes of waste tea and tea leaves via TG-FTIR:
Combustion performances, kinetics, thermodynamics, products and
optimization
Haiming Cai
a, Huihuang Zou
a, Jingyong Liu
a,⁎, Wuming Xie
a, Jiahong Kuo
a, Musa Buyukada
b,
Fatih Evrendilek
b,caGuangzhou Key Laboratory of Environmental Catalysis and Pollution Control, School of Environmental Science and Engineering, Institute of Environmental Health and
Pollution Control, Guangdong University of Technology, Guangzhou 510006, China
bDepartment of Environmental Engineering, Abant Izzet Baysal University, Bolu 14052, Turkey cDepartment of Environmental Engineering, Ardahan University, Ardahan 75002, Turkey
G R A P H I C A L A B S T R A C T
A R T I C L E I N F O
Keywords:
Waste tea and tea leaves Joint optimizations Iso-conversional methods Combustion technology TG–FTIR
A B S T R A C T
The present study characterized the kinetic, thermodynamic and performance parameters, products, factorial interactions, and optimal conditions of combustions of waste tea (WT) and tea leaves (TL) in N2/O2and CO2/O2
atmospheres through a thermogravimetric/Fourier transform infrared spectrometry (TG–FTIR). The main combustion occurred in the range of 200–600 °C. The increased heating rate increased all the combustion parameters regardless of the fuel and atmosphere type. Activation energy was shown different change tendency with the increasing conversion (α). CO2, H2O, CH4, CO, C]O, NH3, and HCN were the main gas products of WT
and TL combustions. A three-way interaction among fuel type, atmosphere type and heating rate was found to be significant. The joint optimization of mass loss, derivative TG, and differential scanning calorimetry was achieved using 1049.3 °C, TL, 40 °C/min, and CO2/O2atmosphere for the operational settings of temperature,
fuel type, heating rate, and atmosphere type, respectively.
1. Introduction
Globally, biofuels and biomass wastes account for about 14% of the
total energy consumption (Chen et al., 2018b). Biomass feedstock re-sources have been explored as the renewable and environmental friendly sources for energy generation, including cornstalk (Wen et al.,
https://doi.org/10.1016/j.biortech.2018.08.068
Received 7 August 2018; Received in revised form 14 August 2018; Accepted 16 August 2018
⁎Corresponding author.
E-mail address:[email protected](J. Liu).
Available online 18 August 2018
0960-8524/ © 2018 Elsevier Ltd. All rights reserved.
2016), rice husk (Ma et al., 2015), para grass (Ahmad et al., 2017a), cattle manure (Yuan et al., 2017), coffee grounds (Bok et al., 2012), red pepper (Maia and Morais, 2016), water hyacinth (Huang et al., 2018b), pomelo peel (Xie et al., 2018a), and sugarcane bagasse (Xie et al., 2018b). Globally, tea is the second most widely consumed drink of the beverage industry. In 2015, China produced 42.8% of the global tea production of 5.3 million tons. The rapidly developed tea industry has now accounted for 20% of the Chinese beverage market (Zhao et al., 2018).
The deep processing by tea factories generates a large amount of unqualified tea leaves (TL), also known as refused tea, about 10% of yield (Pelvan and Özilgen, 2017). As over 90% of tea is left as waste tea (WT) after tea beverage industry (Zhong et al., 2017), the disposal and reuses of WT have been explored through composting (Ahmed et al., 2015), pyrolysis (Tian et al., 2016), and the preparation of biological carbon (Fan et al., 2016; Uzun et al., 2010) and an adsorbent to remove mercury (Shen et al., 2017).
In the face of the pressure on the environment by the vast accu-mulation of highly recalcitrant WT and TL, combustion as the simplest treatment technology has the significant advantages of waste-stream reduction, reuse, and power generation and accounted for over 97% of the global bio-energy production (Chen et al., 2017b). The development and optimization of biomass combustion technologies necessitate the quantification of operational conditions and their re-lative importance. For example, the replacement of N2 by CO2 was
reported to exert some negative effects on the performance indices of biomass combustion such as ignition, burning stability, heat transfer, gas temperature, and burnout (Chen et al., 2015). Combustion in CO2/
O2atmosphere was pointed out to minimize waste heat in the process,
organic pollutants in exhaust gases, and the thermal energy of the ex-haust gases (Huang et al., 2016). Combustion characteristics and per-formances of coal gangue were stated to differ in response to the oxy-fuel (CO2/O2) and air (N2/O2) atmospheres (Meng et al., 2013).
Operation conditions are analyzed using different techniques in order to characterize and optimize the combustion process and per-formance. For example, thermogravimetric analysis (TGA) is an e ffec-tive way to better quantify the combustion, kinetic and thermodynamic parameters, and thus, to understand the thermal degradations and processes of solid biofuels (Zhuo et al., 2017). Various iso-conversional methods such as Friedman, Flynn-Wall-Ozawa (FWO) and distributed activation energy model (DAEM) were developed to estimate solid-state kinetic parameters (Chen et al., 2017a; Fang et al., 2018). TG-Fourier-transform infrared spectroscopy (FTIR) can dynamically track the composition of substances released from the complex thermal decom-position of biofuels with multiple chemical reactions (Lin et al., 2016). However, to the best of our knowledge, there exists no study about the combustion characteristics, products and performances of WT and TL in the N2/O2and CO2/O2atmospheres.
Therefore, the objectives of this study were to: (1) quantify the combustion performances of WT and TL in N2/O2and CO2/O2
atmo-spheres by using combustion parameters; (2) estimate activation energy (E) via three iso-conversional methods; (3) determine thermodynamic changes through four indices; (4) characterize main gaseous products by using TG-FTIR; and (5) detect interaction effects of operational conditions as well as joint optimizations of the multiple responses of mass loss, derivative TG (DTG), and differential scanning calorimetry (DSC) using empirical models.
2. Materials and methods 2.1. Materials preparation
TL was sampled from those planted in the Anhui province, while WT was generated from TL samples soaked in hot water after several times. Waste tea was taken out of soaked TL and dried naturally under good ventilation for 24 h. To further remove their moisture content, the TL
and WT samples were dried in an oven at 105 °C for 24 h. The samples were grounded into 200 mesh before the TG experiments. The Proximate Analysis of Solid Biofuels of China (GB/T 28732-2012) was adopted to carry out the proximate analysis. The ultimate analysis was performed using an elemental analyzer (Vario EL cube by Elementar). The heating values were measured with a WZR-1T-CII microcomputer calorimeter.
2.2. TGA experiment
The TGA experiments were carried out using an NETZSCH STA 409 thermal analyzer with a gasflow rate of 50 mL/min in the following two atmospheres of 79% N2/21% O2and 79% CO2/21% O2. The four
heating rates used in this study were 5, 10, 20 and 40 °C/min. The combustion temperature was increased from room temperature (RT) to about 1100 °C. The control parameters of the temperature rise, the at-mosphere type, and the gasflow rate were set beforehand. The sample was put into an alumina crucible with mass of 6 ± 0.5 mg (weighed by an electronic balance) for the analyzer in each test. The real-time var-iation of the sample mass loss was monitored during the entire com-bustion process. To ensure repeatability, each experiment was con-ducted in triplicates.
2.2.1. TG-FTIR
The combustion products of WT and TL were analyzed using a TGA system (NETZSCH STA 409 PC Luxx, Germany) coupled with an FTIR spectrometer (TENSOR 27 FTIR, Germany). The N2/O2atmosphere was
used as the agent gas at aflowing rate of 50 mL/min. All the samples were kept at the weight of 6 ± 0.5 mg for reducing the heat transfer limitation. The samples were heated from RT to 1100 °C at heating rate of 20 °C/min. Moreover, the volatiles released during the combustion process were detected online using a FTIR spectrometer whose spectra were recorded from 4000 to 600 cm−1. The FTIR analysis was carried out at a resolution of 4 cm−1. The test data were processed using the OMNIC software (Thermo Electron, USA). To eliminate the background signal, blank experiments were carried out before the loading of the samples.
2.3. Combustion characteristics
To evaluate the combustion performances of WT and TL, the eight parameters and/or indices of ignition temperature (Ti), burnout
tem-perature (Tb), maximum weight loss rate (-Rp), peak temperature (Tp),
volatile matter release (Dv), ignition (Ci), burnout (Cb), and
compre-hensive combustibility (S) were used in this study. These parameters can be described as a function of the characteristic temperature and the weight loss rate as follows (Chen et al., 2015):
= − × × D R T T ΔT v p p v 1/2 (1) = − − C R t t i p i p (2) = − × × C R t t t Δ b p p b 1/2 (3) = − × − × S R R T T ( p) ( v) i2 b (4)
where−Rp is maximum weight loss rate, % min−1;−RVis average
weight loss rate, % min−1; TV represents the initial devolatilization
temperature, K; Tiis ignition temperature, K; Tpis peak temperature, K;
ΔT1/2is time interval at the half value of -Rp, K; Tb is burnout
tem-perature, K. ti, tp, tb, and Δt1/2 represent ignition time, peak time,
2.4. Kinetic and thermodynamic analyses
The biomass combustion is a very complex process because its chemical composition is complicate. Many reactions occur simulta-neously within a fraction of second during the thermal decomposition (Maia and Morais, 2016; Chen et al., 2018a). In this study, the integral and differential methods were employed to calculate the kinetic para-meters during the thermal decompositions of WT and TL. The kinetic equations can be expressed using Eq.(5):
=
dα
dt kf α( ) (5)
whereαis sample conversion rate, t is reaction time, T is actual tem-perature (K), k is reaction rate constant, andf(α)is the function of the reaction mechanism.α can be determined using Eq.(6):
= − − α m m m m t f 0 0 (6)
where m0, mt, and mfis the initial, actual and end masses of the samples,
respectively.
According to the Arrhenius equation, k (T) was expressed as follows:
= ⎛ ⎝− ⎞ ⎠ k T Aexp E RT ( ) (7) The TG experiments were performed with the linearly increased heating rates. For the non-isothermal reactions, β= dT/dt combining Eqs.(5) and (7)yielded the following:
= ⎛ ⎝− ⎞ ⎠ dα dt A βexp E RT f α( ) (8)
Based on the E estimates, it is possible to select the best kinetic model to describe the experimental data (Moussout et al., 2016). Per-forming the integration of Eq.(8)under the initial conditions (α= 0, at T = T0), Eq.(9)was obtained:
∫
∫
= − = ⎛⎝− ⎞⎠ α dα α A β E RT dT G( ) 1 exp α T 0 0 (9)The TGA method was used to determine the kinetic parameters of A, E, and f (α) or G (α). The methods applying Eq.(8)are referred to as the differential methods while those using Eq.(9)are known as the integral methods (Yuan et al., 2017). In this study, activation energy (E) was estimated using the three iso-conversional methods of Friedman, FWO, and DAEM.
2.4.1. Friedman method
Thefirst and more general iso-conversional method is the Friedman method. By applying the natural logarithm on both sides of Eq.(9), the following was obtained:
⎛ ⎝ ⎞ ⎠= − + lnβ dα dT E RT ln Af α( ( )) (10)
In this method, the conversion function f α( )remains constant, thus indicating that the biomass decomposition depends only on mass loss rate being independent on temperature.
2.4.2. FWO method
In the FWO method, Eq.(9)was integrated using the Doyle’s ap-proximation for the temperature integral. The resultant equation was given below (Tran et al., 2014):
⎜ ⎟ = ⎛ ⎝ ⎞ ⎠ − − ⎛ ⎝ ⎞ ⎠ β AE RG α E RT ln ln ( ) 5.3305 1.052 (11) Sinceln
(
AE)
RG α( ) does not relate toβ, E was estimated as the slope of (1.052 E/R) of the least square regression line plotted for lnβ as y-axis versus 1/T as x-axis.
2.4.3. DAEM
The DAEM method is a common approach to simulate complex re-actions such as co-combustion of fossil fuels and biomass (Huang et al., 2018a). Eq.(9)was rewritten thus:
⎛ ⎝ ⎞ ⎠= ⎛ ⎝ ⎞ ⎠+ − β T AR E E RT ln 2 ln 0.6075 (12) From Eq.(12), the plot ofln
( )
βT2 versus 1/T gives a linear equation
with E/R as its slope.ln
( )
ARE provides an intercept value when 0.6075 is kept constant for simplicity.
The four thermodynamic parameters of A,ΔH, ΔG, and ΔS were also estimated using the following equations (Maia and Morais, 2016):
= A [βEexp E RT( / m)]/(RT2) (13) = − H E RT Δ (14) = + G E RT ln K T hA Δ m ( B m/ ) (15) = − S H G T Δ (Δ Δ )/ m (16)
where KBis the Boltzmann constant (1.381 × 10⁻³⁴J/K); h is the Plank
constant (6.626 × 10⁻³⁴J S); and Tmis peak temperature (K).
2.5. Statistical analyses
Correlation matrix was performed to detect linear relationships among the measured variables. Three-way multivariate of analysis (MANOVA) were used to detect significant interaction effects among the atmosphere type (the two levels), the heating rate (the four levels), and the fuel type (the two levels) on the three mean responses of re-maining sample mass (RM, %), DTG (%/min), and DSC (mW/mg). Tukey’s multiple comparison tests following general linear models (GLM) were further used to capture significant mean differences. The joint optimization of the responses as well as sensitivity analyses of the operational conditions were based on the best-fit multiple non-linear regression models. The best-fit models were chosen using a stepwise procedure at p value of 0.001 as a function of temperature (temp), fuel type (FT), atmosphere type (ATM), heating rate (HR), and their inter-action and polynomial terms. Atmosphere type, FT, and HR were used in the model as the categorical variables. The goodness-of-fit and the predictive power of the models were evaluated using adjusted (R2
adj)
and predictive (R2
pred) coefficients of determination, respectively. The
joint optimal settings of the operational variables for the responses were determined maximizing the composite desirability (D) with a range of zero to one (the ideal case), the weighted geometric mean of the individual desirabilities (d). All the statistical analyses were im-plemented using Minitab 17.1.
3. Results and discussion
3.1. Proximate, ultimate and calorific value analyses
The proximate analysis (Table 1) showed that both moisture and volatile matter contents were higher in WT than TL, and the volatile matter content in the WT and TL was 82.31% and 74.80%, respectively. The ash andfixed carbon contents were higher in TL than WT. Their main elements were C, H and O, with the lower N and S contents. The calorific values of WT and TL (20.86 and 19.69 MJ/kg, respectively) were higher than those of common crop parts such as corn stalk (17.56 MJ/kg), and wheat-straw (17.45 MJ/kg) (Wen et al., 2016). These results point to the promising potential of the WT and TL com-bustions for energy generation.
3.2. Thermogravimetric analysis
rates of 5, 10, 20, and 40 °C/min in both atmospheres. The increased heating rate caused the TG curves and DTG peak to move to a higher temperature region, not changing the patterns of the thermal decom-positions of TL and WT. This appeared to be related to the thermal hysteresis effect since the higher heating rate induced lowered heat transfer efficiency, as was generally reported in the TGA results (Zhou et al., 2017).
The combustion characteristics of WT and TL in the N2/O2and CO2/
O2atmospheres at a heating rate of 20 °C/min are presentedFig. 1(e, f)
andTable 2. The combustions in the two atmospheres were divided into three stages. As for the WT combustion, thefirst stage was the water loss. Its main weight losses by 54.69% and 49.52% occurred at the second stage in the ranges of 207.3–397.5 °C and 202.5–401.2 °C, re-spectively. These weight losses were attributed to the thermal de-gradation of volatiles such as hemi-celluloses, celluloses and partial lignin (Chen et al., 2017a). The maximum weight loss rates were esti-mated at 17.02%/min at 328.6 °C and 16.76%/min at 326.3 °C in the N2/O2and CO2/O2atmospheres, respectively, in the second stage. In
stage III, the weight loss was associated with the decomposition offixed carbon, lignin and other organic matters. Similarly, this stage was re-ported to involve the combustion offixed carbon and residual volatiles with stronger chemical bonds such as aromatic compounds (Huang et al., 2018a). At above 637 °C, the weight loss was caused by the slow thermal decomposition of minerals.
The combustion process of TL exhibited a lower amount of weight loss than did that of WT although its weight loss in the second stage was similarly attributed to the decomposition of its hemicellulose and lignin. This was related to the higher cellulose content of WT than TL. The cellulose and crude protein contents of WT were found to increase when WT was obtained from soaked TL (Wang et al., 2016). The third stage of TL had an additional larger peak on the DTG curve of weight loss. This peak may be caused by the rapid decompositions of large amounts offixed carbon and the volatiles produced by the second de-composition of tar, as was also reported for the dede-composition of tea polyphenols (Yao et al., 2017).
The replacement of N2by CO2had similar effects on the WT and TL
combustions. As shown in Fig. 1(e, f), the atmosphere type had no significant effect on the (D)TG curves at below 450 °C. At above 500 °C, the peak weight loss rate was higher in the N2/O2than CO2/O2
atmo-sphere, and the replacement of N2by CO2postponed the locations of
the peaks. CO2has higher density and heat capacity than N2, thus
ab-sorbing more heat from the combustion furnace. Therefore, in the process of heating, more heat was removed by the carrier gas of CO2
which resulted in lower surface temperatures of WT and TL (Wall et al., 2009). As shown inTable 2, the samples underwent a more thorough combustion in the N2/O2 than CO2/O2 atmosphere given the lower
residues of WT and TL in the N2/O2atmosphere. This case agreed well
with mass loss rates obtained by (Tang et al., 2013). Replacing N2by
CO2at the same concentration was reported to lowerflame propagation
speed, flame stability, and gas temperature, thus increasing the un-burned carbon content in the CO2atmosphere (Chen et al., 2015). Our
finding of the lower residues supported the reduction aimed for the WT and TL volumes.
3.3. Combustion characteristics
To better understand effects of the heating rate on the combustion performances of WT and TL in both atmospheres, the eight combustion characteristic parameters are presented inTable 3. With the increased heating rate, all the eight combustion parameters increased in both atmospheres regardless of the fuel type. Pearson’s correlation matrix was performed for each atmosphere and each fuel type (n = 4). For both atmospheres as well as both fuel types, the heating rate had a significantly positive correlation with −Rp(p≤ 0.004), Ci(p≤ 0.04),
and S (p≤ 0.02), but no significantly positive correlation with Ti, Tp,
and Cb (p > 0.05). The increases in Tb in both atmospheres as a
function of the increased heating rate were significant only for TL (p≤ 0.01). Only the Dvvalue of WT in the CO2/O2atmosphere was not
significantly correlated with the heating rate. The increased heating rate postponed the decomposition process. The better comprehensive combustion performances with the increased heating rate were sup-ported byZhou et al. (2017). As for the impact of the atmosphere type on the WT and TL combustion characteristics (Table 3), Tukey’s mul-tiple comparison tests showed significant mean differences only in Ti
and Tb(n = 16; p < 0.001). In both atmospheres, the mean Tivalues of
WT were significantly higher than those of TL. The mean Tbvalue of
WT in the CO2atmosphere was higher than those of TL in both
atmo-spheres.
3.4. Kinetic estimates
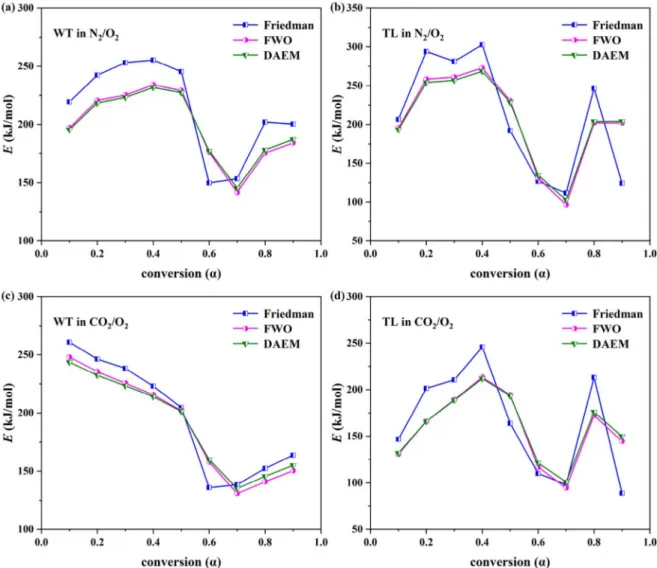
The model-free methods without the assumption of mechanism functions involved have gained popularity in estimating more reliable E (Tian et al., 2016). The E values of the WT and TL combustions were estimated using the three iso-conversional methods of Friedman, FWO, and DAEM in both atmospheres as a function of the conversion rate (α). The apparent E values, and their associated R2values are shown in Table 4 andFig. 2. The E values were negatively correlated with α values (r =−0.51; n = 108; p < 0.001). The mean highest E value (240.6 ± 29 kJ/mol) atα = 0.4 (which was similar at α = 0.2, 0.3, and 0.5) was significantly different from the mean lowest E value (120.6 ± 22 kJ/mol) at α = 0.7 (which was similar at α = 0.6) (n = 108; p < 0.001). A significant variation in E with the conversion rate was found to point to a kinetically complex process ( López-González et al., 2017). The impacts of the atmosphere types on the WT and TL combustions were also reflected in their E values. The change from N2/O2to CO2/O2atmosphere was found to significantly decrease
the E values from 204.9 ± 49 to 176.2 ± 45 kJ/mol (r =−0.29; n = 108; p = 0.002). A similar finding was also reported about the combustion of swine manure (López-González et al., 2017). The lower E values also indicate an easily converted biofuel that can be also used in co-firing with other biofuel types with either lower or higher E values. In terms of the kinetic models and the fuel types, the mean E values did not differ significantly (n = 108; p > 0.05). The mean R2values
were estimated at 95.5, 97.8 and 97.6 for the Friedman, FWO, and DAEM methods, respectively, thus confirming the admissible accuracy of the results. According to Tukey’s multiple comparison test, the mean R2values of the FWO and DAEM methods were higher than that of the
Friedman method (n = 108; p = 0.017). For the FWO method, the Table 1
Proximate, ultimate and calorific value analyses of WT and TL.
Samples Ultimate analysis (wt. %) Proximate analysis (wt. %) Qnet(MJ/kg)
Cad Had Oad Nad Sad Mad Vad Aad FCad
WT 47.99 6.60 28.73 4.90 0.18 5.45 82.31 6.15 6.09 20.86 TL 47.32 5.88 30.33 4.16 0.12 4.37 74.80 7.82 12.91 19.69
ad, air-dry basis; Oad, calculated by Oad(%) = 100%-Cad-Had-Nad-Sad- Mad- Aad(Chen et al., 2016); Mad, moisture content; Vad, volatile matter content; Aad, ash
dependence of the apparent E onα can be separated into the two dis-tinct regions. Thefirst region had the stable E values in the α range of 0.1 to 0.5. The second region had a slight E variation for WT, but a substantial increase for TL in theα range of 0.6 to 0.9. The two regions
corresponded to our earlier discussions about the DTG plots. Thefirst stage belonged to the release of volatiles during which hemi-celluloses, celluloses and some portion of lignin were decomposed. The second stage was the decomposition of other oxides or inorganic substances. Fig. 1. (D)TG curves at four heating rates: (a) WT and (b) TL combustions in N2/O2atmosphere; (c) WT and (d) TL combustions in CO2/O2atmosphere; and (D)TG
Our result was consistent with thefinding about Turkish lignite (Selcuk and Yuzbasi, 2011).
3.5. Thermodynamic parameters
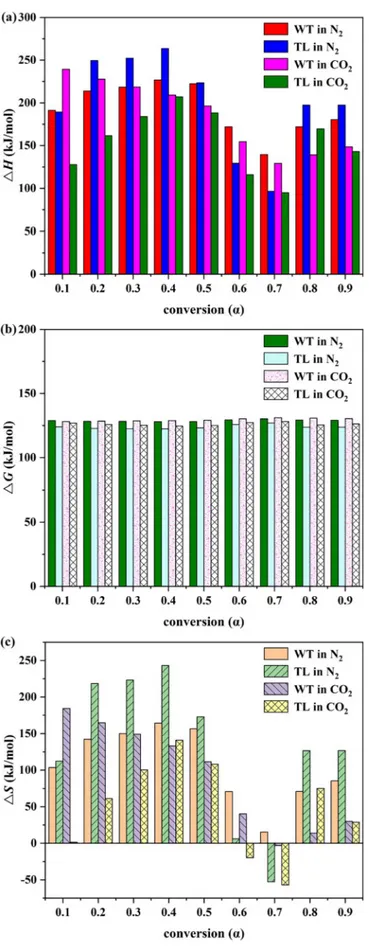
To estimate the thermodynamic parameters of the combustion
processes plays an important role in the large-scale design of combus-tion reactors as well as in the seleccombus-tion of suitable biofuels. The A,ΔH, ΔG and ΔS estimates by the FWO method in both atmospheres at 20 °C/ min are shown inTable 5andFig. 3. The mean A values did not sig-nificantly differ in terms of the atmosphere and fuel types, and the conversion rate (n = 36; p > 0.05). The A estimates of TL and WT were Table 2
Three decomposition stages of WT and TL, and their associated temperature ranges, weight losses and residues at 20 °C/min.
Atmosphere Sample I II III Residue (%)
Temperature range (oC) Weight loss (%) Temperature range (oC) Weight loss (%) Temperature range (oC) Weight loss (%)
N2/O2 WT 41.0–207.3 6.56 207.3–397.5 54.69 397.5–633.7 33.11 4.21
TL 40.3–167.2 4.44 167.2–372.0 48.86 372.0–577.5 39.74 5.98 CO2/O2 WT 42.5–202.5 6.06 202.5–401.2 54.28 401.2–637.6 32.55 5.97
TL 42.2–169.8 4.64 169.8–377.2 49.52 377.2–593.3 38.65 6.89
Table 3
Combustion characteristic parameters of WT and TL as a function of heating rate in N2/O2and CO2/O2atmospheres.
Atmosphere Sample β Ti -Rp Tp Tb Ci Dv Cb S N2/O2 WT 5 277.8 3.94 308.7 550.1 0.14 1.14 0.06 0.41 10 280.1 7.66 318.2 573.2 1.02 1.90 0.84 1.57 20 289.8 17.29 328.0 595.0 8.31 4.95 18.87 6.61 40 294.2 34.44 329.6 605.4 57.45 8.45 263.84 26.06 TL 5 236.1 2.28 283.8 511.2 0.10 0.39 0.02 0.36 10 249.3 4.45 302.2 514.6 0.71 0.63 0.25 1.26 20 255.2 10.46 307.4 533.2 6.05 1.89 5.72 5.73 40 257.1 20.06 309.6 566.2 39.47 3.11 76.29 21.25 CO2/O2 WT 5 266.2 3.80 308.3 571.0 0.14 1.08 0.06 0.42 10 279.9 7.94 318.8 599.5 1.06 2.32 0.92 1.54 20 285.5 16.26 329.5 610.1 7.88 4.52 16.40 6.28 40 287 28.00 334.4 632.6 47.42 5.34 159.52 21.09 TL 5 231.1 2.24 289.5 521.1 0.10 0.33 0.02 0.36 10 241.9 4.54 300.2 539.1 0.75 0.64 0.26 1.33 20 251.8 10.00 311.7 544.3 5.80 1.52 4.39 5.37 40 253.0 21.02 319.3 585.7 40.93 3.23 81.70 21.81
β is heating rate, °C/min; Tiis ignition temperature, °C;−Rpis maximum weight loss rate, %/min; Tbis burnout temperature, °C; Tpis peak temperature, °C; Cbis
burnout index, 10−3⋅(%⋅min−4); S is comprehensive combustibility index, 10−7⋅(%2·°C−3·min−2); D
vis volatile matter release index, 10−6·(%·min−1·°C−3); and Ciis
ignition index, 10−2·(%·min−3).
Table 4
Activation energies (E, kJ/mol) of WT and TL combustions as a function of conversion rate according to Friedman, FWO, and DAEM in N2/O2and CO2/O2
atmosphere.
Atmosphere α WT TL
Friedman FWO DAEM Friedman FWO DAEM
E R2 E R2 E R2 E R2 E R2 E R2 N2/O2 0.10 219.46 0.950 195.57 0.914 196.95 0.906 206.47 0.972 193.32 0.952 195.18 0.948 0.20 242.34 0.998 218.48 0.990 220.46 0.989 294.06 0.933 253.92 0.946 258.26 0.942 0.30 253.03 0.976 223.26 0.997 225.14 0.996 281.32 0.922 256.88 0.936 260.84 0.932 0.40 255.28 0.971 231.81 0.978 233.91 0.976 302.70 0.949 268.44 0.946 272.65 0.942 0.50 245.45 0.966 227.43 0.989 229.04 0.988 192.02 0.979 228.60 0.986 230.30 0.984 0.60 149.78 0.991 177.30 0.992 175.81 0.991 126.79 0.999 134.90 0.997 130.93 0.997 0.70 153.44 0.995 145.46 1.000 141.31 1.000 111.80 0.845 102.65 0.998 96.01 0.997 0.80 202.09 0.965 178.28 0.987 175.08 0.985 246.78 0.862 203.71 0.997 201.56 0.996 0.90 200.37 0.999 187.25 0.997 183.85 0.996 124.24 0.926 203.92 0.990 201.58 0.988 Average 213.47 0.979 198.32 0.983 197.95 0.981 209.58 0.932 205.15 0.972 205.26 0.970 CO2/O2 0.10 260.76 0.924 243.66 0.907 247.62 0.901 146.78 0.995 131.92 0.996 130.62 0.995 0.20 246.32 0.966 232.40 0.969 235.15 0.966 201.38 0.997 166.03 0.997 165.81 0.997 0.30 238.34 0.983 223.39 0.983 225.30 0.982 210.57 0.999 188.61 0.999 189.04 0.999 0.40 223.01 0.958 214.05 0.993 215.20 0.992 245.78 0.999 211.94 0.999 213.19 0.999 0.50 204.61 0.893 201.43 0.952 201.64 0.947 163.86 0.970 193.37 0.985 194.04 0.984 0.60 135.92 0.994 159.92 0.966 157.43 0.961 110.06 0.981 121.37 0.987 116.67 0.985 0.70 138.43 0.996 135.16 0.994 130.39 0.993 98.21 0.946 100.92 0.986 94.17 0.982 0.80 152.35 0.996 145.50 0.995 140.44 0.993 213.27 0.793 175.96 0.981 172.17 0.978 0.90 163.72 0.991 155.14 0.993 149.87 0.992 88.8 0.824 149.71 0.956 144.19 0.947 Average 195.94 0.967 190.07 0.972 189.23 0.970 164.30 0.945 159.98 0.987 157.77 0.985
Fig. 2. Changes in activation energy (E) of (a) WT and (b) TL combustions in N2/O2atmosphere; (c) WT and (d) TL combustions in CO2/O2atmosphere as a function
of conversion rate based on Friedman, FWO and DAEM methods.
Table 5
Thermodynamic parameters of WT and TL combustions as a function of conversion rate at 20 °C/min in N2/O2and CO2/O2atmospheres according to FWO.
Atmosphere α WT TL
A (S−1) ΔH (kJ/mol) ΔG (kJ/mol) ΔS (J/mol) A (S−1) ΔH (kJ/mol) ΔG (kJ/mol) ΔS (J/mol) N2/O2 0.1 1.30 × 10¹⁷ 191.24 128.92 103.70 3.46 × 10¹⁷ 189.20 124.05 112.25 0.2 1.42 × 10¹⁹ 213.82 128.36 142.20 1.29 × 10²³ 249.48 122.73 218.38 0.3 3.77 × 10¹⁹ 218.40 128.26 149.99 2.41 × 10²³ 252.18 122.68 223.12 0.4 2.17 × 10²⁰ 226.82 128.07 164.31 2.77 × 1024 263.56 122.47 243.10 0.5 8.85 × 10¹⁹ 222.32 128.16 156.67 6.13 × 10²⁰ 223.56 123.24 172.84 0.6 3.04 × 10¹⁵ 171.94 129.41 70.76 1.33 × 10¹² 129.37 125.79 6.17 0.7 4.26 × 10¹² 139.55 130.40 15.23 1.27 × 10⁹ 96.59 127.10 −52.57 0.8 3.71 × 10¹⁵ 171.97 129.38 70.86 3.14 × 10¹⁸ 197.30 123.80 126.63 0.9 2.35 × 10¹⁶ 180.41 129.14 85.32 3.28 × 10¹⁸ 197.39 123.79 126.81 Average – 192.94 128.90 106.56 – 199.85 123.96 130.75 CO2/O2 0.1 2.16 × 10²¹ 239.30 128.18 184.44 5.66 × 10¹¹ 127.82 126.93 1.51 0.2 2.17 × 10²⁰ 227.72 128.41 164.83 7.94 × 10¹⁴ 161.60 125.82 61.20 0.3 3.45 × 10¹⁹ 218.53 128.61 149.24 9.41 × 10¹⁶ 183.92 125.20 100.44 0.4 5.12 × 10¹⁸ 209.07 128.83 133.19 1.28 × 10¹⁹ 207.06 124.63 140.98 0.5 3.88 × 10¹⁷ 196.35 129.13 111.57 2.56 × 10¹⁷ 188.29 125.08 108.11 0.6 7.76 × 10¹³ 154.55 130.29 40.27 5.94 × 10¹⁰ 115.86 127.34 −19.63 0.7 4.68 × 10¹¹ 129.22 131.13 −3.17 7.37 × 10⁸ 94.91 128.24 −56.99 0.8 3.97 × 10¹² 139.15 130.76 13.93 6.49 × 10¹⁵ 169.51 125.53 75.20 0.9 2.90 × 10¹³ 148.44 130.44 29.88 2.50 × 10¹³ 143.11 126.32 28.72 Average – 184.70 129.53 91.58 – 154.68 126.12 48.84
close to those of para grass (2.55 × 10⁸to 2.26 × 10¹⁹s−1), and cattle manure (5.47 × 10⁹to 1.33 × 1030s−1) (Ahmad et al., 2017a; Yuan et al., 2017). The lower A values (< 109s−1) indicate a surface
reac-tion. If the reactions are independent on the surface area, the lower A values may also indicate a closed complex. However, the higher A va-lues (> 109s−1) show a simple complex (Turmanova1 et al., 2008).
The wide range of the A values of WT and TL pointed to their complex structure with multiple stages of chemical reactions during their com-bustion.
TheΔH values illustrate the energy difference between the reagent and the activated complex (Huang et al., 2018b). TheΔH values were negatively correlated with the α values (r = −0.49; n = 36; p = 0.002). The mean highest H value atα = 0.4 (226.6 ± 26 kJ/mol) (similar atα = 0.1 to 0.5, 0.8 and 0.9) was significantly different from the mean lowestΔH value at α = 0.7 (115.1 ± 22 kJ/mol) (similar at α = 0.6) (n = 36; p < 0.001). A low potential energy barrier (5–7 kJ/ mol) was found whenΔH was compared with the E values of WT and TL which reflected the feasibility of reactions (Gan et al., 2018). The low difference between the E and ΔH values was stated to easily achieve the product formation (Ahmad et al., 2017b).
TheΔG values indicated the total energy increase of the reaction mechanism in terms of the reagents, and the formation of the activated complex. A higherΔG value represents a lower reaction favorability (Huang et al., 2016). Unlike the other thermodynamic parameters, only the change from WT to TL was found to significantly decrease the ΔG value from 129.2 ± 0.9 to 125.0 ± 1.7 kJ/mol (r =−0.83; n = 36; p < 0.001). TheΔS value as a measure of disorder indicates the dis-order degree of products produced via bond dissociation when positive and is higher for the products than the initial reactants (He et al., 2018). As shown inFig. 3c, the dominancy of the positiveΔS values of the WT and TL combustions pointed to their enhanced disorder degrees. Similar results were pointed out for para grass (−122.23 to 94.38 J/mol) (Ahmad et al., 2017a), red pepper (−249.52 to −8.31 J/mol) (Maia and Morais, 2016), and cattle manure (−71.23 to 316.19 J/mol) (Yuan et al., 2017). TheΔS values were also negatively correlated with the α values (r =−0.48; n = 36; p = 0.002). As with ΔH, the mean highest ΔS value at α = 0.4 (170.4 ± 50 J/mol) (similar at α = 0.1 to 0.5, 0.8 and 0.9) was significantly different from the mean lowest ΔS value at α = 0.7 (−24.4 ± 35 J/mol) (similar at α = 0.6) (n = 36; p < 0.001). Thermodynamic parameters play an important role in combustion reactor design for the large-scale combustion process and in selection of suitable biomass species.
3.6. TG-FTIR results
FTIR is often used to distinguish the various (in)organic compounds after the thermal degradation. The produced gases can be confirmed by matching characteristic peaks of a spectrogram to functional groups (Zhang et al., 2018). The peak intensity of a specific wavenumber re-presented the release intensity of the combustion products (Granada et al., 2012). The variation of the spectral intensity was similar to that of the DTG curves over time. As other biofuels did, WT and TL con-tained natural macromolecular polymers such as hemi-celluloses, cel-luloses and lignin. With the focus on the maximum weight loss rate of the main stage, the gas products of WT and TL were identified in the combustions process. The main volatile components identified were small molecular gases and included H2O, CH4, CO2, CO, aromatic, CeO,
NH3, HCN, and light tar components (C]O) such as aldehydes, ketones,
and acids. The absorbance peaks at 3456, 2927, 2326 (673), 2179, 1374, 1170, 966 and 714 cm−1corresponded to the releases of H2O,
CH4, CO2, CO, aromatic, CeO, NH3, and HCN, respectively. The
ab-sorbance peak at 1786 cm−1 was attributed to the releases of alde-hydes, ketones, and acids (C]O) (Ma et al., 2015; Tang et al., 2017; Xie et al., 2018a).
The main combustion products of WT and TL appeared in the ranges of 200 to 600 °C and 205 to 560 °C, respectively. The releases of CH4,
Fig. 3. Thermodynamic parameters of WT and TL combustions at 20 °C/min in N2/O2and CO2/O2atmospheres as a function of conversion rate according to
C]O, aromatics, CeO, and NH3mainly occurred in the range of 200 to
400 °C, with maximum release temperatures at 328.6 °C for WT and 307.2 °C for TL. Other products such as H2O, CO2, CO and HCN were
released during the main combustion process. The release intensity of H2O form WT was higher than TL at the main reaction stage. H2O
re-leased mainly from the evolution of bulk water, bound water, and crystallization water in the mineral substance. With the increased temperature, H2O also stemmed from the cracking or reaction of
oxygen functional groups (Liang et al., 2018). The evolutions of CH4,
CO2, and CO were mainly attributed to the cleavage of functional
groups such as methoxyl group, and ether group (R-O-R, carboxyl and carbonyl group (C]O)) as well as to the secondary cracking of phenolic compounds (Zhao et al., 2014). The release intensity of CH4was
rela-tively low in the entire combustions. The release intensity of CO was similar to that of H2O, but was lower in the TL than WT combustion.
The releases of C]O, aromatic, and CeO such as carbonyls, acids, phenol, ether, and alcohol occurred mainly in the range of 200 to 400 °C. At the lower temperatures, C]O was usually produced by the fracture of the O-acetyl side chain of the hemi-cellulose structure (Tian et al., 2016). The fragmentation of methoxy was the main source of the methanol formation in the lignin combustion process, with eCH2OH
group on the alkyl side chain as another source of alcohol (Wang et al., 2009). Their intensity was higher for WT than TL which was attributed to the increased organic matter content of WT after the process of soaking. The intensities of aromatic were similar to those of C-O for WT and TL. NH3were also detected although its intensity was not obvious.
The HCN releases from WT and TL were mainly in the ranges of 200 to 595 °C and 205 to 560 °C, respectively. Its higher intensity from TL in the range of 470–560 °C may be caused by the rapid decomposition of large amounts offixed carbon, and the volatiles of the second decom-position.
3.7. Interaction effects of operational parameters
An interaction effect exists when response(s) at a factor level de-pend(s) on the levels of the other factors. The three alternative tests of the three-way MANOVA pointed consistently to a three-way interaction effect of atmosphere type, fuel type, and heating rate on the responses of mass loss, DTG, and DSC (Wilk’s lambda = 0.908, F = 1863; Lawley-Hotelling trace = 0.100, F = 1917; Pillai’s trace = 0.091, F = 1796; df = 9; n = 171010; p < 0.001). All the significantly different pairwise comparisons were further displayed inTable 6. The interaction plots in
Fig. 4based on the best-fit models also show significant two-way in-teractions (p = 0.001). Out of all the combinations, only the tempera-ture by atmosphere type and fuel type by atmosphere type interactions were not significant for mass loss, while only the latter was not sig-nificant for DSC (Fig. 4). On DTG, only the interaction effect of tem-perature and heating rate was found to be significant (Fig. 4). Table 6
Tukey’s multiple comparisons of mean responses of remaining mass (RM, %), DSC (mW/mg), and DTG (%/min) as a function of three-way interactions be-tween atmosphere type (ATM), fuel type (FT), and heating rate (HR) (n = 171010).
ATM FT HR n Mean RM Mean DSC Mean DTG CO2/O2 TL 5 10,692 31.6 g −1.50 cd −0.45 a CO2/O2 TL 10 10,695 32.3 fg −2.54 e −0.92 b CO2/O2 TL 20 10,689 35.6 abc −6.13 i −1.85 c CO2/O2 TL 40 10,687 36.9 a −5.03 h −3.89 d CO2/O2 WT 5 10,692 32.5 efg −1.31 bcd −0.45 a CO2/O2 WT 10 10,695 34.0 cdef −0.72 a −0.91 b CO2/O2 WT 20 10,694 35.7 ab −4.77 h −1.85 c CO2/O2 WT 40 10,686 36.0 a −11.05 k −3.94 d N2/O2 TL 5 10,688 32.4 efg −1.19 bc −0.45 a N2/O2 TL 10 10,688 34.1 bcde −1.57 d −0.90 b N2/O2 TL 20 10,678 35.2 abc −2.61 ef −1.90 c N2/O2 TL 40 10,688 35.7 abc −8.99 j −3.96 d N2/O2 WT 5 10,688 33.3 defg −1.10 b −0.44 a N2/O2 WT 10 10,688 33.1 defg −3.68 g −0.92 b N2/O2 WT 20 10,673 34.3 bcd −2.87 f −1.91 c N2/O2 WT 40 10,689 36.4 a −4.81 h −3.96 d Means in the columns that do not share the same letter are significantly dif-ferent at p < 0.001.
Fig. 4. Plots of two-way interaction effects of fuel type (FT), atmosphere type (ATM), heating rate (HR, K/min), and temperature (Temp, °C) on the responses based on the best-fit models (p = 0.001).
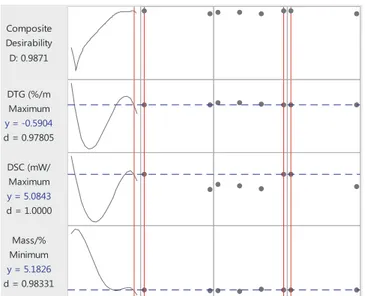
3.8. Joint optimization and sensitivity analysis of multiple responses The best-fit multiple non-linear regression models (please see sup-plementary information) accounted for 98.8, 64.3 and 56.9% of var-iations in the remaining sample mass (%) (SE = 3.9), DSC (mW/mg) (SE = 4.2), and DTG (%/min) (SE = 2.3), respectively (n = 171010; p = 0.001). Based on the joint optimization of the best-fit models of the three responses, the optimal operational settings were estimated at 1049.3 °C for temperature, TL for the fuel type, CO2/O2for the
atmo-sphere type, and 40 °C/min for the heating rate (D = 0.987) (Fig. 5). The optimal settings for the second best optimization were determined as 823.3 °C, WT, CO2/O2, and 10 °C/min (D = 0.982). The optimal
factor settings were predicted under the assumption that each opera-tional factor carried the same weight of importance.
Given the joint optimization achieved under the above conditions, the sensitivity analysis of the three categorical variables was carried out using the ceteris paribus approach. The composite desirability of the joint optimization was found to be most and least sensitive to the changes in the heating rate and the atmosphere type, respectively. The lowest D values showed a slight variation with 0.943, 0945 and 0.949 in response to the changing factor levels of heating rate, fuel type, and atmosphere type, respectively, relative to that of the joint optimization (0.987).
4. Conclusions
The main combustions occurred at 200–600 °C. The average acti-vation energies of both WT and TL combustions were higher in the N2/
O2than CO2/O2atmosphere. H2O, CH4, CO, CO2, NH3and HCN were
identified as the main gaseous evolutions from the combustions. Significant three-way and two-way interactions among the fuel and atmosphere types, the heating rate, and temperature were found si-multaneously on the three responses. The best and second best joint optimizations were achieved in the CO2/O2atmosphere with the
fol-lowing factor settings of 1049.3 and 823.3 °C, TL and WT, 40 and 10 °C/ min, respectively.
Acknowledgments
This research was financially supported by the Scientific and Technological Planning Project of Guangzhou, China (Nos.
201704030109 & 2016201604030058), and the Science and Technology Planning Project of Guangdong Province, China (Nos. 2017A050501036, 2017A040403063 & 2017A040403059), and Guangdong Special Support Program for Training High Level Talents (No.2014TQ01Z248).
References
Ahmad, M.S., Mehmood, M.A., Al Ayed, O.S., Ye, G., Luo, H., Ibrahim, M., Rashid, U., Arbi Nehdi, I., Qadir, G., 2017a. Kinetic analyses and pyrolytic behavior of Para grass (Urochloa mutica) for its bioenergy potential. Bioresour. Technol. 224, 708–713.
Ahmad, M.S., Mehmood, M.A., Taqvi, S.T.H., Elkamel, A., Liu, C.-G., Xu, J., Rahimuddin, S.A., Gull, M., 2017b. Pyrolysis, kinetics analysis, thermodynamics parameters and reaction mechanism of Typha latifolia to evaluate its bioenergy potential. Bioresour. Technol. 245, 491–501.
Ahmed, S.T., Lee, J.W., Mun, H.S., Yang, C.J., 2015. Effects of supplementation with green tea by-products on growth performance, meat quality, blood metabolites and immune cell proliferation in goats. J. Anim. Physiol. Anim. Nutr. 99 (6), 1127–1137.
Bok, J.P., Choi, H.S., Choi, Y.S., Park, H.C., Kim, S.J., 2012. Fast pyrolysis of coffee grounds: characteristics of product yields and biocrude oil quality. Energy 47, 17–24.
Chen, J., Liu, J., He, Y., Huang, L., Sun, S., Sun, J., Chang, K., Kuo, J., Huang, S., Ning, X., 2017a. Investigation of co-combustion characteristics of sewage sludge and coffee grounds mixtures using thermogravimetric analysis coupled to artificial neural net-works modeling. Bioresour. Technol. 225, 234–245.
Chen, X., Liu, L., Zhang, L., Zhao, Y., Zhang, Z., Xie, X., Qiu, P., Chen, G., Pei, J., 2018b. Thermogravimetric analysis and kinetics of the co-pyrolysis of coal blends with corn stalks. Thermochim. Acta 659, 59–65.
Chen, J., Mu, L., Cai, J., Yao, P., Song, X., Yin, H., Li, A., 2015. Pyrolysis and oxy-fuel combustion characteristics and kinetics of petrochemical wastewater sludge using thermogravimetric analysis. Bioresour. Technol. 198, 115–123.
Chen, N., Ren, J., Ye, Z., Xu, Q., Liu, J., Sun, S., 2016. Kinetics of coffee industrial residue pyrolysis using distributed activation energy model and components separation of bio-oil by sequencing temperature-raising pyrolysis. Bioresour. Technol. 221, 534–540.
Chen, J., Wang, Y., Lang, X., Ren, X., Fan, S., 2017b. Comparative evaluation of thermal oxidative decomposition for oil-plant residues via thermogravimetric analysis: thermal conversion characteristics, kinetics, and thermodynamics. Bioresour. Technol. 243, 37–46.
Chen, J., Xie, C., Liu, J., He, Y., Xie, W., Zhang, X., Chang, K., Kuo, J., Sun, J., Zheng, L., Sun, S., Buyukada, M., Evrendilek, F., 2018a. Co-combustion of sewage sludge and coffee grounds under increased O2/CO2atmospheres: thermodynamic characteristics,
kinetics and artificial neural network modeling. Bioresour. Technol. 250, 230–238.
Fan, S., Tang, J., Wang, Y., Li, H., Zhang, H., Tang, J., Wang, Z., Li, X., 2016. Biochar prepared from co-pyrolysis of municipal sewage sludge and tea waste for the ad-sorption of methylene blue from aqueous solutions: kinetics, isotherm, thermo-dynamic and mechanism. J. Mol. Liq. 220, 432–441.
Fang, S., Yu, Z., Ma, X., Lin, Y., Chen, L., Liao, Y., 2018. Analysis of catalytic pyrolysis of municipal solid waste and paper sludge using TG-FTIR, Py-GC/MS and DAEM (dis-tributed activation energy model). Energy 143, 517–532.
Gan, D.K.W., Loy, A.C.M., Chin, B.L.F., Yusup, S., Unrean, P., Rianawati, E., Acda, M.N., 2018. Kinetics and thermodynamic analysis in one-pot pyrolysis of rice hull using renewable calcium oxide based catalysts. Bioresour. Technol. 265, 180–190.
Granada, E., Eguía, P., Vilan, J.A., Comesaña, J.A., Comesaña, R., 2012. FTIR quantitative analysis technique for gases. Application in a biomass thermochemical process. Renewable Energy 41, 416–421.
He, Y., Chang, C., Li, P., Han, X., Li, H., Fang, S., Chen, J., Ma, X., 2018. Thermal de-composition and kinetics of coal and fermented cornstalk using thermogravimetric analysis. Bioresour. Technol. 259, 294–303.
Huang, L., Liu, J., He, Y., Sun, S., Chen, J., Sun, J., Chang, K., Kuo, J., Ning, X., 2016. Thermodynamics and kinetics parameters of co-combustion between sewage sludge and water hyacinth in CO2/O2atmosphere as biomass to solid biofuel. Bioresour.
Technol. 218, 631–642.
Huang, J., Liu, J., Chen, J., Xie, W., Kuo, J., Lu, X., Chang, K., Wen, S., Sun, G., Cai, H., Buyukada, M., Evrendilek, F., 2018a. Combustion behaviors of spent mushroom substrate using TG-MS and TG-FTIR: thermal conversion, kinetic, thermodynamic and emission analyses. Bioresour. Technol. 266, 389–397.
Huang, L., Xie, C., Liu, J., Zhang, X., Chang, K., Kuo, J., Sun, J., Xie, W., Zheng, L., Sun, S., Buyukada, M., Evrendilek, F., 2018b. Influence of catalysts on co-combustion of sewage sludge and water hyacinth blends as determined by TG-MS analysis. Bioresour. Technol. 247, 217–225.
Liang, F., Wang, R., Hongzhong, X., Yang, X., Zhang, T., Hu, W., Mi, B., Liu, Z., 2018. Investigating pyrolysis characteristics of moso bamboo through TG-FTIR and Py-GC/ MS. Bioresour. Technol. 256, 53–60.
Lin, Y., Liao, Y., Yu, Z., Fang, S., Lin, Y., Fan, Y., Peng, X., Ma, X., 2016. Co-pyrolysis kinetics of sewage sludge and oil shale thermal decomposition using TGA–FTIR analysis. Energy Convers. Manage. 118, 345–352.
López-González, D., Parascanu, M.M., Fernandez-Lopez, M., Puig-Gamero, M., Soreanu, G., Avalos-Ramírez, A., Valverde, J.L., Sanchez-Silva, L., 2017. Effect of different concentrations of O2under inert and CO2atmospheres on the swine manure
com-bustion process. Fuel 195, 23–32.
Ma, Z., Zhi, W., Ye, J.W., Zhang, Q., 2015. Determination of pyrolysis characteristics and kinetics of rice husk using TGA-FTIR and model-free integral methods. Shengwu Huaxue Gongcheng 49 (3), 27–32.
Fig. 5. The vertical red and horizontal blue lines represent the optimal factor settings (levels), and their response (y) values, respectively. (For interpretation of the references to colour in thisfigure legend, the reader is referred to the web version of this article.)
Maia, Amanda Alves Domingos, Morais, L.C.D., 2016. Kinetic parameters of red pepper waste as biomass to solid biofuel. Bioresour. Technol. 204, 157–163.
Meng, F., Yu, J., Tahmasebi, A., Han, Y., 2013. Pyrolysis and combustion behavior of coal gangue in O2/CO2and O2/N2mixtures using thermogravimetric analysis and a drop
tube furnace. Energy Fuels 27 (6), 2923–2932.
Moussout, H., Ahlafi, H., Aazza, M., Bourakhouadar, M., 2016. Kinetics and mechanism of the thermal degradation of biopolymers chitin and chitosan using thermogravimetric analysis. Polym. Degrad. Stabil. 130, 1–9.
Pelvan, E., Özilgen, M., 2017. Assessment of energy and exergy efficiencies and renew-ability of black tea, instant tea and ice tea production and waste valorization pro-cesses. Sustain. Product. Consump. 12, 59–77.
Selcuk, N., Yuzbasi, N.S., 2011. Combustion behaviour of Turkish lignite in O2/N2and
O2/CO2mixtures by using TGA–FTIR. J. Anal. Appl. Pyrolysis 90, 133–139.
Shen, B., Tian, L., Li, F., Zhang, X., Xu, H., Singh, S., 2017. Elemental mercury removal by the modified bio-char from waste tea. Fuel 187, 189–196.
Tang, Y., Ma, X., Lai, Z., Zhou, D., Chen, Y., 2013. Thermogravimetric characteristics and combustion emissions of rubbers and polyvinyl chloride in N2/O2and CO2/O2
at-mospheres. Fuel 104, 508–514.
Tang, Y., Ma, X., Wang, Z., Wu, Z., Yu, Q., 2017. A study of the thermal degradation of six typical municipal waste components in CO2and N2atmospheres using TGA-FTIR.
Thermochim. Acta 657, 12–19.
Tian, L., Shen, B., Xu, H., Li, F., Wang, Y., Singh, S., 2016. Thermal behavior of waste tea pyrolysis by TG-FTIR analysis. Energy 103, 533–542.
Tran, K.-Q., Bach, Q.-V., Trinh, T.T., Seisenbaeva, G., 2014. Non-isothermal pyrolysis of torrefied stump – a comparative kinetic evaluation. Appl. Energy 136, 759–766.
urmanova1, S.Ch., Genieva, S.D., Dimitrova, A.S., Vlaev, L.T., 2008. Non-isothermal degradation kinetics offilled with rise huskash polypropene composites. Express. Polym. Lett. 2, 133–146.
Uzun, B.B., Apaydin-Varol, E., Ateş, F., Özbay, N., Pütün, A.E., 2010. Synthetic fuel production from tea waste: characterisation of bio-oil and bio-char. Fuel 89, 176–184.
Wall, T., Liu, Y., Spero, C., Elliott, L., Khare, S., Rathnam, R., Zeenathal, F., Moghtaderi, B., Buhre, B., Sheng, C., Gupta, R., Yamada, T., Makino, K., Yu, J., 2009. An overview on oxyfuel coal combustion—state of the art research and technology development. Chem. Eng. Res. Des. 87, 1003–1016.
Wang, H., Chen, X., Ding, L., Qiu, F., Zhang, Q., Cai, Z., Kong, X., 2016. Contents of main components and metal ions in tea raw materials and tea waste from different kinds of
instant tea. Zhongguo Nongxue Tongbao 36 (29), 53–57.
Wang, S., Wang, K., Liu, Q., Gu, Y., Luo, Z., Cen, K., Fransson, T., 2009. Comparison of the pyrolysis behavior of lignins from different tree species. Biotechnol. Adv. 27, 562–567.
Wen, L., Tao, Q., OU, Y., Gao, F., Yang, Z., Chen, J., Xu, Y., 2016. Comparison of calorific value of agro-forestry biomass and optimal formula of tobacco stem-cornstalk bri-quette (in Chinse). Hunan Nongye Kexue, 1, 43–46.
Xie, C., Liu, J., Xie, W., Kuo, J., Lu, X., Zhang, X., He, Y., Sun, J., Chang, K., Xie, W., Liu, C., Sun, S., Buyukada, M., Evrendilek, F., 2018a. Quantifying thermal decomposition regimes of textile dyeing sludge, pomelo peel, and their blends. Renewable Energy 122, 55–64.
Xie, W., Wen, S., Liu, J., Xie, W., Kuo, J., Lu, X., Sun, S., Chang, K., Buyukada, M., Evrendilek, F., 2018b. Comparative thermogravimetric analyses of co-combustion of textile dyeing sludge and sugarcane bagasse in carbon dioxide/oxygen and nitrogen/ oxygen atmospheres: thermal conversion characteristics, kinetics, and thermo-dynamics. Bioresour. Technol. 255, 88–95.
Yao, F., Tao, J., Wang, H., Hu, G., Chen, S., Hussian, T.M., 2017. Study of pyrolysis behavior and reaction mechanism of tea polyphenols. Linchan Huaxue yu Gongye 37 (5), 19–27.
Yuan, X., He, T., Cao, H., Yuan, Q., 2017. Cattle manure pyrolysis process: Kinetic and thermodynamic analysis with isoconversional methods. Renewable Energy 107, 489–496.
Zhang, Z., Wang, C., Huang, G., Liu, H., Yang, S., Zhang, A., 2018. Thermal degradation behaviors and reaction mechanism of carbonfibre-epoxy composite from hydrogen tank by TG-FTIR. J. Hazard. Mater. 357, 73–80.
Zhao, T., Chen, Z., Lin, X., Ren, Z., Li, B., Zhang, Y., 2018. Preparation and character-ization of microcrystalline cellulose (MCC) from tea waste. Carbohydr. Polym. 184, 164–170.
Zhao, J., Xiuwen, W., Hu, J., Liu, Q., Shen, D., Xiao, R., 2014. Thermal degradation of softwood lignin and hardwood lignin by TG-FTIR and Py-GC/MS. Polym. Degrad. Stabil. 108, 133–138.
Zhuo, Z., Liu, J., Sun, S., Sun, J., Kuo, J., Chang, K., Fu, J., Wang, Y., 2017. Thermogravimetric characteristics of textile dyeing sludge, coal and their blend in N2/O2and CO2/O2atmospheres. Appl. Therm. Eng. 111, 87–94.
Zhong, L., Tang, X., Shao, Z., Wang, X.X., 2017. Production and application of tea residue biomass granule fuel. Yinliao Gongye 20 (1), 50–53.