TARIM BİLİMLERİ DERGİSİ 2009, 15(2) 142-147 ANKARA ÜNİVERSİTESİ ZİRAAT FAKÜLTESİ
Genetic Relationships Among Medicago sativa L. Clones
Commonly Grown in Central Anatolia
Selma GÜLBİTTİ-ONARICI1
Hayrettin KENDİR2 Cengiz SANCAK2 Cafer S. SEVİMAY2 Hayrettin EKİZ2 Sebahattin ÖZCAN2
Geliş Tarihi: 04.12.2008 Kabul Tarihi: 06.07.2009
Abstract: Amplified fragment length polymorphism (AFLP) markers were used to investigate genotypic variability among 34 alfalfa clones (M. sativa) using 15 primer combinations with restriction enzymes EcoRI, PstI and MseI. 34 unique AFLP fragments were observed. The 15 primer pairs produced a total of 1002 fragments of which 460 were polymorphic. The number of polymorphic fragments detected per primer combination ranged 7 to 67. Furthermore, 22 clone-specific markers were also detected in the 13 clones. Data analysis was performed with NTSYSpc version 2.1 software. Genetic distance values ranged 5.9374 to 1.1453. Fifteen clones which showed the highest genetic variation were selected for producing synthetic variety of Alfalfa. Key Words: Medicago sativa, amplified fragment length polymorphism, synthetic variety improvement
Orta Anadoluda Yaygın Olarak Ekilen Medicago sativa L. Klonları
Arasında Genetik İlişkiler
Öz: Çoğaltılmış parçacık uzunluğu polimorfizmi (AFLP) markörleri, EcoRI, PstI ve MseI restriksiyon enzimleriyle birlikte 15 primer kombinasyonu kullanılarak, 34 adet yonca (M. sativa) klonu arasındaki genotipik varyasyonu araştırmak için kullanılmıştır. 34 adet klona özgü AFLP bandı gözlenmiştir. 15 primer çifti 460‟ı polimorfik olan toplam 1002 bant üretmiştir. Her primer kombinasyonu için tespit edilen polimorfik bantların sayısı 7 ile 67 arasında değişmiştir. Bunlara ilaveten 13 adet klonda da 22 adet klona özgü markör tespit edilmiştir. Veri analizi NTSYSpc version 2.1yazılımı ilegerçekleştirilmiştir. Genetik uzaklık değerleri 5.9374 ile 1.1453 arasında sıralanmıştır. En yüksek genetik çeşitlilik gösteren onbeş klon, yoncanın sentetik varyetelerini üretmek amacıyla seçilmiştir.
Anahtar Kelimeler: Medicago sativa, çoğaltılmış parçacık uzunluğu polimorfizmi, sentetik varyete ıslahı
Introduction
Alfalfa (Medicago sativa L.) is one of the most important high feeding value leguminous forage crops in the world (Sumberg et al. 1983; Rumbaugh et al. 1988). It is an autotetraploid (2n = 4x = 32) outcrossing and seed-propagated species (Labombarda et al. 2000).
Alfalfa is distributed worldwide and grows in highly contrasting environments. This extensive geographical adaptation promotes genetic variation and give breeders possibility of using highly diverse genotypes in breeding programs (Maureira et al. 2004). Synthetic variety breeding is most effective and intensive method to improve perennial forage crops like alfalfa through polycross. Classical breeding studies require long time to select individual clones for synthetic variety production (Moreno-Gonzales and Cubero 1994).
Knowledge about genetic variability in species is important for optimal use of genetic resources in plant breeding programs. The use of molecular markers especially AFLP (Amplified fragment length polymorphism) markers help to select genetic dissimilarity potential parents for production of synthetics (Kidwell et al. 1994a). Some studies in alfalfa have detected positive associations between DNA marker diversity and hybrid yield (Kidwell et al. 1994a, Kidwell et al. 1994b, Osborn et al. 1998, Segovia-Lerma et al. 2003). AFLP is frequently used for the identification of molecular markers because of certain advantages over other techniques, such as high level of identified polymorphism, high reproducibility, and relative technical simplicity (Vos et al. 1995).
The aim of the study was to genetically evaluate alfalfa plants, collected from different regions of Turkey _______________________________________________________
1
The Scientific and Technical Council of Turkey, Research Institute for Genetic Engineering and Biotechnology, P.O. Box 21, 41470 Gebze-Kocaeli
and select them on the basis o genotypes using AFLP molecular markers techniques for synthetic variety production.
Material and Methods
Plant material: Thirty four individual plants were
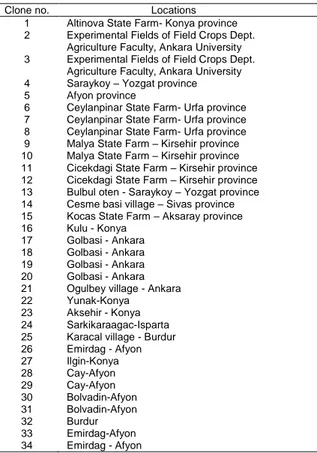
collected from different parts of Central Anatolia to breed a new synthetic alfalfa variety compatible with climatic conditions of Central Anatolia (Table 1). Initially, the plants were phenotypically evaluated in terms of important agronomic characteristics. Thereafter, they were multiplied using shoot tip cuttings using perlite and vermiculite (3:1) as rooting medium.
DNA extraction and AFLP analysis: DNA was
isolated from leaf tissue of two weeks old seedling as described by Doyle and Doyle (1987).
AFLP analysis was done following Vos et al. (1995) with minor modifications. Thirty four alfalfa clones were analyzed with seventeen primer combinations. Two primer pairs (P55 + CGA/ M55+ Table 1. The locations of the clones used in AFLP analysis.
Clone no. Locations
1 Altinova State Farm- Konya province
2 Experimental Fields of Field Crops Dept.
Agriculture Faculty, Ankara University
3 Experimental Fields of Field Crops Dept.
Agriculture Faculty, Ankara University
4 Saraykoy – Yozgat province
5 Afyon province
6 Ceylanpinar State Farm- Urfa province
7 Ceylanpinar State Farm- Urfa province
8 Ceylanpinar State Farm- Urfa province
9 Malya State Farm – Kirsehir province
10 Malya State Farm – Kirsehir province
11 Cicekdagi State Farm – Kirsehir province
12 Cicekdagi State Farm – Kirsehir province
13 Bulbul oten - Saraykoy – Yozgat province
14 Cesme basi village – Sivas province
15 Kocas State Farm – Aksaray province
16 Kulu - Konya
17 Golbasi - Ankara
18 Golbasi - Ankara
19 Golbasi - Ankara
20 Golbasi - Ankara
21 Ogulbey village - Ankara
22 Yunak-Konya
23 Aksehir - Konya
24 Sarkikaraagac-Isparta
25 Karacal village - Burdur
26 Emirdag - Afyon 27 Ilgin-Konya 28 Cay-Afyon 29 Cay-Afyon 30 Bolvadin-Afyon 31 Bolvadin-Afyon 32 Burdur 33 Emirdag-Afyon 34 Emirdag - Afyon
CGA and P55 + CGA/ M60+ CTC) were not included in the final analysis because the amplification profile was consistently too faint to score accurately. The Fifteen informative primer pairs used in the final analysis are listed in Table 2. Four PstI/MseI and eleven EcoRI/MseI primer combinations were tested using identical procedures. Total genomic DNA was restricted with the restriction enzymes PstI or EcoRI and MseI (Promega) along with double-stranded adaptors (Promega, Table 2) ligated at 37 °C.
Amplification of the generated fragments was performed in two consecutive amplification cycles with primers containing one, or three selective nucleotide extensions (Table 2). First, preamplification was performed using two primers P00/M00 or E00+C/ M00 with following PCR conditions: 60 s at 94 ºC; 30 s at 60 ºC; 60 sat 72 ºC; this was followed by 7 minat 72 ºC extension, for 26 cycles. Selective amplification was conducted using three PstI, five EcoRI and nine MseI primers. Each primer contained three selective nucleotide extensions at the 3′ end (Table 2). PstI/EcoRI primer was labeled by phosphorylating the 5‟ end with [ 33
P]ATP.
The selective amplification was performed for 36 cycles with the following cycle profile: a 30s DNA denaturation step at 94 ºC, a 30s annealing step at 65 ºC and a 1 min extension step at 72 ºC. The annealing temperature of 65 ºC in the first cycle was subsequently reduced in each cycle by 0.7 ºC for next 12 cycles, and was continued at 56 ºC for remaining 23 cycles. All amplification reactions were performed in a Biometra T-Gradient thermocycler.
Table 2. Sequences of adapters, preamplification and selective amplification primers employed.
Adapters/Primers Sequences (5‟-3‟)
PstI-adapter 5‟-CTC GTA GAC TGC GTA CAT GCA-3'
3‟-CAT CTG ACG CAT GT -5'
EcoR I- adapter 5'- CTCGTAGACTGCGTACC -3'
3'- AATTGGTACGCAGTC -5'
MseI- adapter 5‟-GAC GAT GAG TCC TGA G-3'
3‟-TAC TCA GGA CTC AT -5 P00 (universal primer) 5‟-GAC TGC GTA CAT GCA G -3' E00+C (universal primer) 5‟-GACTGCGTACCAATTC-3' M00 (universal primer) 5‟-GAT GAG TCC TGA GTA A -3' P55 + CGA P56 + CGC P57 + CGG M49+ CAG M50+ CAT M51+ CCA M52+ CCC M53+ CCG M56+ CGC M60+ CTC M61+ CTG M62+ CTT E17+ CCG E25+ CTG E26+ CTT E38+ ACT E36+ ACC
GAC TGC GTA CAT GCA G + CGA GAC TGC GTA CAT GCA G + CGC GAC TGC GTA CAT GCA G + CGG GAT GAG TCC TGA GTA A + CAG GAT GAG TCC TGA GTA A + CAT GAT GAG TCC TGA GTA A + CCA GAT GAG TCC TGA GTA A + CCC GAT GAG TCC TGA GTA A + CCG GAT GAG TCC TGA GTA A + CGC GAT GAG TCC TGA GTA A + CTC GAT GAG TCC TGA GTA A + CTG GAT GAG TCC TGA GTA A + CTT GACTGCGTACCAATT + CCG GACTGCGTACCAATT + CTG GACTGCGTACCAATT + CTT GACTGCGTACCAATTC + ACT GACTGCGTACCAATTC + ACC
* E indicates EcoRI adapter sequences; P indicates PstI adapter sequences ; M indicates MseRI adapter sequences.
144 TARIM BİLİMLERİ DERGİSİ 2009, Cilt 15, Sayı 2
Page analysis: Following amplification, reaction
products were mixed with an equal volume of formamide dye (98% [v/v] formamide, 100 mM EDTA, pH: 8.0, 0.025 % [v /v] bromo phenol blue and 0.025 % [v/v] xylene cyanol) which served as a tracking dye. The resulting mixture was heated for 3 min at 94ºC, and then quickly cooled on ice. Each sample was loaded on ice. After electrophoresis for 2 h at 80 watts (constant power), the gel was dried and exposed to X-ray film for 1-4 days depending on the signal intensity.
Data analysis: All genotypes were scored for
presence or absence of polymorphic AFLP fragments and the data were entered into a binary matrix as discrete variables (“1” for presence and “0” for absence of a homologous fragment). Only distinct, reproducible, well-resolved fragments were scored. Data were analyzed with NTSYSpc version 2.1 (Numerical Taxonomy and Multivariate Analysis System, Version 2.1) (Rohlf 2000).
Results and Discussion
A large range of variation was obtained using different AFLP primer combinations. Fifteen AFLP primer pairs revealed 460 polymorphic bands among 1002 scorable bands (45.90 % polymorphism). The minimum number of polymorphic bands were produced by E26+M62 and P57+M50 (7 bands), whereas the maximum number of polymorphic bands were produced by E17+M61 and E25+M53 (67 bands) (Table 3).
The best primer combinations detected in this research, considering their ability to produce polymorphic bands are E25+M53 (%73.62), E17+M61 (%69.79), E38+M62 (%58.33), E36+M62 (%56.62), P55+M49 (%54.09), E17+M52 (%50.82), P56+M62 (%50), E25+M49 (%45.05), E38+M56 (%43.9), E36+M56 (%37.5) (Table 3). Defining the primer combinations showing high number of polymorphic bands will be advantageous for the future studies in this species to speed up the analysis and minimize expenses.
There was a marked difference between EcoRI/MseI primers and PstI/MseI primers in the number of the visible bands observed. EcoRI/MseI primers produced a slightly larger number of fragment compared to PstI/MseI primers. No significant differences were recorded in percentage of polymorphic bands produced by both of EcoRI/MseI (21.86-54.09%) and PstI/MseI primers ((16-73.62%) Each clone presented a unique AFLP pattern. There were clone-specific markers (present in one clone but absent in the others). Twenty two (22) clone specific bands for 13 clones were detected (Table 4). This
Table 3. AFLP primer combinations generating polymorphic products after Pst I/Mse I and EcoR I/Mse I enzyme digestion, and distribution of AFLP markers.
Primer combinations Polymorphic bands (no) Visible band (no) Polymorphism (%) E17+M61 67 96 69.79 E17+M52 31 61 50.82 E17+M49 13 50 26 E38+M62 56 96 58.33 E38+M56 18 41 43.9 E26+M50 12 75 16 E26+M62 7 67 10.44 E25+M53 67 91 73.62 E25+M49 41 91 45.05 E36+M62 47 83 56.62 E36+M56 18 48 37.5 P56+M51 17 58 29.31 P56+M62 26 52 50 P55+M49 33 61 54.09 P57+M50 7 32 21.86 Total 460 1002 45.90
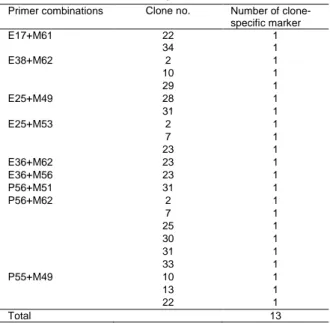
Table 4. Distribution of the clone-specific markers obtained from AFLP reactions according to primer combinations.
Primer combinations Clone no. Number of
clone-specific marker E17+M61 22 1 34 1 E38+M62 2 1 10 1 29 1 E25+M49 28 1 31 1 E25+M53 2 1 7 1 23 1 E36+M62 23 1 E36+M56 23 1 P56+M51 31 1 P56+M62 2 1 7 1 25 1 30 1 31 1 33 1 P55+M49 10 1 13 1 22 1 Total 13
revealed that for identification of a given clone, specific amplification profiles obtained with single primer/clone combination can be used. Distribution of the clone-specific markers according to primer combinations is shown in Table 4.
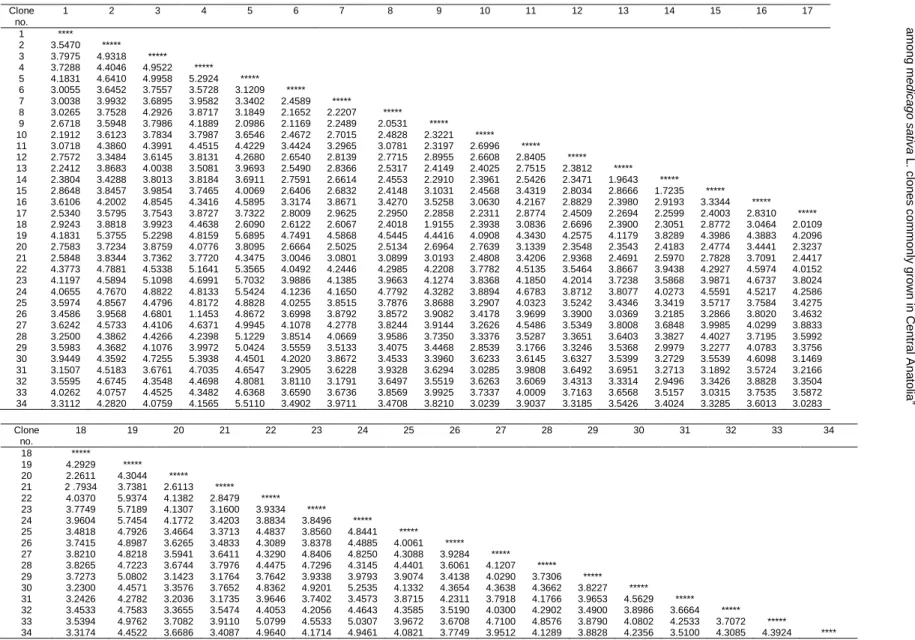
Genetic similarity and diversity analysis among thirty four alfalfa clones was performed using the data analysis software, NTSYSpc version 2.1 software (Numerical Taxonomy and Multivariate Analysis System) (Rohlf, 2000). The genetic distance matrix was obtained using „Nei72‟algorithm (Table 5). A dendrogram was constructed using the unweighted pair group method average (UPGMA) clustering (Figure 1).
Table 5. Genetic distance matrix based on Nei 72. Clone no. 1 2 3 4 5 6 7 8 9 10 11 12 13 14 15 16 17 1 **** 2 3.5470 ***** 3 3.7975 4.9318 ***** 4 3.7288 4.4046 4.9522 ***** 5 4.1831 4.6410 4.9958 5.2924 ***** 6 3.0055 3.6452 3.7557 3.5728 3.1209 ***** 7 3.0038 3.9932 3.6895 3.9582 3.3402 2.4589 ***** 8 3.0265 3.7528 4.2926 3.8717 3.1849 2.1652 2.2207 ***** 9 2.6718 3.5948 3.7986 4.1889 2.0986 2.1169 2.2489 2.0531 ***** 10 2.1912 3.6123 3.7834 3.7987 3.6546 2.4672 2.7015 2.4828 2.3221 ***** 11 3.0718 4.3860 4.3991 4.4515 4.4229 3.4424 3.2965 3.0781 2.3197 2.6996 ***** 12 2.7572 3.3484 3.6145 3.8131 4.2680 2.6540 2.8139 2.7715 2.8955 2.6608 2.8405 ***** 13 2.2412 3.8683 4.0038 3.5081 3.9693 2.5490 2.8366 2.5317 2.4149 2.4025 2.7515 2.3812 ***** 14 2.3804 3.4288 3.8013 3.8184 3.6911 2.7591 2.6614 2.4553 2.2910 2.3961 2.5426 2.3471 1.9643 ***** 15 2.8648 3.8457 3.9854 3.7465 4.0069 2.6406 2.6832 2.4148 3.1031 2.4568 3.4319 2.8034 2.8666 1.7235 ***** 16 3.6106 4.2002 4.8545 4.3416 4.5895 3.3174 3.8671 3.4270 3.5258 3.0630 4.2167 2.8829 2.3980 2.9193 3.3344 ***** 17 2.5340 3.5795 3.7543 3.8727 3.7322 2.8009 2.9625 2.2950 2.2858 2.2311 2.8774 2.4509 2.2694 2.2599 2.4003 2.8310 ***** 18 2.9243 3.8818 3.9923 4.4638 2.6090 2.6122 2.6067 2.4018 1.9155 2.3938 3.0836 2.6696 2.3900 2.3051 2.8772 3.0464 2.0109 19 4.1831 5.3755 5.2298 4.8159 5.6895 4.7491 4.5868 4.5445 4.4416 4.0908 4.3430 4.2575 4.1179 3.8289 4.3986 4.3883 4.2096 20 2.7583 3.7234 3.8759 4.0776 3.8095 2.6664 2.5025 2.5134 2.6964 2.7639 3.1339 2.3548 2.3543 2.4183 2.4774 3.4441 2.3237 21 2.5848 3.8344 3.7362 3.7720 4.3475 3.0046 3.0801 3.0899 3.0193 2.4808 3.4206 2.9368 2.4691 2.5970 2.7828 3.7091 2.4417 22 4.3773 4.7881 4.5338 5.1641 5.3565 4.0492 4.2446 4.2985 4.2208 3.7782 4.5135 3.5464 3.8667 3.9438 4.2927 4.5974 4.0152 23 4.1197 4.5894 5.1098 4.6991 5.7032 3.9886 4.1385 3.9663 4.1274 3.8368 4.1850 4.2014 3.7238 3.5868 3.9871 4.6737 3.8024 24 4.0655 4.7670 4.8822 4.8133 5.5424 4.1236 4.1650 4.7792 4.3282 3.8894 4.6783 3.8712 3.8077 4.0273 4.5591 4.5217 4.2586 25 3.5974 4.8567 4.4796 4.8172 4.8828 4.0255 3.8515 3.7876 3.8688 3.2907 4.0323 3.5242 3.4346 3.3419 3.5717 3.7584 3.4275 26 3.4586 3.9568 4.6801 1.1453 4.8672 3.6998 3.8792 3.8572 3.9082 3.4178 3.9699 3.3900 3.0369 3.2185 3.2866 3.8020 3.4632 27 3.6242 4.5733 4.4106 4.6371 4.9945 4.1078 4.2778 3.8244 3.9144 3.2626 4.5486 3.5349 3.8008 3.6848 3.9985 4.0299 3.8833 28 3.2500 4.3862 4.4266 4.2398 5.1229 3.8514 4.0669 3.9586 3.7350 3.3376 3.5287 3.3651 3.6403 3.3827 4.4027 3.7195 3.5992 29 3.5983 4.3682 4.1076 3.9972 5.0424 3.5559 3.5133 3.4075 3.4468 2.8539 3.1766 3.3246 3.5368 2.9979 3.2277 4.0783 3.3756 30 3.9449 4.3592 4.7255 5.3938 4.4501 4.2020 3.8672 3.4533 3.3960 3.6233 3.6145 3.6327 3.5399 3.2729 3.5539 4.6098 3.1469 31 3.1507 4.5183 3.6761 4.7035 4.6547 3.2905 3.6228 3.9328 3.6294 3.0285 3.9808 3.6492 3.6951 3.2713 3.1892 3.5724 3.2166 32 3.5595 4.6745 4.3548 4.4698 4.8081 3.8110 3.1791 3.6497 3.5519 3.6263 3.6069 3.4313 3.3314 2.9496 3.3426 3.8828 3.3504 33 4.0262 4.0757 4.4525 4.3482 4.6368 3.6590 3.6736 3.8569 3.9925 3.7337 4.0009 3.7163 3.6568 3.5157 3.0315 3.7535 3.5872 34 3.3112 4.2820 4.0759 4.1565 5.5110 3.4902 3.9711 3.4708 3.8210 3.0239 3.9037 3.3185 3.5426 3.4024 3.3285 3.6013 3.0283 Clone no. 18 19 20 21 22 23 24 25 26 27 28 29 30 31 32 33 34 18 ***** 19 4.2929 ***** 20 2.2611 4.3044 ***** 21 2 .7934 3.7381 2.6113 ***** 22 4.0370 5.9374 4.1382 2.8479 ***** 23 3.7749 5.7189 4.1307 3.1600 3.9334 ***** 24 3.9604 5.7454 4.1772 3.4203 3.8834 3.8496 ***** 25 3.4818 4.7926 3.4664 3.3713 4.4837 3.8560 4.8441 ***** 26 3.7415 4.8987 3.6265 3.4833 4.3089 3.8378 4.4885 4.0061 ***** 27 3.8210 4.8218 3.5941 3.6411 4.3290 4.8406 4.8250 4.3088 3.9284 ***** 28 3.8265 4.7223 3.6744 3.7976 4.4475 4.7296 4.3145 4.4401 3.6061 4.1207 ***** 29 3.7273 5.0802 3.1423 3.1764 3.7642 3.9338 3.9793 3.9074 3.4138 4.0290 3.7306 ***** 30 3.2300 4.4571 3.3576 3.7652 4.8362 4.9201 5.2535 4.1332 4.3654 4.3638 4.3662 3.8227 ***** 31 3.2426 4.2782 3.2036 3.1735 3.9646 3.7402 3.4573 3.8715 4.2311 3.7918 4.1766 3.9653 4.5629 ***** 32 3.4533 4.7583 3.3655 3.5474 4.4053 4.2056 4.4643 4.3585 3.5190 4.0300 4.2902 3.4900 3.8986 3.6664 ***** 33 3.5394 4.9762 3.7082 3.9110 5.0799 4.5533 5.0307 3.9672 3.6708 4.7100 4.8576 3.8790 4.0802 4.2533 3.7072 ***** 34 3.3174 4.4522 3.6686 3.4087 4.9640 4.1714 4.9461 4.0821 3.7749 3.9512 4.1289 3.8828 4.2356 3.5100 4.3085 4.3924 **** A R IC I GÜ LB İTT İ, S ., H . K E N D İR , C . S A N C A K , C .S . S E V İMA Y ,H . E K İZ a nd S . ÖZC A N , “ Ge n e tic r e lat ion s h ip s 1 4 5 a mon g m e d ic a g o s a tiv a L . c lon e s c o m mon ly g rown in C e n tr a l A n a to lia ”
146 TARIM BİLİMLERİ DERGİSİ 2009, Cilt 15, Sayı 2
Figure 1. Phenogram constructed using the UPGMA method.
According to the genetic distance matrix presented in Table 5, genetic distance values ranged 5.9374 to 1.1453. The most closely related pairs were clone number 4 & 26, 14 & 15 and clone 9 & 18, with genetic distance of 1.1453, 1.7235 and 1.9155, respectively. These relationships are also reflected in Figure 1. The clone pairs (4 & 26, 14 &15 and 9 & 18) were collected from areas showing similar ecogeographic characteristic in Central Anatolia.
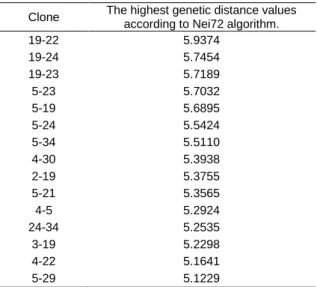
Selection of highly variable approximately 10-15 individuals is necessary to obtain a polycross in synthetic variety breeding. The clones with the highest genetic distance values in genetic distance matrix were selected (Table 5). Their genetic distance values ranged 5.9374 to 5.1229 and are listed in Table 6. The highest genetic distance value (5.9374) was found between clone 19 and 22. Related clone pairs showing high genetic distance were clone 19 & 24, 19 & 23, 5 & 23 and 5 & 19 with 5.7454, 5.7189, 5.7032 and 5.6895 respectively) followed closely by genetic distance matrix value of clone pair 19 & 22. It was seen that clone 4, 5 and 19 had the high genetic distance compared to other clones. However, there are no
meaningful relations concerning locations of the clones showing high genetic distance.
Table 6. Selected clones for synthetic variety breeding Clone The highest genetic distance values
according to Nei72 algorithm.
19-22 5.9374 19-24 5.7454 19-23 5.7189 5-23 5.7032 5-19 5.6895 5-24 5.5424 5-34 5.5110 4-30 5.3938 2-19 5.3755 5-21 5.3565 4-5 5.2924 24-34 5.2535 3-19 5.2298 4-22 5.1641 5-29 5.1229
The locations of the clone pairs showing high genetic distance indicate implications of different ecogeoprachic characteristics on development of plants.
A synthetic variety is developed by intercrossing a number of genotypes known for superior combining ability with high genetic distance. Therefore, synthetic variety is made up of genotypes previously tested for their ability to produce a superior progeny when crossed in all combinations in agreement with Ferreira et al. (1995) who emphasised that heterosis and the combining ability of parents depend directly on the genetic diversity between them and the chance of finding promising combinations is better when more divergent material is used.
The feasibility of using AFLP DNA markers in future marker-based assessments of genetic diversity in alfalfa was supported by the observation that hierarchical patterns of diversity among the germplasms were associated with their geographic, origins. Use of these primers for automated AFLP analysis could be used as a high-throughput system for accurately characterizing genetic diversity among large numbers of alfalfa populations for breeding purpose. This information should also prove useful in designing strategies to more efficiently manipulate heterosis in alfalfa. This approach could subsequently be refined to include individual genotype analysis for more detailed characterization of specific populations of interest.
Acknowledgement
Authors acknowledge the help and technical guidance by Assoc. Prof. Dr. Khalid Mahmood Khawar, Department of Field Crops, Faculty of Agriculture, Ankara University, Ankara, Turkey.
References
Bingham, E.T. 1980. Maximizing heterozygosity in autopolyploid. In: Polyploidy: Biological Relevance. (Eds. Lewis, W.H.) Plenum, New York, pp. 471–491. Doyle, J.J. and J.L. Doyle.1987. A rapid DNA isolation
procedure for small quantities of fresh leaf tissue. Phytochemcal Bulletin 19: 11-15.
Ferreira, D.F., A.C. Oliveira, M.X. Dos Santos, and M.A.P. Ramalho. 1995. Métodos de avaliação da divergência genética em milho e suas relações com os cruzamentos dialélicos. Pesquisa Agropecuária Brasileira 30: 1189-1194.
Moreno-Gonzales, J. and J.I. Cubero. 1994. Selection strategies and choise of breeding methods. In: Plant Breeding. (Eds. Hayward, M.D., Bosemark, N.O. and Omagosa, I.), Chapman and Hall, London, UK. Kidwell, K.K., E.T. Bingham, D.R. Woodfield and T.C. Osborn.
1994a. Relationships among genetic distance, forage yield and heterozygosity in isogenic diploid and tetraploid alfalfa populations. Theoretical and Applied Genetics 89: 323-328.
Kidwell, K.K., D.R. Woodfield, E.T. Bingham and T.C. Osborn. 1994b. Molecular marker diversity and yield of isogenic 2x and 4x single-crosses of alfalfa. Crop Science 34: 784-788.
Labombarda, P., F. Pupilli and S. Arcioni. 2000. Optimal population size for RFLP-assisted cultivar identification in alfalfa (Medicago sativa L.). Agronomie 20: 233–240. Maureira, I.J., F. Ortega, H. Campos, and T.C. Osborn. 2004.
Population structure and combining ability of diverse Medicago sativa germplasms. Theoretical and Applied Genetics 109: 775–782.
Osborn, T.C., D.J. Brouwer and K.K. Kidwell. 1998. Exploiting genome differences for higher alfalfa forage yield. Proceedings of the North American Alfalfa Improvement Conference, Bozeman, MT. 95.
Rohlf, J. 2000. Numerical taxonomy and multivariate analysis system. Version 2.1. Exeter Software, Applied Biostatistics Inc, New York, USA.
Rumbaugh, M.D., J.L. Caddel and D.E. Rowe. 1988. Breeding and Quantitative genetics. In: Alfalfa and alfalfa improvement (Eds. Hanson, A.A., Barnes, D.K. and Hill, R.R.). Agronomy monograph no. 29. ASA, CSSA, and SSSA, Madison, Wis. 777–807.
Segovia-Lerma, A., R.G. Cantrell, J.M. Conway and I.M. Ray. 2003. AFLP-based assessment of genetic diversity among nine alfalfa germplasms using bulk DNA templates. Genome 46: 51-58.
Sumberg, J.E., R.P. Murphy and C.C. Lowe. 1983. Selection for fiber and protein concentration in a diverse alfalfa population. Crop Science 23: 11–14.
Vos, P., R. Hogers, M. Bleeker, M. Reijans, T. Van de Lee, M. Hornes, A. Fritjers, J. Pot, J. Peleman, M. Kuiper and M. Zabeau. 1995. AFLP - a new technique for DNA-fingerprinting. Nucleic Acids Research 23: 4407–4.
____________________________________
Correspondance Address: Selma GÜLBİTTİ ONARICI
The Scientific and Technical Council of Turkey
Research Institute for Genetic Engineering and Biotechnology P.O. Box 21, 41470 Gebze-Kocaeli/Turkey
Tel: +90 (262)6773343