Electron Impact
–Mass Spectrometry Fingerprinting
and Chemometrics for Rapid Assessment of Authenticity
of Edible Oils Based on Fatty Acid Profiling
Adnan Kenar1&Burhanettin Çiçek2&Fatma Nur Arslan3,4&Gönül Akin3&Şükriye Nihan Karuk Elmas3&Ibrahim Yilmaz3 Received: 29 October 2018 / Accepted: 11 February 2019 / Published online: 22 February 2019
# Springer Science+Business Media, LLC, part of Springer Nature 2019 Abstract
A new methodology is described herein that provides an experimentally simple, rapid, and cost-effective mass fingerprinting method for the assessment of edible oil authentication based on their fatty acid methyl ester (FAMEs). This analytical approach is based on the application of electron impact (EI) ionization–mass spectrometry (MS) without chromatographic separation, followed by the treatment of the spectral data via chemometrics analysis, linear discriminant analysis (LDA), principal compo-nent analysis (PCA), soft independent modeling of class analogies (SIMCA), and hierarchical cluster analysis (HCA). This fingerprinting analysis was applied by using a gas chromatography–mass spectroscopy instrument, without chromatographic column usage and ion identification; therefore, each measurement lasted about 1 min. All multivariate analyses provided excellent discriminations between the edible oil clusters with low classification error. LDA models constructed with six predictors and a total of 100% of edible oil samples from different brands were correctly classified. Furthermore, no misclassification was reported for the discriminant analysis in supervised SIMCA models with an accuracy of 95%. Thus, the present results pointed to the successful application of such methodology to detect, for the first time, authentication of the edible oils.
Keywords Electron impact ionization–mass spectroscopy . Fingerprinting . Chemometrics . Authenticity . Edible oil . Fatty acid methyl ester
Abbreviations
ATR Attenuated total reflectance BCSO Black cumin seed oil
CSO Cottonseed oil
EI Electron impact
FA Fatty acid
FAME Fatty acid methyl ester
FL Fluorescence
FTIR Fourier transform infrared HCA Hierarchical cluster analysis
Electronic supplementary material The online version of this article (https://doi.org/10.1007/s12161-019-01472-0) contains supplementary material, which is available to authorized users.
* Adnan Kenar
[email protected] Burhanettin Çiçek
[email protected] Fatma Nur Arslan
[email protected] Gönül Akin
[email protected] Şükriye Nihan Karuk Elmas [email protected]
Ibrahim Yilmaz [email protected]
1 Department of Chemistry, Faculty of Science, University of Ankara,
06100 Ankara, Turkey
2
Department of Chemistry, Chemical Engineering, Faculty of Engineering, University of Ankara, 06100 Ankara, Turkey
3
Department of Chemistry, Faculty of Science, University of Karamanoglu Mehmetbey, 70100 Karaman, Turkey
4 Van’t Hoff Institute for Molecular Sciences, Analytical Chemistry
Group, University of Amsterdam, Science Park 904, 1098 XH Amsterdam, Netherlands
HNO Hazelnut oil
LDA Linear discriminant analysis
MS Mass spectrometry
PCA Principal component analysis
SBO Soybean oil
SFO Sunflower oil
SIMCA Soft independent modeling of class analogies SyF Synchronous fluorescence spectra
VOO Virgin olive oil
Introduction
Edible oils, especially high-priced ones, are targets of extend-ed fraud. Some extend-edible oils obtainextend-ed from the fruit or seextend-eds have highly regarded nutritional properties mainly attributed to the high levels of unsaturated fatty acids (UFAs) as well as bioactive compounds, which act positively on health and help protect against diseases. Low yield and high production costs of such oils make adulteration and authentication a very at-tractive practice. Frequently, therefore, more valuable vegeta-ble oils are adulterated with lower cheap and low-quality oils. Thus, the development of rapid, reliable, and cost-effective analytical methods for detecting adulteration/authentication of edible oils is a focus of great interest (Dourtoglou et al. 2013; Mu et al.2014; de Melo Milanez and Pontes2015).
Remarkable efforts have been invested in developing ex-perimentally simple, rapid, accurate, and cost-effective analyt-ical methods for the authentication of edible oils (Catharino et al.2005; Alves et al.2010). More recently, numerous troscopic methods based on Fourier transform infrared spec-troscopy (FTIR) (Luna et al.2013; Gouvinhas et al. 2015; Georgouli et al. 2017), near infrared (NIR) (Yang and Irudayaraj2001; Mendes et al.2015), nuclear magnetic reso-nance (NMR) (Gouilleux et al.2018; Sani et al.2018; Zhang et al.2018), Raman (Teresa et al. 2017; Yildiz Tiryaki and Ayvaz2017), and fluorescence (Tan et al.2017; Durán et al. 2018) techniques combined with multivariate analysis have fabricated good results, though the fingerprint spectra cannot be resolved into individual mass numbers or compounds (Goodacre et al.2002; Wu et al. 2004; Eide and Zahlsen 2005). Standard chromatographic methods based on high-per-formance–liquid chromatography (HPLC) and gas chroma-tography (GC), followed by mass spectroscopy (MS) (Thurnhofer and Vetter 2005; Yang et al. 2013) or MS/MS (Fasciotti and Pereira 2010), have been successfully applied for identifying adulterants by obtaining peaks and spectra for individual compounds. However, chromatographic separa-tions and curve resolusepara-tions become complicated with ex-tremely complex edible oil products, and the methods are also time-consuming and resource-, labor-, and senior analyst-de-manding. Moreover, most of the reported methodologies re-quire hazardous chemical usage (Catharino et al.2005; Eide
and Zahlsen 2005; Alves et al. 2013; Ng et al. 2018). To eliminate these disadvantaged fingerprint analyses, recently, there has been a great of interest in the use of soft or hard ionization MS methods based on matrix-assisted laser desorp-tion ionizadesorp-tion (MALDI), electrospray ionizadesorp-tion (ESI), or electron impact (EI) ionization for the authentication and adul-teration of various food analyses (Wu et al.2004; Thurnhofer and Vetter2005; Alves et al.2010; Yang et al.2013).
Electron impact ionization–mass spectroscopy (EI–MS) without chromatographic column usage is an extremely fast (1 min per sample), versatile, reproducible, and sensitive tech-nique and is capable of ionizing a wide range of fatty acid molecules. Furthermore, direct usage of the EI–MS technique requires no or little sample preparation procedure (Thurnhofer and Vetter 2005; Yang et al.2013). Several studies have re-ported the employment of EI–MS to obtain fingerprints of many types of food samples such as potato tubers (Roessner et al.2000), meat (Mottier et al.2000), vegetable oils (Vichi et al.2003; Thurnhofer and Vetter 2005; Yang et al.2013), cereal-based foods (Pittet et al. 2004), and honey samples (Rissato et al.2007). Thanks to the several advantages and the omission of chromatographic separation, the mass finger-printing methodology by using different ionization techniques has been also applied for rapid detection of crude oil or vege-table oil adulteration, after dilution of triglycerides or sterols and extraction of phenolic compounds and fatty acids (FAs) (Goodacre et al.2002; Catharino et al.2005; Alves et al.2010). In this study, a direct EI–MS fingerprinting methodology without chromatographic separation and ion identification on-to GC–MS instrument is presented as an attractive alternative to already established authentication approaches. Taking into account the reported encouraging results, we decided to sys-tematically use this analytical approach also for evaluation of the authentication of frequently partaking edible oils in Turkey markets. A new methodology is described herein that provides an experimentally simple, rapid, and cost-effective finger-printing method for the assessment of edible oil authentication based on fatty acid profiling. The obtained soft ionized (11 eV) mass spectra were subjected to linear discriminant analysis (LDA), principal component analysis (PCA), soft in-dependent modeling of class analogies (SIMCA), and hierar-chical cluster analysis (HCA).
Materials and Methods
Samples and Chemicals
All edible oils [eight different brands of cold-pressed black cumin seed oil (BCSO) BCSO-A to H; five different brands of sunflower oil (SFO), SFO-A to E; six different hazelnut oils (HNO), HNO-A to F; five different soybean oils (SBO), SBO-A to E; five different virgin olive oils (VOO), VOO-A to E; and
five different cottonseed oils (CSO), CSO-A to E] were pur-chased from local supermarkets, local herbs markets, and fac-tory outlets in Turkey. The quality grades of all studied vege-table oils were guaranteed by the suppliers. The criteria spec-ified on their labels were taken into consideration to specify theBquality grade,^ and it was organoleptically assessed that the freshness and oxidation values of all studied samples are within acceptable limits. In the selection of the samples used for this study, the oil products with the highest sales potential and shelf dominance in the local herbs markets were taken into consideration. Color, flavor, and taste of the oils were assessed as rough indicators for freshness. A total of 34 pure oil samples were filtered through 0.45-μm PTFE membrane filters before mass spectroscopy and GC–flame ionization de-tector (FID) analysis. All samples were stored in a dark envi-ronment before analysis.
Spectroscopic and chromatographic grade chemicals were purchased from VWR International (Poole, UK) and Sigma-Aldrich Chemicals (Zwijndrecht, The Netherlands). The fatty acid methyl ester (FAME) standard mixture FAME Mix C4– C24was purchased from Supelco (Bellefonte, PA, USA). All chemicals were used directly without further purification.
Preparation of Fatty Acid Methyl Esters
Fatty acid methyl esters of edible oils were prepared by the base-catalyzed esterification procedure (Arslan et al.2017). The solution of 2 N KOH/CH3OH was freshly prepared in the laboratory by dissolving KOH in chromatography grade methanol; 0.1 g of the oil sample was weighed and dissolved in 1 mL of 2 N KOH solution prepared in methanol. After centrifugation for 5 min at 2000 rpm, the clear supernatant was transferred to vials and stored at− 30 °C until analysis.
Instrumentation
Direct Electron Impact Ionization–Mass Spectroscopy Analysis For direct EI–MS analyses, an Agilent 7890A model GC sys-tem equipped with a 5975C model quadrupole mass selective detector (Agilent Technologies Inc., Wilmington, DE, USA) was used. The FAMEs were injected directly and undiluted into the GC port equipped with fused silica uncoated quartz column. With this injection, each analysis takes less than 1 min. Samples of 1μL were injected and led into the mass spectrometer using a fused silica uncoated quartz tubing (300 cm length, 2.5 cm inner diameter), without separation on a chromatographic column. This tubing tool prevents con-tact of the sample with the instrument, similar to the chromato-graphic column, which prevents the possibility of shortening the lifetime of the used GC–MS system due to chemicals from the sample. Hence, the GC–MS analysis system used in the analyses can be easily used without any change or shortening
of its lifetime (approximately 15–20 years) which is stated by the experts. The splitless injection mode was used. The carrier gas was helium, with a flow of 1 mL/min. The ion source temperature was 250 °C, and the interface temperature was 280 °C. The ionization voltage was 11 eV and mass spectra were recorded in the range of m/z 10–400 at an acquisition rate of 0.1 scan/s. The elution of peaks was started after 1 min of the injection and takes about 4 s to complete elution. However, the MS spectrum at the end of the peak differs slightly from that of the beginning. Therefore, all MS spectra in this 4-s range were transferred to a spreadsheet page and summed up according to mass values to yield a single MS spectrum for that specific injection. The data were collected from mean mass spectra recorded for five replicates.
Fatty Acid Determination by GC–FID
The fatty acid profile was quantified via base-catalyzed ester-ification into FAME according to the modified method report-ed by Kramer et al. (2002). The FAME analyses were per-formed on an Agilent 7890A model GC system equipped with a FID (Agilent Technologies Inc., Wilmington, DE, USA) and highly polar HP-88 cyanopropyl capillary column (100 m × 0.25 mm i.d. with a 0.2-μm film thickness) (Agilent Technologies Inc., Wilmington, DE, USA). FAME sample of 1μL was injected with the split ratio of 50:1. The carrier gas was helium, with a flow of 0.8 mL min−1. The inlet block and detector temperatures were kept at 250 °C. The fuel gas was hydrogen at the flow rate of 40 mL min−1, and the oxidant gas was air at the flow rate of 400 mL min−1. The oven initial temperature was 45 °C and held in this temperature for 5 min, then ramped into 175 °C (10 °C min−1) and held in this tem-perature for 25 min, and increased from 175 to 215 °C (4 °C min−1) and finally held at 215 °C for 33 min. GC–FID data were recorded using Agilent’s Chemstation B.03.02– 2008 data processor. The relative content of fatty acids in oil samples was determined by calculating the area of the corre-sponding fatty acid peak with appropriate normalization to the sum of the areas of all the fatty acid peaks. All measurements were conducted in triplicate and the results were reported as mean ± standard deviation.
Software, Data Pretreatment, and Multivariate Data
Analysis
LDA, PCA, SIMCA, and HCA were performed with Unscrambler®X10.4 (CAMO software, Oslo, Norway) and Octave Chemometrics Software Version 4.2.1 (GNU General Public License).
The data were exported to the ASCII format, and the matrix was constructed by placing the mass-to-charge (m/ z) values of selected ions and the oil samples into columns and rows, respectively. The relative intensity of each ion
was then inserted into the data matrix for each oil sample. The transformed abundances of all ions recorded in the re-gions of m/z 90–400 and in the specific regions (with incre-ments of m/z 10 ranges after m/z 90) were used as input variables; therefore, 32 different data matrices were obtain-ed for multivariate data analysis. Prior to the chemometrics analysis, different data preprocessing methods were proven, and standard normal variate (SNV) and Savitzky–Golay smoothing preprocessing methods gave the best results in comparison with other pretreatments, like autoscaling or data normalization. SNV was originally proposed to reduce scattering effects and was also proven to be effective in correcting the interference caused by variations of optical path. The polynomial fitting algorithm by Savitzky and Golay was also applied due to its simplicity and acceptabil-ity. Furthermore, first- and second-order derivatives of sig-nal data were also investigated, because taking derivatives can enhance spectral resolution and remove baseline and background. Also, derivatives tend to degrade the signal-to-noise ratio by enhancing noise, and the derivative spectra were also computed by polynomial fitting algorithms. Thus, both pretreatments were performed to eliminate undesirable factors in the spectral raw data and to achieve accuracy for possible baseline shifts and intensity changes (Savitzky and Golay1964; De-Hua et al. 2012). After the pretreatment process, multivariate data analyses were performed using PCA, SIMCA, LDA, and HCA for the full and specific regions of the EI–MS spectra.
Results and Discussion
Direct EI
–MS Spectra and Fatty Acid Profile of Edible
Oils
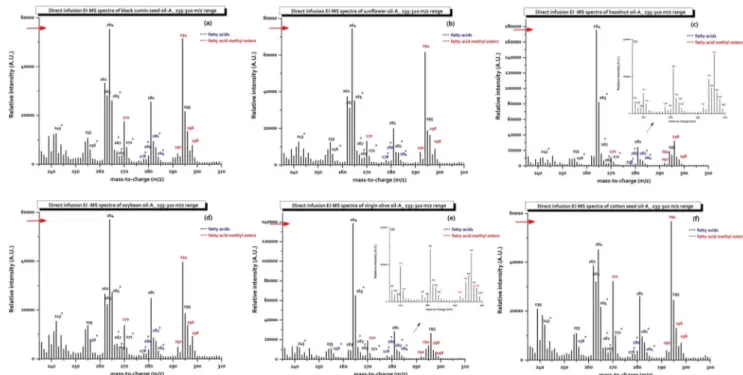
The electron impact ionization–mass spectra of FAMEs of edible oils are illustrated in Fig.1. The soft ionized mass spectra were obtained from GC–MS instrument without chro-matographic separation. As it can be seen from the figures, the EI–MS spectra represent largely unfragmented molecules from complex mixtures of FAMEs that have been ionized with the lowest voltage level of system. There are distinct lines per integer mass number on specific regions of the spectrum and each line may represent individual compounds or FAMEs with the same mass number. The intensities of ions related to the methyl esters of palmitic (C16:0, m/z 270), linolenic (C18:3, m/z 292), linoleic (C18:2, m/z 294), oleic (C18:1, m/z 296), and stearic acid (C18:0, m/z 298), respectively (Govinda et al.2010). The variations for the intensities of ions related to the FAs, FAMEs, and their protonated [M−H]+
, [M −15]+(loss of methyl), and [M−29]+
(loss of ethyl) forms were presented as line plot graphs in the basic regions of m/z 236– 260, m/z 260–268, m/z 268–275, m/z 275–287, and m/z 287– 300 (Supplementary Fig.1). As observed, the methyl ester of linoleic acid (C18:2, m/z 294) yielded the most intense signals for BCSO, SFO, CSO, and SBO samples, whereas oleic acid (C18:1, m/z 296) gave the most intense signals for HNO and VOO samples. The most abundant ions of the methyl ester of
Fig. 1 EI–MS spectra of the a black cumin seed oil-A, b sunflower oil-A, c hazelnut oil-A, d soybean oil-A, e virgin olive oil-A, and f cottonseed oil-A in the spectroscopic region of 235–310 m/z
palmitic acid (C16:0, m/z 270) were obtained for CSO sam-ples (Fig.1, Supplementary Fig.1c and1e). The mass spectra obtained from different brands of the same type of edible oils were highly similar. The spectra of the most abundant ions for BCSO, SFO, SBO, and CSO samples reflect the distribution of different FAMEs, and as demonstrated in Table1 and Supplementary Tables1–6, the spectra from these edible oils can be distinguished from each other, although they are quite similar. Likewise, the spectra from VOO and HNO samples can be discriminated from each other, despite their similar fatty acid profiles.
Approaches usually used for authentication of fats and oils are most frequently based on the GC analysis of the FA profile (Thurnhofer and Vetter2005). The FAMEs of studied edible oils were identified by retention time com-parison with those of the corresponding standards, and the
peak areas were calculated for the quantitative analysis by GC–FID analysis. The results of GC–FID analysis are in agreement with the findings of other researchers (Dubois et al. 2007; Zambiazi et al.2007). Thirty-seven fatty acid methyl esters were identified; as well, total saturated fatty acids (SFAs), monounsaturated fatty acids (MUFAs), polyunsaturated fatty acids (PUFAs), and trans fatty acids were also under evaluation. The fatty acid composition of t h e s t u d i e d s a m p l e s i s s h o w n i n Ta b l e 1 a n d Supplementary Tables 1–6. Linoleic acid was the main FA found in all BCSO (51.24–56.90%), SFO (45.77– 56.70%), SBO (45.73–59.87%), and CSO (52.12– 54.92%) samples. Oleic acid was the main fatty acid found in all HNO (60.62–76.8%) and VOO (66.44– 71.79%) samples, except the HNO-D. The variation in FA profile of these samples is related to the environmental
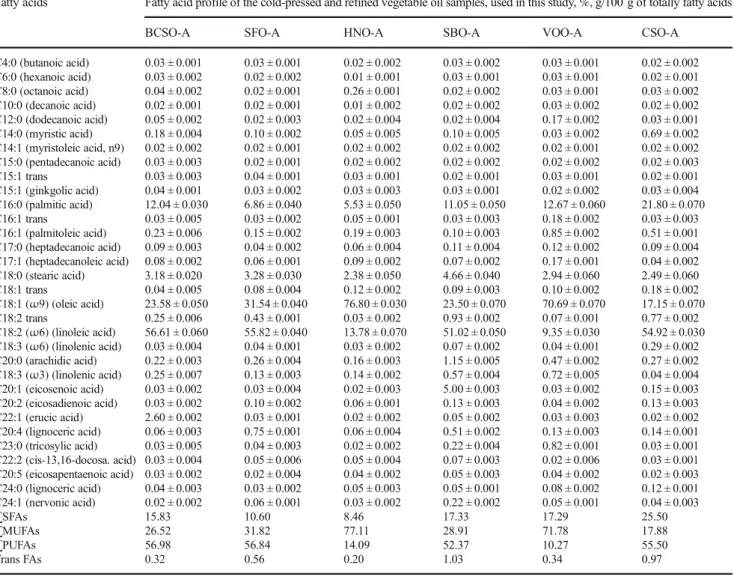
Table 1 Summary of the relative levels of different fatty acids in the studied edible oils, g/100 g of totally fatty acids
Fatty acids Fatty acid profile of the cold-pressed and refined vegetable oil samples, used in this study, %, g/100 g of totally fatty acids
BCSO-A SFO-A HNO-A SBO-A VOO-A CSO-A
C4:0 (butanoic acid) 0.03 ± 0.001 0.03 ± 0.001 0.02 ± 0.002 0.03 ± 0.002 0.03 ± 0.001 0.02 ± 0.002 C6:0 (hexanoic acid) 0.03 ± 0.002 0.02 ± 0.002 0.01 ± 0.001 0.03 ± 0.001 0.03 ± 0.001 0.02 ± 0.001 C8:0 (octanoic acid) 0.04 ± 0.002 0.02 ± 0.001 0.26 ± 0.001 0.02 ± 0.002 0.03 ± 0.001 0.03 ± 0.002 C10:0 (decanoic acid) 0.02 ± 0.001 0.02 ± 0.001 0.01 ± 0.002 0.02 ± 0.002 0.03 ± 0.002 0.02 ± 0.002 C12:0 (dodecanoic acid) 0.05 ± 0.002 0.02 ± 0.003 0.02 ± 0.004 0.02 ± 0.004 0.17 ± 0.002 0.03 ± 0.001 C14:0 (myristic acid) 0.18 ± 0.004 0.10 ± 0.002 0.05 ± 0.005 0.10 ± 0.005 0.03 ± 0.002 0.69 ± 0.002 C14:1 (myristoleic acid, n9) 0.02 ± 0.002 0.02 ± 0.001 0.02 ± 0.002 0.02 ± 0.002 0.02 ± 0.001 0.02 ± 0.002 C15:0 (pentadecanoic acid) 0.03 ± 0.003 0.02 ± 0.001 0.02 ± 0.002 0.02 ± 0.002 0.02 ± 0.002 0.02 ± 0.003 C15:1 trans 0.03 ± 0.003 0.04 ± 0.001 0.03 ± 0.001 0.02 ± 0.001 0.03 ± 0.001 0.02 ± 0.001 C15:1 (ginkgolic acid) 0.04 ± 0.001 0.03 ± 0.002 0.03 ± 0.003 0.03 ± 0.001 0.02 ± 0.002 0.03 ± 0.004 C16:0 (palmitic acid) 12.04 ± 0.030 6.86 ± 0.040 5.53 ± 0.050 11.05 ± 0.050 12.67 ± 0.060 21.80 ± 0.070 C16:1 trans 0.03 ± 0.005 0.03 ± 0.002 0.05 ± 0.001 0.03 ± 0.003 0.18 ± 0.002 0.03 ± 0.003 C16:1 (palmitoleic acid) 0.23 ± 0.006 0.15 ± 0.002 0.19 ± 0.003 0.10 ± 0.003 0.85 ± 0.002 0.51 ± 0.001 C17:0 (heptadecanoic acid) 0.09 ± 0.003 0.04 ± 0.002 0.06 ± 0.004 0.11 ± 0.004 0.12 ± 0.002 0.09 ± 0.004 C17:1 (heptadecanoleic acid) 0.08 ± 0.002 0.06 ± 0.001 0.09 ± 0.002 0.07 ± 0.002 0.17 ± 0.001 0.04 ± 0.002 C18:0 (stearic acid) 3.18 ± 0.020 3.28 ± 0.030 2.38 ± 0.050 4.66 ± 0.040 2.94 ± 0.060 2.49 ± 0.060 C18:1 trans 0.04 ± 0.005 0.08 ± 0.004 0.12 ± 0.002 0.09 ± 0.003 0.10 ± 0.002 0.18 ± 0.002 C18:1 (ω9) (oleic acid) 23.58 ± 0.050 31.54 ± 0.040 76.80 ± 0.030 23.50 ± 0.070 70.69 ± 0.070 17.15 ± 0.070 C18:2 trans 0.25 ± 0.006 0.43 ± 0.001 0.03 ± 0.002 0.93 ± 0.002 0.07 ± 0.001 0.77 ± 0.002 C18:2 (ω6) (linoleic acid) 56.61 ± 0.060 55.82 ± 0.040 13.78 ± 0.070 51.02 ± 0.050 9.35 ± 0.030 54.92 ± 0.030 C18:3 (ω6) (linolenic acid) 0.03 ± 0.004 0.04 ± 0.001 0.03 ± 0.002 0.07 ± 0.002 0.04 ± 0.001 0.29 ± 0.002 C20:0 (arachidic acid) 0.22 ± 0.003 0.26 ± 0.004 0.16 ± 0.003 1.15 ± 0.005 0.47 ± 0.002 0.27 ± 0.002 C18:3 (ω3) (linolenic acid) 0.25 ± 0.007 0.13 ± 0.003 0.14 ± 0.002 0.57 ± 0.004 0.72 ± 0.005 0.04 ± 0.004 C20:1 (eicosenoic acid) 0.03 ± 0.002 0.03 ± 0.004 0.02 ± 0.003 5.00 ± 0.003 0.03 ± 0.002 0.15 ± 0.003 C20:2 (eicosadienoic acid) 0.03 ± 0.002 0.10 ± 0.002 0.06 ± 0.001 0.13 ± 0.003 0.04 ± 0.002 0.13 ± 0.003 C22:1 (erucic acid) 2.60 ± 0.002 0.03 ± 0.001 0.02 ± 0.002 0.05 ± 0.002 0.03 ± 0.003 0.02 ± 0.002 C20:4 (lignoceric acid) 0.06 ± 0.003 0.75 ± 0.001 0.06 ± 0.004 0.51 ± 0.002 0.13 ± 0.003 0.14 ± 0.001 C23:0 (tricosylic acid) 0.03 ± 0.005 0.04 ± 0.003 0.02 ± 0.002 0.22 ± 0.004 0.82 ± 0.001 0.03 ± 0.001 C22:2 (cis-13,16-docosa. acid) 0.03 ± 0.004 0.05 ± 0.006 0.05 ± 0.004 0.07 ± 0.003 0.02 ± 0.006 0.03 ± 0.001 C20:5 (eicosapentaenoic acid) 0.03 ± 0.002 0.02 ± 0.004 0.04 ± 0.002 0.05 ± 0.003 0.04 ± 0.002 0.02 ± 0.003 C24:0 (lignoceric acid) 0.04 ± 0.003 0.03 ± 0.002 0.05 ± 0.003 0.05 ± 0.001 0.08 ± 0.002 0.12 ± 0.001 C24:1 (nervonic acid) 0.02 ± 0.002 0.06 ± 0.001 0.03 ± 0.002 0.22 ± 0.002 0.05 ± 0.001 0.04 ± 0.003 ∑SFAs 15.83 10.60 8.46 17.33 17.29 25.50 ∑MUFAs 26.52 31.82 77.11 28.91 71.78 17.88 ∑PUFAs 56.98 56.84 14.09 52.37 10.27 55.50 Trans FAs 0.32 0.56 0.20 1.03 0.34 0.97
BCSO, black cumin seed oil; SFO, sunflower oil; HNO, hazelnut oil; SBO, soybean oil; VOO, virgin olive oil; CSO, cottonseed oil; SFA, saturated fatty acid; MUFA, monounsaturated fatty acid; PUFA, polyunsaturated fatty acid
conditions and the genetic variability, or their authentica-tion situaauthentica-tions (Kamal-eldin and Andersson1997).
The application of direct EI mass spectroscopy analysis is useful for the study of edible oil authentication; it can help us to know the variations of FAs, but it alone is not enough. It is difficult to define a quality index to detect an authentication, because the frauds could discover a way to make these signal indexes acceptable (Yang et al.2013). The spectra of all stud-ied oils presented in Supplementary Fig.2a also appeared quite similar, and it was very difficult to differentiate them. Thus, the application of multivariate analysis is necessary. Multivariate data analysis reported in the literature has been widely employed with data from various spectroscopic tech-niques. Furthermore, the development of these multivariate data analysis methods does not demand ion identification in mass analyses. Savitzky–Golay smoothing and SNV were used to preprocess the data before multivariate statistical anal-ysis. These preprocessing methods for correcting the shift in baseline and change in intensification will in general also han-dle possible future alterations and contribute to a robust meth-odology (Eide et al.2010).
Chemometric Modeling of Edible Oils by PCA
and SIMCA Based on EI
–MS Spectra
In the first phase of chemometric analysis, PCA and SIMCA were applied to the data sets obtained by direct EI mass analysis of methyl esters of FAs measured to investigate any clustering behavior related to the origin of edible oils. PCA is a suitable chemometric analysis for dealing with complex data sets acquired by spectroscopic or other ana-lytical techniques, enabling the discrimination of different groups of samples. This statistical analysis is used to reduce a large number of interrelated variables into a much smaller number of artificial variables which could detain most of the variance in the data set. Two complementary plots (scores and loading plots) also presented the results of PCA. The score plot indicates how the observations are dispersed and which of them are clustered to distinguish principal group-ings among observations; in other words, it illustrates sim-ilarities and differences between observations. Loading plots make known which variables could be related with which groupings and/or correlations among these
(a)
PCA score plot_EI–MS spectra_90–400 m/z region(b)
PCA score plot_EI–MS spectra_170–180 m/z region(c)
PCA score plot_EI–MS spectra_180–190 m/z region Fig. 2 PCA score plot of EI–MS spectra of edible oils in the spectroscopic region of a 90–400 m/z, b 170–180 m/z, and c 180–190 m/zobservations (Tu et al. 2016; Uncu and Ozen 2016; Ng et al.2018). Thus, PCA was frequently applied to deal with these complex data sets, leading to quick classification of various kinds of edible oils and helping us to identify au-thentication of edible oils.
Herein, transformed abundances of all ions recorded in the regions of m/z 90–400 and in the specific regions, which were generated with increments of m/z 10 ranges after m/z 90 (mass value of hexane used as a solvent for the procedure of FAMEs), were employed as input variables; thus, 32 different data matrices were obtained for PCA data analysis. In score plots, some edible oil samples were located far from the con-centrated region and so discarded for this purpose. Figure2 illustrates the score plots of PCA models generated from the data matrices of {170 × 311} (the region of m/z 90–400), {170 × 11} (the region of m/z 170–180), and {170 × 11} (the region of m/z 180–190) from five repetition analyses of each edible oils. Whereas the PCA plot based on the data of the regions of m/z 170–180 and m/z 180–190 demonstrates good separation of samples representing edible oils, less separated and relatively dispersed clusters were obtained by PCA of the
region of m/z 90–400 data. Despite not requiring ion identifi-cation for the development of the classifiidentifi-cation models, this methodology allows a qualitative mass spectra interpretation. The first PC in the region of m/z 90–400 explains 59% of the variation in the data, and the second PC explains 20% (eigen-value of 79% was achieved). Another 14% can be explained with three components (Fig.2a). As shown in Fig.2a, HNO and VOO samples were clustered very separately from other edible oils, consistent with their observable different FA pro-files. The fatty acid profiles of the studied BCSO samples (∑SFA = 14.57–16.72%, ∑MUFA = 23.60–31.54%, ∑PUFA = 52.30–59.62%) were quite similar to SBOs
(∑SFA = 16.18–16.18%, ∑MUFA = 32.11–16.18%,
∑PUFA = 50.84–16.18%), SFOs (∑SFA = 10.43–10.69%, ∑MUFA = 31.35–41.83%, ∑PUFA = 46.72–57.64%), and CSOs (∑SFA = 23.86–27.23%, ∑MUFA = 17.86–22.11%, ∑PUFA = 52.98–55.50%), despite that they are quite different from HNO (∑SFA = 8.40–10.08%, ∑MUFA = 36.66– 77.88%,∑PUFA = 12.67–48.22%) or VOO (∑SFA = 15.33–
18.11%, ∑MUFA = 69.55–72.62%, ∑PUFA = 10.27–
12.18%) samples (Table1and Supplementary Tables1–6).
(a)
PCA _EI–MS spectra_140–150 m/z region(b)
PCA _EI–MS spectra_190–200 m/z region(c)
PCA _EI–MS spectra_230–240 m/z region(d)
PCA _EI–MS spectra_240–250 m/z region(e)
PCA _EI–MS spectra_270–280 m/z region(f)
PCA _EI–MS spectra_290–300 m/z region(g)
PCA _EI–MS spectra_310–320 m/z region(h)
PCA _EI–MS spectra_320–330 m/z regionFig. 3 PCA score plot of EI–MS spectra of edible oils in the spectroscopic region of a 140–150 m/z, b 190–200 m/z, c 230–240 m/z, d 240–250 m/z, e 270–280 m/z, f 290–300 m/z, g 310–320 m/z, and h 320–330 m/z
The critical point that must be considered during PCA classification analyses of samples using mass spectra is the selection of optimal regions of m/z. To that end, the mass spectra of edible oils recorded in the regions of m/z 90–400 were divided into different m/z regions. As men-tioned above, these specific spectral regions were gener-ated with increments of m/z 10 ranges after m/z 90, so 32
different data matrices were obtained and PCA models were constructed on the basis of the areas of these re-gions (Figs. 2b, c and 3 and Supplementary Figs. 3–4). Higher eigenvalues were obtained in specific spectral re-gions, and it is evident that PCA models provide well classifications of different species of edible oils, accord-ing to their origin. The first PC in the regions of m/z
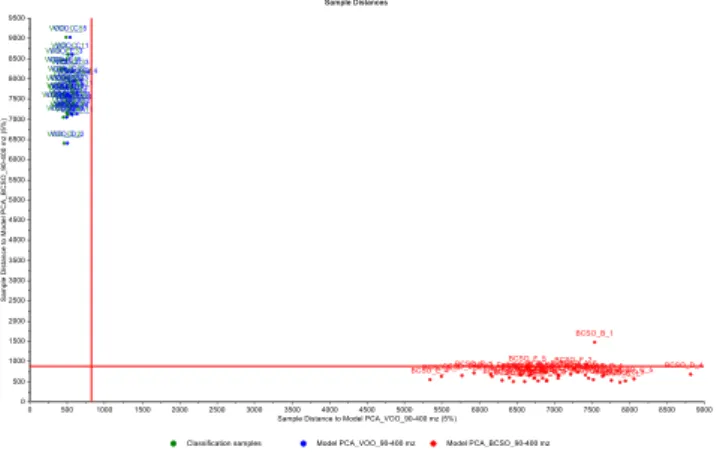
(a) Coomans plot_ VOOs from HNOs_EI–MS spectra_90–400 m/z region (b) Coomans plot_ VOOs from BCSOs_EI–MS spectra_90–400 m/z region
5
(c) Coomans plot_ VOOs from SFOs_EI–MS spectra_90–400 m/z region (d) Coomans plot_ VOOs from SBOs_EI–MS spectra_90–400 m/z region
(e) Coomans plot_ VOOs from CSOs_EI–MS spectra_90–400 m/z region
Fig. 4 Coomans plots for the classification of VOOs and a HNOs, b BCSOs, c SFOs, d SBOs, and e CSOs from PCA analysis of EI–MS spectra in the spectroscopic region of 90–400 m/z (95% confidence intervals)
170–180 and m/z 180–190 explains 83 and 86% of the variation in the data, and the second PC explains 10 and 12%, respectively (eigenvalues of 93% and 98% were achieved). The others 6 and 1% can be explained with three components (Fig. 2b, c). The score plots in these regions illustrate high repeatability of the mass data, and that the VOO, HNO, SFO, and CSO samples are clus-tered in different regions; however, BSCO and SBO sam-ples are located in similar regions. These observations are also attributed to quite similar palmitic, stearic, oleic, and linoleic acid profiles of BCSO and SBO samples. Despite the fatty acid profile similarity between HNO and VOO samples, the score plots in the regions of m/z 140–150, m/z 190–200, m/z 240–250, m/z 270–280, and m/z 290–300 illustrate that these samples are clustered in quite different regions from each other (Fig. 3a, b, d–f). As presented in Fig. 3a–e, CSO samples were clustered very separately from other edible oils in the score plots of m/z 140–150, m/z 190–200, m/z 230–240, m/z 240– 250, and m/z 270–280 regions. Likewise, SFO and BCSO samples were also well discriminated from other edible oils in the score plots of m/z 310–320 and m/z 320–330 regions, respectively (Fig. 3g, h). Therefore, the score plots in full or specific regions demonstrate that
the mass spectra obtained from the GC–MS instrument without chromatographic separation contain satisfactory information to classify edible oils.
After PCA, stepwise forward SIMCA was applied to the data in the full regions of m/z 90–400 to establish a predic-tive model for sample classification (Fig. 4 and Supplementary Figs.5–9). This frequently employed super-vised pattern recognition technique is based on a disjoint PCA model for each class. The critical distance for classi-fication defined as the mean orthogonal distance of training data from a given class is used to assign the new observa-tion in none, one, or numerous modeled classes. The sam-ple is projected into each modeled class and the residual distances calculated, and it is assigned to a class when its residual distance is below the statistical limits for the target class (Kharbach et al.2018). It is clear from Fig.4 that the excellent discriminations between VOOs and other edible oil samples were achieved using 5% significance level for critical distance. In Coomans plots, the x-axis shows the distance to VOO samples, while the y-axis shows the dis-tance to other edible oil samples (hazelnut, black cumin seed, sunflower, soybean, and cottonseed oils, respectively). Thus, the SIMCA models classified 100% of all samples accurately according to its group, meaning that no samples Fig. 5 Linear discriminant analysis of EI–MS spectra of edible oils in the spectroscopic region of 90–400 m/z using the linear method
were mistakenly classified into the wrong group. Similar SIMCA results were obtained constructed in the region of m/z 90–400 for BCSOs and other edible oil samples (Supplementary Fig. 7). From the GC–FID data presented above, it can be seen that SFOs have a closer similarity with SBOs and CSOs than other studied vegetable oils. Based on this similarity, the SIMCA classification models were also constructed (Supplementary Figs. 5, 8–9). It is clear from these plots that, except some brands of oil sam-ples, the classes of SFO, SBO, and CSO samples are well separated.
Chemometric Modeling for Edible Oils by LDA
and HCA Based on EI
–MS Spectra
In the second phase of chemometric analysis, LDA and HCA were applied to the mass data sets to investigate any clustering behavior related to the origin of the studied edible oil samples. The commonly used supervised pattern recognition technique, LDA, is based on the calculation of linear discriminant functions, which maximize the ratio of variance between given classes and simultaneously mini-mize the ratio of within-class variance. Classification re-sults of the LDA model were presented in terms of
recognition and prediction abilities. Recognition ability symbolizes a percentage of successfully classified samples in the Btraining set,^ and prediction ability represents a percentage of correctly classified samples in theBtest set^ by using the model developed during the training step (Vaclavik et al. 2011). Herein, linear and quadratic LDA models were developed, and recognition and prediction abilities representing the percentage of acceptably classi-fied samples during model training and cross-validation were calculated. In this model, 30 edible oils in different brands were treated as the training set to construct the model; the remaining samples (four edible oils in different brands) were the test set (Supplementary Table 7). LDA models were constructed with six predictors (black cumin seed, sunflower, hazelnut, soybean, virgin olive, and cot-tonseed oils) on simplified data sets (Fig. 5 and Supplementary Fig. 10). It is apparent from these figures that the maximal recognition and prediction abilities (both 100%), that is, no misclassification of the samples, were achieved for the LDA models based on mass data. The test sets were used to validate these models, and the prediction results are also shown in Supplementary Table 7, which indicate quite a successful classification and high predic-tion ability of the LDA model. Two brands of SBO (SBO-C Fig. 6 Dendrogram of edible oils recorded from hierarchical cluster analysis (HCA) of EI–MS spectra in the spectroscopic region of 90–400 m/z
and SBO-D), one brand of CSO (CSO-D), and one brand of HNO (HNO-D) samples were observed as doubtful sam-ples in PCA and SIMCA models, and for this reason, these samples were defined as theBtesting set^ in LDA models. HNO-D, SBO-C, and CSO-D samples were defined in SFO class according to the prediction test of the model. Other samples were processed as Btraining set^ in LDA models and all of them were correctly classified in their own classes. The confusion matrix of the LDA classifica-tion model is also presented in Supplementary Table7. As it can be seen from this matrix, all samples were correctly classified with a 100% probability.
The spectroscopic region of m/z 90–400 was also used to examine the similarity (or dissimilarity) of the studied oils by means of HCA. This qualitative pattern method was based on creating tree-structured clusters of samples, according to dis-tances between their properties. HCA starts by finding the closest pair of cases and merges them to form a cluster. Until all the cases are in one cluster, the algorithm continues one step at a time, joining pairs of cases, pairs of clusters, or a case with a cluster. These steps are presented as a dendrogram which represents the similarity clustering between samples. The method is defined as hierarchical since once two cases are joined in a cluster they remain joined (Alves et al.2010). The HCA clustering plot (dendrogram) is presented in Fig.6, and the clustering results are summarized in Supplementary Table8. As can be seen from the HCA dendrogram, clusters were formed based on the relationship between binding dis-tances of different brands of edible oils, and it was observed that the types of oil samples successfully differed from each other (Supplementary Table8). Finally, it can be demonstrated that with a combination of direct EI–MS analysis and chemometrics, the edible oils can be clustered with impressive repeatability.
Conclusion
Direct EI–MS fingerprinting in combination with chemomet-ric methods provided a rapid, simple, and accurate way to differentiate among distinct edible oils and verify their authen-ticity. The proposed methodology was successfully applied, not demanding chromatographic separation on the GC–MS instrument nor requiring obligatory mass ion identification. The obtained soft ionized mass spectra were subjected to LDA, PCA, SIMCA, and HCA. LDA models constructed with six predictors and a total of 100% of edible oil samples from different brands were correctly classified. Moreover, no misclassification was reported for the discriminant analysis in supervised SIMCA models with an accuracy of 95%. An ex-cellent correlation between the chemometric modeling studies obtained by mass data and by the GC with flame ionization detection method was obtained. It was demonstrated herein
that the combination of EI–MS with multivariate data analyses provides a promising approach capable to verify the authen-ticity of edible oils. Therefore, the present strategy is experi-mentally simple and demands less than 1 min for its execution and can be extended to incorporate more sample variability and to include other possible authentications.
Funding Information This study is supported financially by the Scientific Research Project Center of Karamanoglu Mehmetbey University (Project number 18-M-18). The authors would like to thank the Scientific Research Project Center of Ankara University and the Scientific and Technological Research Council of Turkey (TUBITAK) (Project number TUBITAK-116Z159) for providing the financial support to use the Unscrambler®X10.4 (CAMO software, Oslo, Norway) pro-gram. The authors would also like to thank TUBITAK under the 2219-Research Fellowship Program for International Postdoctoral for provid-ing the financial support to carry out this research work.
Compliance with Ethical Standards
Conflict of Interest Adnan Kenar declares that he has no further conflict of interest. Burhanettin Çiçek declares that he has no further conflict of interest. Fatma Nur Arslan declares that she has no further conflict of interest. Gönül Akin declares that she has no further conflict of interest. Şükriye Nihan Karuk Elmas declares that she has no further conflict of interest.İbrahim Yilmaz declares that he has no further conflict of interest. Ethical Approval All procedures performed in studies involving human participants were in accordance with the ethical standards of the institu-tional and/or nainstitu-tional research committee and with the 1964 Helsinki Declaration and its later amendments or comparable ethical standards. Informed Consent All subjects involved in the sensory study were pre-liminarily informed about the aim of the research and the nature of the samples, and a signed consent form was collected from each panelist. No personal data were collected or used in any form.
Publisher’s Note Springer Nature remains neutral with regard to jurisdiction-al claims in published maps and institutionjurisdiction-al affiliations.
References
Alves JO, Neto WB, Mitsutake H, Alves PS (2010) Extra virgin (EV) and ordinary (ON) olive oils: distinction and detection of adulteration (EV with ON) as determined by direct infusion electrospray ioniza-tion mass spectrometry and chemometric approaches. Mass Spectrom 24:1875–1880.https://doi.org/10.1002/rcm.4590
Alves JO, Botelho BG, Sena MM, Augusti R (2013) Electrospray ioni-zation mass spectrometry and partial least squares discriminant anal-ysis applied to the quality control of olive oil. J Mass Spectrom 48: 1109–1115.https://doi.org/10.1002/jms.3256
Arslan FN, Sapci AN, Duru F, Kara H (2017) A study on monitoring of frying performance and oxidative stability of cottonseed and palm oil blends in comparison with original oils. Int J Food Prop 20:704– 717.https://doi.org/10.1080/10942912.2016.1177544
Catharino RR, Haddad R, Cabrini LG, Cunha IBS, Sawaya ACHF, Eberlin MN (2005) Characterization of vegetable oils by electrospray ionization mass spectrometry fingerprinting: classifica-tion, quality, adulteraclassifica-tion, and aging. Anal Chem 77:7429–7433
de Melo Milanez KDT, Pontes MJC (2015) Classification of extra virgin olive oil and verification of adulteration using digital images and discriminant analysis. Anal Methods 7:8839–8846https://pubs.rsc. org/en/content/articlehtml/2015/ay/c5ay01765c
De-Hua D, Xu L, Ye Z-H et al (2012) FTIR spectroscopy and chemo-metric class modeling techniques for authentication of Chinese ses-ame oil. J Am Oil Chem Soc 89:1003–1009.https://doi.org/10. 1007/s11746-011-2004-8
Dourtoglou T, Dourtoglou V, Diamadopoulou V, Stavros L (2013) An improved method for the discrimination of oils and fats. Anal Methods 5:546–553https://pubs.rsc.org/en/content/articlehtml/ 2013/ay/c2ay25804h
Dubois V, Breton S, Linder M, Fanni J, Parmentier M (2007) Fatty acid profiles of 80 vegetable oils with regard to their nutritional potential. Eur J Lipid Sci Technol 109:710–732.https://doi.org/10.1002/ejlt. 200700040
Durán I, Domínguez J, Airado D et al (2018) Detection and quantification of extra virgin olive oil adulteration by means of auto fluorescence excitation-emission profiles combined with multi-way classifica-tion. Talanta 178:751–762.https://doi.org/10.1016/j.talanta.2017. 09.095
Eide I, Zahlsen K (2005) A novel method for chemical fingerprinting of oil and petroleum products based on electrospray mass spectrometry and chemometrics. Energy Fuel 19:964–967https://pubs.acs.org/ doi/abs/10.1021/ef049743m
Eide I, Neverdal G, Westad F (2010) Detection of 5 ppm fatty acid methyl ester (FAME) in jet fuel using electrospray ionization mass spec-trometry and chemometrics. Energy Fuel 24:3661–3664https:// pubs.acs.org/doi/abs/10.1021/ef100274c
Fasciotti M, Pereira APN (2010) Optimization and application of methods of triacylglycerol evaluation for characterization of olive oil adulteration by soybean oil with HPLC–APCI-MS–MS. Talanta 81:1116–1125.https://doi.org/10.1016/j.talanta.2010.02.006
Georgouli K, Martinez J, Rincon D, Koidis A (2017) Continuous statis-tical modelling for rapid detection of adulteration of extra virgin olive oil using mid infrared and Raman spectroscopic data. Food Nutr Sci 217:735–742.https://doi.org/10.1016/j.foodchem.2016.09. 011
Goodacre R, Vaidyanathan S, Bianchi G, Kell DB (2002) Metabolic profiling using direct infusion electrospray ionisation mass spec-trometry for the characterisation of olive oils. Analyst 127:1457– 1462https://pubs.rsc.org/en/content/articlehtml/2002/an/b206037j
Gouilleux B, Marchand J, Charrier B, Remaud GS, Giraudeau P (2018) High-throughput authentication of edible oils with benchtop ultra-fast 2D NMR. Food Chem 244:153–158.https://doi.org/10.1016/j. foodchem.2017.10.016
Gouvinhas I, de Almeida JM, Carvalho T et al (2015) Discrimination and characterisation of extra virgin olive oils from three cultivars in different maturation stages using Fourier transform infrared spec-troscopy in tandem with chemometrics. Food Chem 174:226–232.
https://doi.org/10.1016/j.foodchem.2014.11.037
Govinda R, Prates D, Augusti R et al (2010) Electrospray ionization mass spectrometry and multivariate calibration analysis: a combined pro-tocol to quantify biodiesel in blends with petrodiesel. Energy Fuel 24:3183–3188https://pubs.acs.org/doi/abs/10.1021/ef901187m
Kamal-eldin A, Andersson R (1997) A multivariate study of the correla-tion between tocopherol content and fatty acid composicorrela-tion in veg-etable oils. J Am Oil Chem Soc 74:375–380.https://link.springer. com/article/10.1007/s11746-997-0093-1
Kharbach M, Kamal R, Alaoui M et al (2018) Selected-ion flow-tube mass-spectrometry (SIFT-MS) fingerprinting versus chemical pro-filing for geographic traceability of Moroccan Argan oils. Food Chem 263:8–17.https://doi.org/10.1016/j.foodchem.2018.04.059
Kramer JKG, Blackadar CB, Zhou J (2002) Evaluation of two GC col-umns (60-m SUPELCOWAX 10 and 100-m CP Sil 88) for analysis of milkfat with emphasis on CLA, 18 : 1 , 18 : 2 and 18 : 3 isomers,
and short- and long-chain FA. Lipids 37:823–835https://link. springer.com/article/10.1007/s11745-002-0967-2
Luna AS, Arnaldo P, Ferré J, Boqué R (2013) Classification of edible oils and modeling of their physico-chemical properties by chemometric methods using mid-IR spectroscopy. Spectrochim Acta A 100:109– 114.https://doi.org/10.1016/j.saa.2012.06.034
Mendes TO, Rocha RA, Anjos VDC, Bell MJV (2015) Quantification of extra-virgin olive oil adulteration with soybean oil: a comparative study of NIR, MIR, and Raman spectroscopy associated with che-mometric approaches. Food Anal Methods 8:2339–2346https:// link.springer.com/article/10.1007/s12161-015-0121-y
Mottier P, Parisod V, Turesky RJ (2000) Quantitative determination of polycyclic aromatic hydrocarbons in barbecued meat sausages by gas chromatography coupled to mass spectrometry. J Agric Food Chem 48:1160–1166 https://pubs.acs.org/doi/abs/10.1021/ jf991205y
Mu T, Chen S, Zhang Y, Chen H, Guo P (2014) Characterization of edible oils using time-resolved fl uorescence. Anal Methods 6:940–943
https://pubs.rsc.org/en/content/articlehtml/2014/ay/c3ay41552j
Ng T, Li S, Chi C et al (2018) Establishment of a spectral database for classification of edible oils using matrix-assisted laser desorption/ ionization mass spectrometry. Food Chem 252:335–342.https://doi. org/10.1016/j.foodchem.2018.01.125
Pittet A, Périsset A, Oberson J (2004) Trace level determination of acryl-amide in cereal-based foods by gas chromatography– mass spec-trometry. J Chromatogr A 1035:123–130.https://doi.org/10.1016/j. chroma.2004.02.037
Rissato S, Galhiane M, Almeida M et al (2007) Multiresidue determina-tion of pesticides in honey samples by gas chromatography– mass spectrometry and application in environmental contamination. Food Chem 101:1719–1726.https://doi.org/10.1016/j.foodchem.2005. 10.034
Roessner U, Wagner C, Kopka J, Trethewey RN, Willmitzer L (2000) Simultaneous analysis of metabolites in potato tuber by gas chroma-tography mass spectrometry. Plant J 23:131–142.https://doi.org/10. 1046/j.1365-313x.2000.00774.x
Saniİ, Makuc D, Erta E et al (2018) Characterisation of the Turkish and Slovenian extra virgin olive oils by chemometric analysis of the presaturation 1 H NMR spectra. LWT Food Sci Technol 92:10–15.
https://doi.org/10.1016/j.lwt.2018.02.015
Savitzky A, Golay MJE (1964) Smoothing and differentiation of data by simplified least squares procedures. Anal Chem 36:1627–1639
https://pubs.acs.org/doi/pdf/10.1021/ac60214a047
Tan J, Li R, Jiang Z et al (2017) Synchronous front-face fluorescence spectroscopy for authentication of the adulteration of edible vegeta-ble oil with refined used frying oil. Food Chem 217:274–280.
https://doi.org/10.1016/j.foodchem.2016.08.053
Teresa M, Koidis A, Jim AM, Gonz A (2017) Chemometric classification and quantification of olive oil in blends with any edible vegetable oils using FTIR-ATR and Raman spectroscopy. LWT Food Sci Technol 86:174–184.https://doi.org/10.1016/j.lwt.2017.07.050
Thurnhofer S, Vetter W (2005) A gas chromatography / electron ioniza-tion− mass spectrometry − selected ion monitoring method for determining the fatty acid pattern in food after formation of fatty acid methyl esters. J Agric Food Chem 53:8896–8903https://pubs. acs.org/doi/abs/10.1021/jf051468u
Tu A, Du Z, Qu S (2016) Rapid profiling of triacylglycerols for identify-ing authenticity of edible oils usidentify-ing supercritical fluid chromatography-quadruple time-of-flight mass spectrometry com-bined with chemometric tools. Anal Methods 8:4226–4238https:// pubs.rsc.org/en/content/articlehtml/2016/ay/c6ay00970k
Uncu O, Ozen B (2016) Geographical differentiation of a monovarietal olive oil using various chemical parameters and mid-infrared spec-troscopy. Anal Methods 8:4872–4880https://pubs.rsc.org/en/ content/articlehtml/2016/ay/c6ay01290f
Vaclavik L, Hrbek V, Cajka T, Rohlik BA, Pipek P, Hajslova J (2011) Authentication of animal fats using direct analysis in real time (DART) ionization-mass spectrometry and chemometric tools. J Agric Food Chem 59:5919–5926https://pubs.acs.org/doi/abs/10. 1021/jf200734x
Vichi S, Isabel A, Pizzale L et al (2003) Analysis of virgin olive oil volatile compounds by headspace solid-phase microextraction coupled to gas chromatography with mass spectrometric and flame ionization detection. J Chromatogr A 983:19–33.https://doi.org/10. 1016/S0021-9673(02)01691-6
Wu Z, Rodgers R, Marshall A (2004) Characterization of vegetable oils: detailed compositional fingerprints derived from electrospray ioni-zation Fourier transform ion cyclotron resonance mass spectrometry. J Agric Food Chem 52:5322–5328https://pubs.acs.org/doi/abs/10. 1021/jf049596q
Yang H, Irudayaraj J (2001) Comparison of near-infrared, Fourier trans-form-infrared, and Fourier transform-Raman methods for
determining olive pomace oil adulteration in extra virgin olive oil. J Am Oil Chem Soc 78:889–895. https://doi.org/10.1007/s11746-001-0360-6
Yang Y, Ferro MD, Cavaco I, Liang Y (2013) Detection and identification of extra virgin olive oil adulteration by GC-MS combined with chemometrics. J Agric Food Chem 61:3693–3702https://pubs.acs. org/doi/abs/10.1021/jf4000538
Yildiz Tiryaki G, Ayvaz H (2017) Quantification of soybean oil adulter-ation in extra virgin olive oil using portable Raman spectroscopy. Food Meas Charact 11:523–529https://link.springer.com/article/10. 1007/s11694-016-9419-8
Zambiazi RC, Przybylski R, Zambiazi MW, Mendonça CB (2007) Fatty acid composition of vegetable oils and fats. Curitiba 25:111–120.
https://doi.org/10.5380/cep.v25i1.8399
Zhang Y, Zhao Y, Shen G, Zhong S, Feng J (2018) NMR spectroscopy in conjugation with multivariate statistical analysis for distinguishing plant origin of edible oils. J Food Compos Anal 69:140–148.https:// doi.org/10.1016/j.jfca.2018.03.006