An Investigation of Factors Affecting City Life Satisfaction and an Index Proposal
*Veysel YILMAZ** Erkan ARI***
Geliş Tarihi (Received): 14.11.2017– Kabul Tarihi (Accepted):12.02.2018 Abstract
The role of universities in city branding is critical, and it is undeniable that universities make economic, cultural and social contributions to the cities in which they are located, especially in underdeveloped and developing countries. The purpose of this study is to investigate the city life satisfaction levels of university students enrolled in two provinces in Turkey. Within the scope of the study, the City Life Satisfaction Questionnaire for University Students was applied to 320 students enrolled in various departments of Osmangazi University in Eskişehir and 413 students at Dumlupınar University Kütahya between September 30 and December 30, 2016. The study made use of a Structural Equation Modeling (SEM) method for the analysis of the data, and the City Life Satisfaction Index (CLSI) was also calculated within the context of the study.
It was found that all factors considered in the study affect city life satisfaction, a CLSI values of 65 percent was found for Eskişehir, compared to 36 percent for Kütahya. While determining the factors influential on city life satisfaction, the factors used in the Better Life Index (BLI) by OECD were considered.
Keywords: Life Satisfaction, Brand City, University Student, City Life Satisfaction Index, Structural Equation modeling (SEM)
* Part of this work was presented "2nd International conference on economics business management and social
sciences”, Page160, May 10 – 14, 2017 Belgrade.
** Prof.Dr., Eskişehir Osmangazi Üniversitesi Fen Fakültesi İstatistik Bölümü, [email protected]
***Dr. Öğr. Üyesi., Dumlupınar, Üniversitesi İktisadi ve İdari Bilimler Fakültesi, Ekonometri Bölümü
[email protected] (Corresponding Author)
26
Şehir Yaşam Memnuniyetini Etkileyen Faktörlerin Araştırılması ve Bir İndeks
Önerisi
Öz
Üniversiteler şehirlerin markalaşmasında kritik öneme sahiptir. Üniversitelerin bulundukları şehirlere, özellikle de az gelişmiş ve gelişmekte olan ülkelerde ekonomik, kültürel ve sosyal katkılar yapabileceği kesinlikle inkar edilemez bir gerçektir. Bu araştırmanın amacı, Türkiye'nin iki ilinde öğrenim gören üniversite öğrencilerinin şehir yaşam memnuniyet düzeylerini araştırmaktır. Çalışma kapsamında 30 Eylül-30 Aralık 2016 tarihleri arasında Eskişehir Osmangazi Üniversitesi çeşitli bölümlerinde öğrenim gören 320 öğrenciye ve Kütahya Dumlupınar Üniversitesi'nde 413 öğrenciye Üniversite Öğrencileri için Şehir Yaşamı Memnuniyet Anketi uygulanmıştır. Bu çalışmada, verilerin analizinde Yapısal Eşitlik Modellemesi (YEM) kullanılmıştır.
Yapılan analiz sonucunda, çalışmada ele alınan tüm faktörlerin şehir yaşam memnuniyetini etkilediği tespit edilmiştir. Çalışmada ayrıca Şehir Yaşamı Memnuniyet Endeksi (CLSI) de hesaplanmıştır. CLSI değeri Eskişehir için% 65, Kütahya için% 36 olarak belirlenmiştir. Şehir yaşamı memnuniyetinde etkili olan faktörleri belirlerken, OECD tarafından Better Life Index (BLI) 'da kullanılan faktörler göz önüne alınmıştır.
Anahtar Kelimeler: Yaşam Memnuniyeti, Marka Şehir, Üniversite Öğrencisi, Şehir Yaşam Memnuniyeti İndeksi, Yapısal Eşitlik Modeli
27
Introduction
There are many studies in the literature suggesting that city branding cannot be considered independently of the people of the city (citizens, university students, tourists), and others defending this idea in a rather theoretical framework (Braun et al., 2010; Ashworth and Voogd, 1990; Braun 2008; Braun and Zenker, 2010). Accordingly, this study investigates the factors that are influential in the satisfaction of university students with the city in which they live, with the aim being to come up with strategies for local governments and municipalities related to urban planning with the aim of increasing the appeal of Eskişehir and Kütahya among university students, and their significance and competitive power in the utilization of the economic advantages of these cities. To this end, the study determines the dimensions affecting quality of life in the city and the satisfaction levels of university students, making use of a scale developed specifically for university students. In addition, the City Life Satisfaction Index was calculated for students enrolled in both universities, and a measurement tool was proposed to compare the life satisfaction levels of the two cities.
The aim of the study is to describe the factors affecting the satisfaction levels of university students in Eskişehir and Kütahya using a SEM. Eskişehir is a Central Anatolian city with a population of 750,000 that is home to two universities. Eskişehir has been bestowed with the titles “Culture Capital of the Turkish World” and “UNESCO Intangible Cultural Heritage Capital” in 2013, and is a culturally and artistically developed city with art institutions and other such facilities. Kütahya is a neighboring city in Central-Western Anatolia that lies around 80 km southwest of Eskişehir. It has a population of 248,054 and one university, and has tourism potential based on its recently developing industry, its rich underground and overground resources, its handicrafts, and its thermal resorts. Famous for its ceramic tiles, Kütahya is home to the first and only ceramic tile museum in Europe and the world.
In the following sections of this study, there are literature review, research model and hypotheses, the data collection tool, findings and finally section includes a conclusion on the results of the study in comparison to those in similar studies in the literature, and recommendations for future studies.
1. Literature Review
The image of a city is based primarily to the satisfaction levels of its citizens, and so it becomes very important to investigate the levels of satisfaction of, and loyalty to, life in the city among university students, who can be considered long-term guests of cities. In underdeveloped and developing cities, where urbanization is not yet complete, the expenditures of university students and the demand for accommodation, services, infrastructure and socio-cultural activities lead to the emergence of a different organizational system within a city, as well as vitality in the economy (Zenker et al., 2013; Noni et al., 2014).
The attitudes of residents and university students towards the city in which they live are significant in defining the branding of a city and its capacity of attraction (Noni et al., 2014). Kavaratzis
28
and Ashworth (2006) claim that the harmony between the brand and the personality of the individual is a reflection of their personalities and brands. Nevertheless, many personality traits may also be characterized for brands and marketed according to their suitability to the needs of the individual. According to Kotler and Gertner (2002), in order for a city to be marketed, the administration of the city must first satisfy the needs of the target audience, and in satisfying these needs, new investors and firms may be effected through increases in tourism income, improvements in quality of life and rises in satisfaction levels. Braun (2008) defines the branding of a city as the usage of marketing tools in an integrated way to improve the advantages provided by the city to its citizens and the general public, and to come up with new advantages. Likewise, the city brand is also seen as a visual, verbal and behavioral expression of the city in the mind of the individual (Braun et al., 2010).
There are a few factors that affect urban brand attitudes (Merrilees, Miller and Herington, 2009) that can be categorized under the headings of economic, social, medical, safety, education, environment, tourism and culture among the users of cities, who include university students (Darchen and Tremblay, 2010; Zenker, 2009), settled citizens (Braun, Kavaratzis and Zenker, 2010), tourists (De Carlo, Canali, Pritchard and Morgan, 2009), companies, entrepreneurs and investors (Yusuf and Nabeshima, 2005). The effort spent by cities on branding is significant in terms of increasing the satisfaction of its citizens and the university students who live in the city, as well as the quality of the perceived brand (Rainisto, 2003; Kavaratzis, 2005).
Darchen and Tremblay (2010) determined the most influential factors in keeping/attracting students to the city as: university quality, work quality, quality of life (social prosperity, urban safety, quality of the urban environment, quality of university), quality of public transportation, lifestyle (access to cultural and social activities) and level of tolerance (ethnic and cultural diversity). Zenker et al. (2010) stated that the quality of a city is dependent on its placement in the minds of the people, and claims that how it is perceived may be related to the different perspectives and interests of the various actors. Rainisto (2003) explained urban development under three main titles: community service development; urban design and planning; and economic development. Insch (2010), on the other hand, defined four main factors that influence the satisfaction of the city among its citizens, being: work/life balance; safety; the natural environment; and the communication assets of the city. Santos, Martins and Brito (2007) measured satisfaction with a city in terms of quality of life, including such factors as health, education, social activities, inner city safety, urbanization, city civic engagement, accommodation, environment, vibrancy, culture, sports and entertainment, population, railways, and access to trade and services for poverty. García, Gómez and Molina (2012) defined socio-economic infrastructure, environment and safety, and national and cultural resources as influential in urban branding and in the establishment of a city image. Zenker (2009) asserted that talented individuals do not concern themselves with employment opportunities or economic incentives while choosing where to live, but instead consider the social, democratic, educational and cultural characteristics of the city.
29
Arslan and Akkaş (2014) tested a model that was used measure the satisfaction of college life and to evaluate the overall impact of the quality of college life (social, academic, and service satisfaction), life satisfaction, and identification. The study further assessed the impact of a university’s academic program, social life, facilities and services on the quality of life of students, and compared the findings with those of similar studies from Turkey and other countries. The measurement tools adopted in the study included the quality of college life satisfaction (QCL), and the results identified social satisfaction as having the strongest positive impact on QCL
The role of universities in city branding is critical, as it is undeniable that they make many economic, cultural and social contributions to the cities in which they are located, especially in underdeveloped and developing countries. University students are some of the most fundamental factors in this, and so investigating their levels of satisfaction from and loyalty for the city in which they are studying is imperative.
The study continues with a description of the data collection tool, followed by details of the empirical study and its results. The study concludes with a discussion of the results, which are compared with those of similar studies in the literature, and puts forward recommendations for future studies.
2. Research Model and Hypotheses
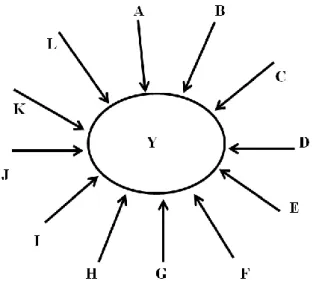
In the study, the model in Figure 1 was proposed to demonstrate the relationship among the factors that are influential in city life satisfaction among university students.
Fig. 1. Research model on city life satisfaction for university student
A: Safety; B: Housing; C: Jobs; D: Education; E: Civil Engagement; F: Culture/Art; G: Public Transport; H: Pedestrian Movement; I: Local government; J: Loyalty to the City; K: Neighbor Relations; L: Environment; Y: Urban Life Satisfaction
Previous literature shows that there are numerous variables that are influential on city life satisfaction, and it is possible to find many studies analyzing the effects of, in particular, variables such as safety, housing, jobs and education on quality of life (Darchen and Trebmblay, 2010; Rentfrow et al.,
30
2009; Santos, Martins and Brito, 2007; Merrilees et al., 2009). Some of the hypotheses formed in the study, considering the variables used in previous studies, are as follows:
𝐻1: A relationship exists between the satisfaction of the students in their lives in the city and the safety/security services provided by the city.
𝐻2: Accommodation is influential in the life satisfaction of students in the city. 𝐻3: Work opportunities in the city are associated the city life satisfaction of students.
𝐻4 : The education opportunities provided by the city are associated with the city life satisfaction of students.
In their studies, Zenker (2009) and Rentfrow et al. (2009) found that climate of civic engagement affects the prosperity levels of people, and is an important criterion among people when selecting a city in which to reside. It was thus considered that the variable of civic engagement would be influential on quality of life, and so the following hypothesis was formed:
𝐻5 : The democratic environment in a city is influential to the life satisfaction of students living in the city.
Noni et al. (2014); Darchen and Tremblay (2010) and Merrilees et al. (2009) showed in their studies that culture/art opportunities, diversity and the comfort of public transport are effective on city life satisfaction. Accordingly, the following hypotheses were used to investigate the effects of these variables in this study. There were few studies found in literature investigating the ease of pedestrian movement, and so this variable was used to form another hypothesis for the study.
𝐻6: The life satisfaction of students in the city is related to their access to culture/art in the city. 𝐻7: The satisfaction of students with city life is related to the public transport provided by the city.
𝐻8: The ease of pedestrian movement in the city is related the city life satisfaction of the students. Noni et al., (2014); Zenker et al., (2013); Rainisto (2003); García, Gómez and Molina (2012) have shown that local governments, municipalities and the environment (parks, walking areas, sports facilities, etc.) are influential life satisfaction, while Marans W. (2003), Diener and Suh (1997) and Angner (2010) have reported that neighbor relations in the city affect life satisfaction. Few studies were found in literature investigating loyalty (suggesting the city and the university to entourage), however this variable was added to the model, as it was considered to be influential. The following hypotheses were formed based on the findings in literature:
𝐻9: A relationship exists between the city life satisfaction of students and the services provided by local government.
𝐻10: Loyalty to the city is associated with the city life satisfaction of students.
𝐻11: Neighbor relations within the city are related the city life satisfaction of students.
31
3. Methodology
3.1. Data collectionThe City Life Satisfaction Questionnaire for University Students was applied to 320 students enrolled in various departments of Osmangazi University in Eskişehir and 413 students studying at Dumlupınar University in Kütahya between September 30 and December 1, 2016. The study sample was assembled using a stratified sampling method, based on proportional distribution. The first part of the data collection tool contained questions aimed at garnering information on the demographic characteristics of the students (sex, marital status, age, accommodation, length of time in the city), while the second part included 65 statements aimed at measuring the satisfaction of students in the city in which they are studying based on a 10-point Likert-type scale (1: not satisfied at all–10: very satisfied). When determining the factors that influence city life satisfaction for the study, six of the variables included in the OECD’s Better Life Index (BLI) were included also in the present study, including both objective and subjective issues, being Housing, Jobs, Education, Environment (quality of the environment), Civic Engagement and Safety. In addition to these variables, six other variables not in the BLI were added to the scale, being Culture/Art, Public Transport, Local Government and Neighbor Relations, after a review of relevant literature (Bonouita et al., 2013; Zenker et al., 2010; Rentfrow et al., 2009; Lee, 2008; Santos, Martins and Brito, 2007; Marans W., 2003). The literature review of studies of life satisfaction revealed few studies investigating the variables of Pedestrian Movement and Loyalty to the City, but these factors were included in the study nonetheless, since it was considered that they could be influential.
3.2. Reliability and validity
The statistical analysis began with a calculation of Cronbach’s alpha values, aimed at measuring the internal validity coefficient of the data collection tool, in which values of 0.96 and 0.97 were calculated for the students of Eskişehir and Kütahya, respectively. Estimations on the composite reliability of potential factors and variance measurements are needed to analyze whether or not the observed variables defined under the potential variables explain the related structures. Hair et al. (1998) reported that the estimation for the explained variance measurement must be over 0.50 if the reliability of a scale is to be proven. Tables 6 and 8 show the composite reliability and explained rates of variance for dimensions in the measurement tool. Considering these values, the values of the Average Variance Extracted (AVE) for the variables of safety, jobs, democratic climate and public transport were found to be lower than 0.5; however, Fornell and Larcker (1981) reported that in cases where the Composite Reliability (CR) value for every structure is higher than 0.6, AVE values lower than 0.5 are acceptable, and the construct reliability is sufficient (Huang et al., 2013). Therefore, based on the convergent validity of the study, it was observed that the CR and Cronbach’s alpha (CA) values were 0.61 or over; four of
32
the AVE coefficients were between 0.44 and 0.50, and the others were higher than 0.50 (Tables 6, 8). Accordingly, convergent validity was achieved.
To achieve the discriminant validity of the model, a comparison is made of the square roots of the AVE value of each structure, and the correlations between that structure and other structures. If the square root of the AVE value is larger in the comparison, discriminant validity is achieved (Fornell and Larcker, 1981). As shown in Appendix A, the square root of AVE was higher than the correlation for all structures, meaning that discriminant validity was achieved.
In addition, a multiple group confirmatory factor analysis was conducted in the study to allow the simultaneous testing of the equality of the structural parameters for more than one group. The analysis identified no meaningful difference in the factor weights either within or between the groups, and the criteria for the goodness of fit of the model reflects an acceptable fit. It can thus be concluded that this scale presents a city life satisfaction measurement model for all student samples, and that can also be applied in other cities.
3.3. Test of multivariate normality
A test of multivariate normality was conducted to determine whether or not the variables in the study had a multivariate normal discrimination. Tables 3 and 4 present the results of this test.
Table 3. Test of multivariate normality for Eskişehir
Skewness Kurtosis Skewness and Kurtosis Value Z-Score P-Value Value Z-Score P-Value Chi-Square P-Value 378.8 52 p< 0.01 1958.4 22.9 p<0.01 3236.5 p<0.01
It can be seen in Tables 3 and 4 that the data is not in compliance with multivariate normality in terms of both skewness and kurtosis (𝑝 < 0.01). Therefore, the study used the Robust maximum likelihood (Robust ML) method, which does not require an assumption of normal distribution in the calculation of parameter estimations. For the analysis of the asymptotic covariance matrix and the general adaptability of the model, it is suitable to use the Satorra-Bentler scaled χ2.
Table 4. Test of multivariate normality for Kütahya
Skewness Kurtosis Skewness and Kurtosis Value Z-Score P-Value Value Z-Score P-Value Chi-Square P-Value 324.1 55.3 p< 0.01 1813.5 24.6 p< 0.01 3672.4 p<0.01
33
4. Findings
4.1. Demographic profile of Eskisehir Osmangazi University (ESOGU) students
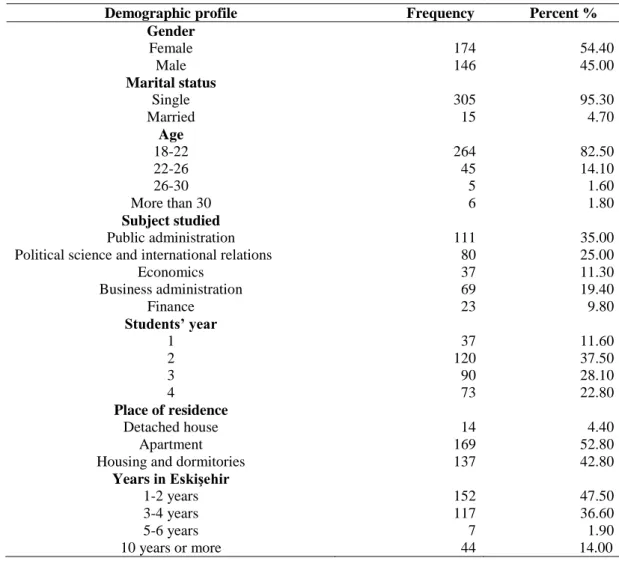
The demographic profiles of the Eskişehir Osmangazi University students were presented in Table 1.
Table 1. Demographic profile of Eskisehir Osmangazi University (ESOGU) students
Demographic profile Frequency Percent %
Gender Female 174 54.40 Male 146 45.00 Marital status Single 305 95.30 Married 15 4.70 Age 18-22 264 82.50 22-26 45 14.10 26-30 5 1.60 More than 30 6 1.80 Subject studied Public administration 111 35.00
Political science and international relations 80 25.00
Economics 37 11.30 Business administration 69 19.40 Finance 23 9.80 Students’ year 1 37 11.60 2 120 37.50 3 90 28.10 4 73 22.80 Place of residence Detached house 14 4.40 Apartment 169 52.80
Housing and dormitories 137 42.80
Years in Eskişehir
1-2 years 152 47.50
3-4 years 117 36.60
5-6 years 7 1.90
34
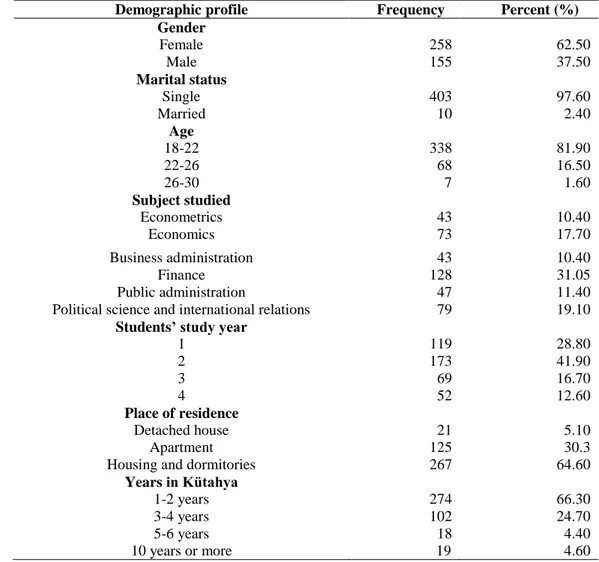
4.2. Demographic profile of Dumlupınar University (DPU) students
The demographic profiles of Dumlupınar University students are presented in Table 2.
Table 2. Demographic profile of Dumlupınar University (DPU) students
Demographic profile Frequency Percent (%)
Gender Female 258 62.50 Male 155 37.50 Marital status Single 403 97.60 Married 10 2.40 Age 18-22 338 81.90 22-26 68 16.50 26-30 7 1.60 Subject studied Econometrics 43 10.40 Economics 73 17.70 Business administration 43 10.40 Finance 128 31.05 Public administration 47 11.40
Political science and international relations 79 19.10
Students’ study year
1 119 28.80 2 173 41.90 3 69 16.70 4 52 12.60 Place of residence Detached house 21 5.10 Apartment 125 30.3
Housing and dormitories 267 64.60
Years in Kütahya
1-2 years 274 66.30
3-4 years 102 24.70
5-6 years 18 4.40
10 years or more 19 4.60
4.3. SEM analyses and goodness of fit test for Eskişehir
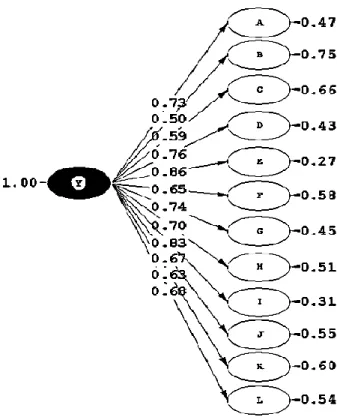
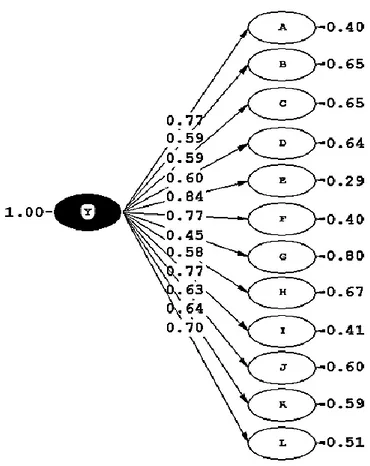
Figure 2 shows the path diagram obtained for the second-order confirmatory factor model proposed in the study, and Table 3 shows the results.
35
Chi-Square=829.40, df=582, P<0.001, RMSEA=0.037
A: Safety; B: Housing; C: Jobs; D: Education; E: Civic Engagement; F: Culture/Art; G: Public Transport; H: Pedestrian Movement; I: Local government; J: Loyalty to the city; K: Neighbor relations; L: Environment; Y: City life satisfaction
Fig.2. Second order confirmatory factor analysis for Eskişehir life satisfaction
The goodness of fit test for the Structural Model is given in Table 5.
Table 5. Goodness of fit test for the Structural Model
Fit test Good fit Acceptable fit Structural Model
NFI 0.95≤ 𝑁𝐹𝐼 ≤ 1 0.90≤ 𝑁𝐹𝐼 ≤ 0.95 0.96 NNFI 0.97≤ 𝑁𝑁𝐹𝐼 ≤ 1 0.95≤ 𝑁𝑁𝐹𝐼 ≤ 0.97 0.99 CFI 0,95≤ 𝐶𝐹𝐼 ≤ 1 0.90≤ 𝐶𝐹𝐼 ≤ 0.95 0.99 GFI 0.95≤ 𝐺𝐹𝐼 ≤ 1 0.90≤ 𝐺𝐹𝐼 ≤ 0.95 0.84 IFI 0.95≤ 𝐼𝐹𝐼 ≤ 1 0.90≤ 𝐼𝐹𝐼 ≤ 0.95 0.99 RFI 0.95≤ 𝐼𝐹𝐼 ≤ 1 0.90≤ 𝐼𝐹𝐼 ≤ 0.95 0.96 RMSEA 0≤ 𝑅𝑀𝑆𝐸𝐴 ≤ 0.05 0.05≤ 𝑅𝑀𝑆𝐸𝐴 ≤ 0.08 0.037 SRMR 0≤ 𝑆𝑅𝑀𝑅 ≤ 0.05 0.05≤ 𝑆𝑅𝑀𝑅 ≤ 0.08 0.06 𝜒2⁄ 𝑑𝑓 0≤ 𝜒2⁄𝑑𝑓≤ 2 2≤ 𝜒2⁄𝑑𝑓≤ 3 1.42
In the final model for Eskişehir, χ2=829.40 (df= 582, p<0.01) was computed. The χ2/df ratio was 1.42, which indicated a good model fit, falling between 0 and 2 (Hair et al., 2006; Shook et al., 2004). The fit measures of the model are calculated as RMSEA=0.037 (Root-mean-square error approximation), SRMR=0.060 (Standardized Root Mean Square Residual), NFI=0.96 (Normed Fit Index), NNFI=0.99 (Non-Normed Fit Index), IFI=0.99 (Incremental Fit Index), RFI=0.96 (Relative Fit Index) CFI=0.99 (Comparative Fit Index), GFI=0.84 (Goodness-of-fit), CAIC (Consistent Akaike
36
Information Criterion)-model=1397.94<saturated model CAI=4507.70 and ECVI (Expected Cross-Validation Index) -model=3.13<saturated model EVCI=4.18. An RMSEA and SRMR value that is equal to or lower than 0.05 reflects a perfect fit, values under 0.10 indicate an acceptable fit and those above 0.10 indicate a bad fit. Other fitness criteria are in the 0–1 range, with closeness to 1 denoting a better fit of the model. CAIC and ECVI are compared with the corresponding values of the saturated models, and if they are small, the model is deemed to be appropriate (Byrne, 1998; Jöreskog and Sörbom, 2002). When all of the fitness criteria are considered, it is evident that our proposed model is valid.
37
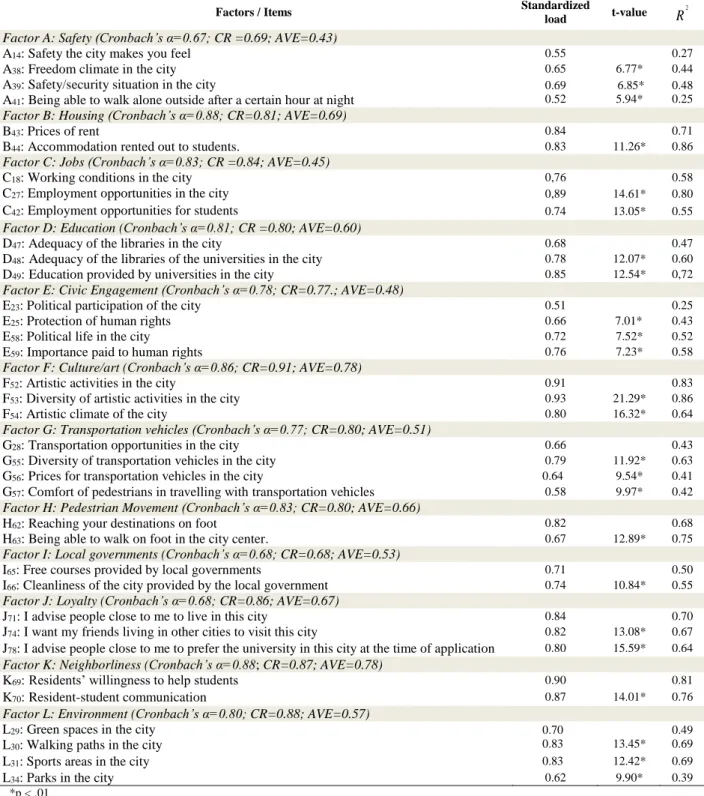
Table 6. Constructs load of second order confirmatory factor model for Eskişehir
Factors / Items Standardized
load t-value
2
R
Factor A: Safety (Cronbach’s α=0.67; CR =0.69; AVE=0.43)
A14: Safety the city makes you feel 0.55 0.27
A38: Freedom climate in the city 0.65 6.77* 0.44
A39: Safety/security situation in the city
A41: Being able to walk alone outside after a certain hour at night
0.69 0.52 6.85* 5.94* 0.48 0.25
Factor B: Housing (Cronbach’s α=0.88; CR=0.81; AVE=0.69)
B43: Prices of rent 0.84 0.71
B44: Accommodation rented out to students. 0.83 11.26* 0.86
Factor C: Jobs (Cronbach’s α=0.83; CR =0.84; AVE=0.45)
C18: Working conditions in the city 0,76 0.58
C27: Employment opportunities in the city 0,89 14.61* 0.80
C42: Employment opportunities for students 0.74 13.05* 0.55
Factor D: Education (Cronbach’s α=0.81; CR =0.80; AVE=0.60)
D47: Adequacy of the libraries in the city 0.68 0.47
D48:Adequacy of the libraries of the universities in the city 0.78 12.07* 0.60 D49:Education provided by universities in the city 0.85 12.54* 0,72
Factor E: Civic Engagement (Cronbach’s α=0.78; CR=0.77.; AVE=0.48)
E23: Political participation of the city 0.51 0.25
E25: Protection of human rights 0.66 7.01* 0.43
E58: Political life in the city 0.72 7.52* 0.52
E59: Importance paid to human rights 0.76 7.23* 0.58
Factor F: Culture/art (Cronbach’s α=0.86; CR=0.91; AVE=0.78)
F52: Artistic activities in the city 0.91 0.83
F53: Diversity of artistic activities in the city 0.93 21.29* 0.86
F54: Artistic climate of the city 0.80 16.32* 0.64
Factor G: Transportation vehicles (Cronbach’s α=0.77; CR=0.80; AVE=0.51)
G28: Transportation opportunities in the city 0.66 0.43
G55: Diversity of transportation vehicles in the city 0.79 11.92* 0.63 G56: Prices for transportation vehicles in the city 0.64 9.54* 0.41 G57: Comfort of pedestrians in travelling with transportation vehicles 0.58 9.97* 0.42
Factor H: Pedestrian Movement (Cronbach’s α=0.83; CR=0.80; AVE=0.66)
H62: Reaching your destinations on foot 0.82 0.68
H63: Being able to walk on foot in the city center. 0.67 12.89* 0.75
Factor I: Local governments (Cronbach’s α=0.68; CR=0.68; AVE=0.53)
I65: Free courses provided by local governments 0.71 0.50
I66: Cleanliness of the city provided by the local government 0.74 10.84* 0.55
Factor J: Loyalty (Cronbach’s α=0.68; CR=0.86; AVE=0.67)
J71: I advise people close to me to live in this city 0.84 0.70 J74: I want my friends living in other cities to visit this city 0.82 13.08* 0.67 J78: I advise people close to me to prefer the university in this city at the time of application 0.80 15.59* 0.64
Factor K: Neighborliness (Cronbach’s α=0.88; CR=0.87; AVE=0.78)
K69:Residents’ willingness to help students 0.90 0.81
K70:Resident-student communication 0.87 14.01* 0.76
Factor L: Environment (Cronbach’s α=0.80; CR=0.88; AVE=0.57)
L29: Green spaces in the city L30: Walking paths in the city
0.70
0.83 13.45* 0.49 0.69
L31: Sports areas in the city 0.83 12.42* 0.69
L34: Parks in the city 0.62 9.90* 0.39
*p < .01
Looking at Figure 2 and Table 5, it may be seen that all factors affected the urban life satisfaction significantly (𝑝 < 0.01).The independent latent variable which affected the city life satisfaction the most was E (civic engagement) and the magnitude of this effect was 0.86 (𝑝 < 0.01). A one unit increase in the democratic climate provided by the city will increase the city life satisfaction of the students by 0.86 units. The civic engagement variable was followed in order by I (local governments), D (education opportunities) and G (transportation vehicles), while the magnitude of the effects of these variables were respectively 0.83 (𝑝 < 0.01); 0.76 (𝑝 < 0.01) and 0.74 (𝑝 < 0.01). These results suggest that increase
38
in the democratic climate, services related to local governments, education opportunities and transportation vehicles in the city the students are living in, while increase their city life satisfaction. A similar situation is also valid for other variables.
4.4. SEM analyses and goodness of fit test for Kütahya
Figure 3 shows the path diagram obtained for the second order confirmatory factor model proposed in the study, and Table 6 shows the results.
Chi-Square=950.40, df=582, P<0.001, RMSEA=0.043
A: Safety; B: Accommodation; C: Work; D: Education; E: Civic Engagement; F: Culture/Art; G: Transportation vehicles; H: Pedestrian Movement; I: Local governments; J: Loyalty to the city; K: Neighbor relations; L: Environment; Y: City life satisfaction
39
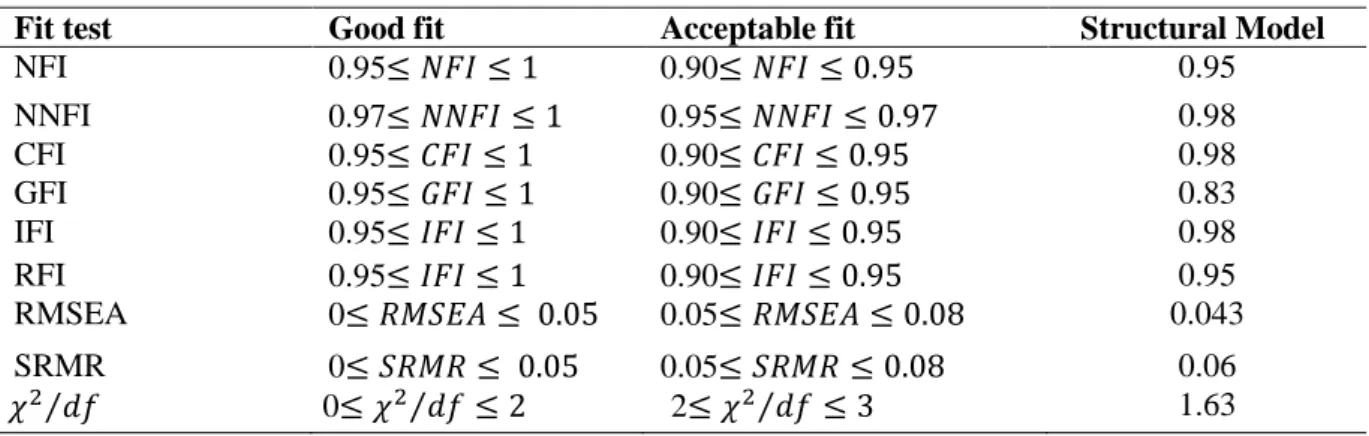
Goodness of fit test for Structural Model is given in Table 7.Table 7. Goodness of fit test for Structural Model
Fit test Good fit Acceptable fit Structural Model
NFI 0.95≤ 𝑁𝐹𝐼 ≤ 1 0.90≤ 𝑁𝐹𝐼 ≤ 0.95 0.95 NNFI 0.97≤ 𝑁𝑁𝐹𝐼 ≤ 1 0.95≤ 𝑁𝑁𝐹𝐼 ≤ 0.97 0.98 CFI 0.95≤ 𝐶𝐹𝐼 ≤ 1 0.90≤ 𝐶𝐹𝐼 ≤ 0.95 0.98 GFI 0.95≤ 𝐺𝐹𝐼 ≤ 1 0.90≤ 𝐺𝐹𝐼 ≤ 0.95 0.83 IFI 0.95≤ 𝐼𝐹𝐼 ≤ 1 0.90≤ 𝐼𝐹𝐼 ≤ 0.95 0.98 RFI 0.95≤ 𝐼𝐹𝐼 ≤ 1 0.90≤ 𝐼𝐹𝐼 ≤ 0.95 0.95 RMSEA 0≤ 𝑅𝑀𝑆𝐸𝐴 ≤ 0.05 0.05≤ 𝑅𝑀𝑆𝐸𝐴 ≤ 0.08 0.043 SRMR 0≤ 𝑆𝑅𝑀𝑅 ≤ 0.05 0.05≤ 𝑆𝑅𝑀𝑅 ≤ 0.08 0.06 𝜒2⁄ 𝑑𝑓 0≤ 𝜒2⁄𝑑𝑓≤ 2 2≤ 𝜒2⁄𝑑𝑓≤ 3 1.63
In the final model for Kütahya, χ2=950.85 (df= 582, p<0.01) was computed. The χ2 /df ratios were 1.63, which indicated good model fits because the ratio falls between 0 and 2. Fit measures of model are calculated as RMSEA=0.043, SRMR = 0.062, NFI= 0.95, NNFI= 0.98, IFI = 0.98, RFI = 0.95, CFI=0.98 and GFI= 0.83, CAIC model=1526.67<saturated model CAIC =4565.48 and ECVI -model= 3.22<saturated model EVCI= 3.83. When all fitness criteria are considered, it is valid that our proposed model is valid.
40
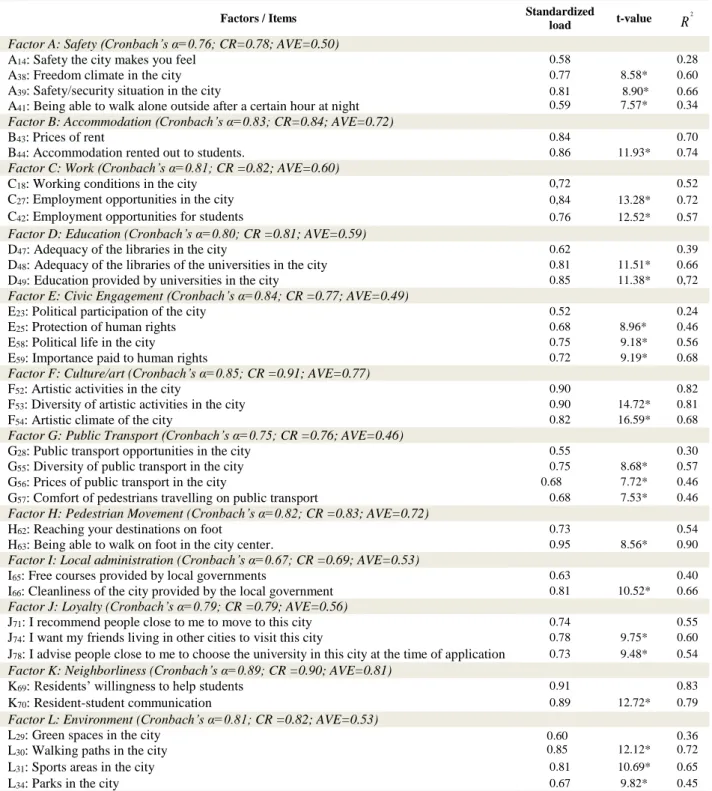
Table 8. Constructs load of second order confirmatory factor model for Kütahya
Factors / Items Standardized
load t-value
2
R
Factor A: Safety (Cronbach’s α=0.76; CR=0.78; AVE=0.50)
A14: Safety the city makes you feel 0.58 0.28
A38: Freedom climate in the city 0.77 8.58* 0.60
A39: Safety/security situation in the city
A41: Being able to walk alone outside after a certain hour at night
0.81 0.59 8.90* 7.57* 0.66 0.34
Factor B: Accommodation (Cronbach’s α=0.83; CR=0.84; AVE=0.72)
B43: Prices of rent 0.84 0.70
B44: Accommodation rented out to students. 0.86 11.93* 0.74
Factor C: Work (Cronbach’s α=0.81; CR =0.82; AVE=0.60)
C18: Working conditions in the city 0,72 0.52
C27: Employment opportunities in the city 0,84 13.28* 0.72
C42: Employment opportunities for students 0.76 12.52* 0.57
Factor D: Education (Cronbach’s α=0.80; CR =0.81; AVE=0.59)
D47: Adequacy of the libraries in the city 0.62 0.39
D48:Adequacy of the libraries of the universities in the city 0.81 11.51* 0.66 D49:Education provided by universities in the city 0.85 11.38* 0,72
Factor E: Civic Engagement (Cronbach’s α=0.84; CR =0.77; AVE=0.49)
E23: Political participation of the city 0.52 0.24
E25: Protection of human rights 0.68 8.96* 0.46
E58: Political life in the city 0.75 9.18* 0.56
E59: Importance paid to human rights 0.72 9.19* 0.68
Factor F: Culture/art (Cronbach’s α=0.85; CR =0.91; AVE=0.77)
F52: Artistic activities in the city 0.90 0.82
F53: Diversity of artistic activities in the city 0.90 14.72* 0.81
F54: Artistic climate of the city 0.82 16.59* 0.68
Factor G: Public Transport (Cronbach’s α=0.75; CR =0.76; AVE=0.46)
G28: Public transport opportunities in the city 0.55 0.30
G55: Diversity of public transport in the city 0.75 8.68* 0.57 G56: Prices of public transport in the city 0.68 7.72* 0.46 G57: Comfort of pedestrians travelling on public transport 0.68 7.53* 0.46
Factor H: Pedestrian Movement (Cronbach’s α=0.82; CR =0.83; AVE=0.72)
H62: Reaching your destinations on foot 0.73 0.54
H63: Being able to walk on foot in the city center. 0.95 8.56* 0.90
Factor I: Local administration (Cronbach’s α=0.67; CR =0.69; AVE=0.53)
I65: Free courses provided by local governments 0.63 0.40
I66: Cleanliness of the city provided by the local government 0.81 10.52* 0.66
Factor J: Loyalty (Cronbach’s α=0.79; CR =0.79; AVE=0.56)
J71: I recommend people close to me to move to this city 0.74 0.55 J74: I want my friends living in other cities to visit this city 0.78 9.75* 0.60 J78: I advise people close to me to choose the university in this city at the time of application 0.73 9.48* 0.54
Factor K: Neighborliness (Cronbach’s α=0.89; CR =0.90; AVE=0.81)
K69:Residents’ willingness to help students 0.91 0.83
K70:Resident-student communication 0.89 12.72* 0.79
Factor L: Environment (Cronbach’s α=0.81; CR =0.82; AVE=0.53)
L29: Green spaces in the city L30: Walking paths in the city
0.60
0.85 12.12* 0.36 0.72
L31: Sports areas in the city 0.81 10.69* 0.65
L34: Parks in the city 0.67 9.82* 0.45
*p < .01
Figure 3 and Table 6 show that all variables affected city life satisfaction levels significantly (𝑝 < 0.01), with the variable that affected urban life satisfaction the most was variable E (civic engagement), with a magnitude of 0.84 (𝑝 < 0.01). This means that a one unit increase in the democratic climate of the city will increase the city life satisfaction of students by 0.84 units. This was followed by the variables A (safety), I (local government) and F (culture/art), in which the magnitude of effect was 0.77 for all three (𝑝 < 0.01). Likewise, it may be stated that as the services provided by the city in regards to
41
safety, local administration and culture/art increase, the city life satisfaction of the students also increases, and this situation is similar for the other variables.
It was concluded that all these results and all of the variables included in the model are significant in the city life satisfaction of students in both Eskişehir and Kütahya. Additionally, it may be seen as an important finding that the variables not included in the BLI developed by the OECD, having access to culture/art, public transport, pedestrian movement, local government, loyalty to the city and neighborhood relationships, also had significant effects.
4.5 Calculation of the City Life Satisfaction Index
As customer satisfaction is important in business life, similar attitudes are displayed by students who have requests on learning matters. The social structure, traditions and customs in a city have an impact on the students’ way of life, and so it is likely that university preferences may be influenced by these variables, with democratic attitudes, communities, culture, etc. topping the satisfaction list. The relative effects of the social structure of the cities in which the universities are located on the students’ satisfaction with their way of life were analyzed with the help of a recommended index, and the results of this index may be helpful when developing public policy and looking for opportunities in economic and commercial development.
The City Life Satisfaction Index (CLSI) was also calculated using proposed equation 1.
1 1
100
I i i i I i iCLSI
x
(1) in which, i i i = 1,...I : Factors : Mean of the factor: Paramer estimation of second order confirmatory factor weight
x
γ
The index in this study was categorized as: 0–19 very bad; 20–39 bad; 40–59 mediocre; 60–79 good; 80–100 very good. When the relative importance of the factors that affect city life satisfaction are calculated as an index, interpreting the index becomes easier and comparing the factors in terms of magnitude becomes possible. In addition, by means of the calculated index, it becomes possible to compare the factors objectively with the results of prospective studies.
The relative significance levels of all dimensions constituting city life satisfaction were estimated through a confirmatory factor analysis, and the index weight of each factor was calculated by rating the standardized factor weights against the total factor weight. The city life satisfaction index was calculated by adding together the multiplications of the index weights of factors and the arithmetic mean
42
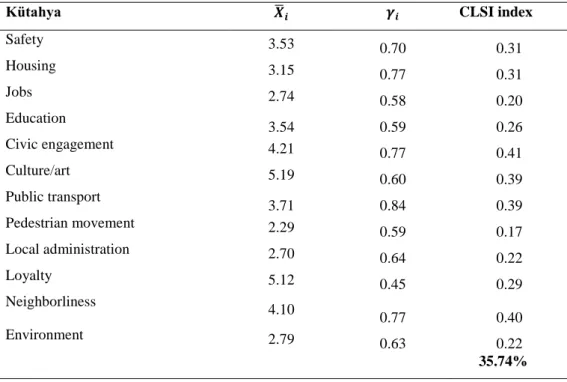
values related to the factors. The CLSI value was found to be 64.7 for the students in Eskişehir, and 35.74 for the students in Kütahya. The city life satisfaction accounts for the two cities were given in Tables 9 and 10. The index calculated for Eskişehir shows that the students are satisfied with life in the city in general terms, although upon a closer examination that takes into consideration all the factors, it was revealed that the provided services are unsatisfactory, primarily in pedestrian movement, and improvements must be made in this regard.
Table 8. Eskişehir city life satisfaction index account
Table 9. Kütahya city life satisfaction index account
Eskişehir 𝑿̅𝒊 𝜸𝒊 CLSI index
Safety 6.58 0.68 0.54 Housing 7.22 0.65 0.56 Jobs 5.40 0.74 0.48 Education 6.34 0.59 0.45 Civic engagement 7.19 0.73 0.63 Culture/art 6.64 0.76 0.60 Public transport 6.70 0.86 0.69 Pedestrian movement 4.66 0.50 0.28 Local administration 5.52 0.63 0.42 Loyalty 6.93 0.70 0.58 Neighborliness 6.33 0.83 0.63 Environment 7.63 0.67 0.61 64.7%
Kütahya 𝑿̅𝒊 𝜸𝒊 CLSI index
Safety 3.53 0.70 0.31 Housing 3.15 0.77 0.31 Jobs 2.74 0.58 0.20 Education 3.54 0.59 0.26 Civic engagement 4.21 0.77 0.41 Culture/art 5.19 0.60 0.39 Public transport 3.71 0.84 0.39 Pedestrian movement 2.29 0.59 0.17 Local administration 2.70 0.64 0.22 Loyalty 5.12 0.45 0.29 Neighborliness 4.10 0.77 0.40 Environment 2.79 0.63 0.22 35.74%
43
The index calculated for Kütahya points to a level of dissatisfaction among the students in regards to the quality of life in the city, and that all of the service dimensions in Table 9 need improvement.
It is recommended that public authorities, local administrations and the other decision makers make the necessary improvements by taking the values of the service dimensions into consideration for which they are responsible with the help of these index values, and to observe any changes that occur in the index over time.
5. Discussion and Implications
Known as the “student city” of Turkey, Eskişehir has also been bestowed with the titles “Culture Capital of the Turkish World” and “UNESCO Intangible Cultural Heritage Capital”. Kütahya has tourism potential, based on the presence of the university within its borders, its developing industry, its rich above- and below-ground resources, its handicrafts and its thermal resorts. A review of literature revealed few studies investigating city life satisfaction levels among university students in Turkey, or the factors and indices influencing city life satisfaction. Accordingly, this study, conducted in two cities and in two universities in Turkey, can be considered as making a comprehensive contribution to literature in its field, and it may also be used as a resource for public administrators and local government when looking for strategies to increase city life satisfaction levels among students.
In the structural model proposed for the ESOGU and DPU students in the study, it was found that all variables (safety, housing, jobs, education, civic engagement and culture/art opportunities, as well as public transport, pedestrian movement, local government, loyalty, neighbor relationships, environment) affected city life satisfaction. The city life satisfaction of the students in Eskişehir was most affected by civic engagement, local government, education and public transport, while the factors affecting the city life satisfaction of those living in Kütahya were respectively civic engagement, safety, local government and culture/art. Civic engagement was the most influential factor in both cities, which reflects the importance placed in the protection of human rights and its influence in city life satisfaction. There are other studies supporting this outcome. Rentfrow et al. (2009) found that people living in countries with high levels of civic engagement were wealthier, more educated and more tolerant than those living in conditions of weaker prosperity and civic engagement. Similarly, Zenker (2009) suggested that educated people, instead of looking at work opportunities or economic incentives when deciding upon a city of residence, prioritized rather the social environment, democratic climate, education and cultural characteristics of their ideal city.
Theoretical contributions. The study also found that variables like safety, housing, jobs and education, along with access to culture/art, public transport and pedestrian movement to be influential in city life satisfaction. The result reveals that important factors in the satisfaction levels of students in a city include the safety/security environment provided by the cities, rent prices, opportunities provided by universities
44
in cities, diverse artistic activities in cities, the diversity and price of city transportation, the comfortability of pedestrian movement. Likewise, Darchen and Tremblay (2010) determined work opportunities, social prosperity, city safety, opportunities provided by universities, quality of public transport, and cultural and social activities as the most effective factors in city life satisfaction. Santos, Martins and Brito (2007), on the other hand, found that urban life quality is affected by variables such as education opportunities, social activities, inner city safety and culture/art opportunities.
Noni et al. (2014) in their study investigating the perceived image of the city of Milan found culture/art and education to the most significant factors in the attractiveness of the city, while in contrast to the result of this study, they found job opportunities and safety to be unimportant. Similar to the results of the present study, Merrilees et al. (2009), in their comprehensive study of city brand attitudes, revealed that factors such as safety, cultural and artistic activities and social peace are important in the branding of cities.
The results of the present study reveal that local government services (cleanliness of the city, course services, etc.), loyalty of the students to the city (recommending the city and the university to others), neighbor relationships in the city (resident-student communication, residents helping students) and the environment (green spaces, sports areas, walking areas and parks) were also highly influential in city life satisfaction. There are studies that concur with the findings of this study, while others disagree. In Lee’s study (2008) on the measurement of quality of life (QOL), it was found that the security and public services provided by local governments are highly important for life satisfaction, although this differed from the findings of this study, in that relationships with neighbors and environmental factors were found not to be influential. Diener and Suh (1997) and Angner (2010) determined that social relationships among individuals (relatives, friends, neighbors) are important in the life satisfaction of individuals.
Marans W. (2003) found that environment, transportation, neighbor relations, parks and residences affected the quality of urban life significantly, while Insch (2010) found the four most fundamental factors influencing the city life satisfaction of citizens to be work/life balance, safety, natural environment and the communication assets of the city. García, Gómez and Molina (2012) identified the socio-economic infrastructure, environment and safety, as well as national and cultural resources, as influential factors in city branding and in the establishment of a city image. According to these and similar studies, in underdeveloped and developing cities where urbanization is not complete, the expenditures of university students and the demand for accommodation, services, infrastructure and socio-cultural areas leads to the emergence of a different system of organization in the city and vitality in the economy (Zenker et al., 2013; Rainisto, 2013; Noni et al., 2014).
Practical applications. The study found the city life satisfaction index value to be 64.7 for Eskişehir and 35.74 for Kütahya. Based on these calculations, the life satisfaction of the students living in Eskişehir
45
was found to be at a good level, while the satisfaction level was poor for those living in Kütahya. While the most influential factors on the city life satisfaction levels of the students living in Eskişehir were civic engagement (0.69), safety (0.63), local government (0.63), loyalty to the city (0.61) and education (0.60), the least effective variables were housing (0.28) and neighbor relations (0.42), respectively. In contrast, while the most influential factors on the city life satisfaction levels of the students living in Kütahya were civic engagement (0.39) and local government (0.39), the least effective ones were housing (0.17), public transport (0.20), neighborhood relations (0.21), loyalty (0.22), work opportunities (0.26) and culture/art (0.30).
In Eskişehir, known in Turkey as the “city of students,” many students, after getting their university degrees, look to find a job in the city and stay there. The democratic climate and the environment of freedom, as well as the sense of safety and security, and the local government services (courses, cleanliness of the city, parks, sports areas and walking paths) are highly thought of in the city, the and culture/art activities are diverse, leading students to admire the city. Furthermore, one of the most important factors making Eskişehir a livable city is its livable environment. Eskişehir has an abundance of green spaces, walking paths, sports areas and parks, culture/art activities are frequent in Eskişehir, and as it has a fine nature, even students living in Kütahya rent cars at the weekends to visit Eskişehir.
Housing opportunities and neighbor relationships had the lowest effect on the city life satisfaction levels of the students in both Eskişehir and Kütahya. The local governments in both cities may increase the quality of housing opportunities to increase the life satisfaction levels of students. It should be noted; however, that communication between the residents and the students and neighborhood relations are not at a desired level, and so local governments and university administrations should consider making efforts to improve student-resident relationships. The variables of public transport, work opportunities, culture/art opportunities and loyalty to the city also had a very low effect on the life satisfaction of the students living in Kütahya, and these dimensions need to be improved if the city life satisfaction levels of the students are to be improved. The diversity, comfort and cost of public transport should be evaluated by local governments and municipalities, and steps taken to improve the services in this regard. The frequency of public transport services between the university and the city center may be increased for the students, and cultural and artistic activities may be made more frequent through cooperation between the university administration and local government. Similarly, municipalities and university administrations could increase the number of jobs in which students can be employed, and employment conditions could be improved.
46
Limitations and directions for future researchThis study has a few limitations that should be addressed in future studies. Generalization of the results of the study is limited by the fact that only the students of two universities in Turkey were included in the sample. Further studies should include students from other cities, as well as the residents of those cities. Empirical studies are mostly quantitative, and the aim of studies such as this is to measure city life satisfaction levels using a standard survey, but this is not sufficient. In order to investigate the issue better, a qualitative research should also be conducted; that is, the surveyed audience should be consulted about their opinions, and questions should be shaped accordingly, as the measurement of city life satisfaction using a standard survey may exclude some important variables.
Accordingly, it can be considered an appropriate approach to calculate the index based on the weighted average of each structure using regression weights in relation to the core concept, and a generalization of the results of such an index will be able to be repeated all across Turkey.
Appendix A A 0.70 B 0.46 0.84 C 0.46 0.35 0.77 D 0.46 0.36 0.36 0.76 E 0.65 0.50 0.50 0.51 0.70 F 0.60 0.46 0.46 0.47 0.65 0.87 G 0.45 0.34 0.34 0.35 0.49 0.45 0.67 H 0.35 0.27 0.27 0.27 0.38 0.35 0.26 0.84 I 0.59 0.46 0.46 0.46 0.65 0.59 0.44 0.35 0.72 J 0.49 0.37 0.37 0.38 0.53 0.49 0.36 0.28 0.48 0.74 K 0.50 0.38 0.38 0.39 0.54 0.50 0.37 0.29 0.50 0.41 0.90 L 0.54 0.42 0.42 0.42 0.59 0.54 0.40 0.32 0.54 0.44 0.45 0.72 AVE 0.50 0.72 0.60 0.59 0.49 0.77 0.46 0.72 0.53 0.56 0.81 0.53 References
Angner, E. (2010). Subjective well-being. The Journal of Socio-Economics, 39, 361-368.
Arslan, S., and Akkaş, O.A. (2014). Quality of College Life (QCL) of students in Turkey: Student’s life satisfaction and identification.
Social Indicators Research, 115 (2), 869-884.
Ashworth, G.J., and Voogd, H. (1990). Selling the city: marketing approaches in public sector urban planning. London: Belhaven Press.
Bonaiuta, M., Fornara, F., and Bonnes, M. (2003). Indexes of perceived residential environment quality and neighbourd attachment in urban environments: a confirmation study on the city of Rome. Landscape and Urban Planning, 65, 41-52.
47
Management. Erasmus Research Institute of Management. Retrieved from http://hdl.handle.net/1765/13694.
Braun, E., and Zenker, S. (2010). Towards an integrated approach for place brand management. Paper presented at the 50th European
Regional Science Association Congress, Joenkoeping, Sweden.
Braun E., Kavaratzis M., and Zenker S. (2010). My City - My Brand: The role of residents in place branding”, paper presented at the
50th European Regional Science Association Congress, Joenkoeping, Sweden.
Byrne, M. B. (1998). Structural Equation Modeling with LISREL, PRELIS and SIMPLIS: Basic Concepts, Applications and
Programming. Mahwah, NJ: Lawrence Erlbaum Associates, 396.
Darchen, S., and Tremblay, D.G. (2010). What attracts and retains knowledge workers/students: The quality of place or career opportunities? The cases of Montreal and Ottowa. Cities, 27(4), 225-233.
De Carlo, M., Canali, S., Pritchard, A., and Morgan, N. (2009). Moving Milan towards Expo 2015: Designing culture into a city brand.
Journal of Place Management and Development, 21(1), 8-22.
Diener, ED., and Suh, E. (1997). “Measuring quality of life: Economic, social and subjective indicators”, Social Indicators Research,
40, 189-216.
Fornell, C. and Larcker, D. F. (1981). Evaluating structural equation models with unobservable variables and measurement error.
Journal of marketing research, 18(1), 39-50.
García, J.A., Gómez, M., and Molina, A. (2012). A destination-branding model: An emprical analysis based stakeholders. Tourism
Management, 33(3), 646-661.
Hair, J. F., Black, W., Babin, B., Anderson, R.E., and Tatham, R.L. (2005). Multivariate Data Analysis. 5th ed. Upper Saddle River, NJ: Prentice Hall.
Huang, C., Wang, Y., Wu, T. and Wang, P. (2013). An Empirical analysis of the antecedents and performance consequences of using the Moodle platform. International Journal of Information and Education Technology, 3(2), 217-221.
Insch, A. (2010). Managing resident’s satisfaction with city life: Application of importance-satisfaction analysis. Journal of Town &
City Management, 1(2), 164-174.
Jöreskog, K. G., and Sörbom, D. (2002). The Student Edition of LISREL 8.53 for Windows, Lincolnwood. Chicago, IL: Scientific Software International.
Kavaratzis, M. (2005). Place branding: A review of trends and conceptual models. The Marketing Review, 5(4), 329-342.
Kavaratzis, M., and Ashworth, G.J. (2006). City branding: An effective assertion of identity or a transitory marketing trick? Place
Branding, 2(3), 183-194.
Kotler, P., and Gertner, D. (2002). Country as a brand, product, and beyond: A place marketing and brand management perspective.
The Journal of Brand Management, 9(4), 249-261.
Marans, W. (2003). Understanding environmental quality through quality of life studies: the 2001 DAS and its use of subjective and objective indicators. Landscape and Urban Planning, 65,73-83.
Merrilees, B., Miller, D., and Herington, C. (2009). Antecedents of resident’s city brand attitudes. Journal of Business Research, 62(3), 362-367.
Noni I.D., Orsi, L., and Zanderighi, L. (2014). Attributes of Milan influencing city brand attractiveness. Journal of Destination
Marketing & Management, 3, 228-226.
Rainisto, S.K. (2003). Success factors of place marketing: A study of place marketing practices in Northern Europe and the United
States. Helsinki University of Technology.
Rentfrow, P.J., Mellander, C., and Florida, R. (2009). Happy states of America: A state- level analysis of psychological, economic and social well-being. Journal of Research in Personality, 43, 1073-1082.
48
Santos, L., Martins, I., & Brito, P. (2007). Measuring subjective quality of life: A survey to Porto’s residents. Applied Research in
Quality of Life, 2(1), 51-64.
Shook, C. L., Ketchen, D.J., Hult, G.T.M., and Kacmar, K.M. (2004). An assessment of the use of structural equation modeling in strategic management research. Strategic Management Journal, 25 (4), 397–404.
Yusuf, S., and Nabeshima, K. (2005). Creative industries in East Asia. Cities, 22(2), 109-122.
Zenker, S. (2009). Who’s your target? The creative class as a target group for place branding. Journal of Place Management and
Development, 2(1), 23-32.
Zenker, S., Knubben, E., & Beckmann, S.C. (2010). Your city, my city, their city, our city- different perceptions of place brands by Diverse Target Groups. Paper presented at the 6th international conference thought leaders in brand management, Lugano, Switzerland.
Zenker, S., Eggers, F., and Farsky, M. (2013). Putting a price tag on cities: Insights into the competitive environment of places. Cities,
30, 133-139.
Zenker, S., Peterson, S., and Anholt, A. (2013). The Citizen Satisfaction Index (CSI): Evidence for a four basic factor model in German sample. Cities, 31, 156-164.