Corruption, Prosperity and Sustainable
Development: Some New Evidence
Taner Güney
Yrd. Doç. Dr., Karamanoğlu Mehmetbey Üniversitesi, İktisadi ve İdari Bilimler Fakültesi, İktisat Bölümü, [email protected]
Yolsuzluk, Refah ve Sürdürülebilir Kalkınma: Bazı Yeni Kanıtlar
Özet
Bu çalışmanın amacı yolsuzluğun refah ve refahın sürdürülebilir olma özelliği üzerindeki etkisini ortaya koymaktır. Bu amaçla sekiz boyutlu olarak hesaplanmış olan bir refah değişkeni ve bu refah değişkeninin yardımıyla türetilen bir sürdürülebilir kalkınma değişkeni kullanılarak, yolsuzluğun refah ve sürdürülebilir kalkınma üzerinde gerçekte ne kadar etkili olduğu analiz edilmiştir. Analiz sonuçlarına göre yolsuzluk refah ve sürdürülebilir kalkınma üzerinde önemli bir açıklama gücüne sahiptir. Bu açıklama gücü negatif yönlüdür ve oldukça yüksek anlamlılık düzeyine sahiptir. Yolsuzluk düzeyi yükseldiğinde refah ve sürdürülebilir kalkınma düzeyi hayli azalmaktadır. Analiz sonuçlarına göre yolsuzluğun refah üzerindeki negatif yönlü etkisi sürdürülebilir kalkınma üzerindeki negatif etkisinden daha büyüktür. Anahtar Kelimeler: Yolsuzluk, Refah, Zenginlik, Kalkınma, Panel Veri.
Corruption, Prosperity and Sustainable Development: Some New Evidence
Abstract
The aim of this study is to analyse the effect of corruption on prosperity and the sustainability of prosperity. The effect that corruption has on prosperity and sustainable development is analysed by a calculated eight dimension prosperity variable and a sustainable development variable derived from the prosperity variable. According to the results of the analysis, corruption has significant explanatory power on prosperity and sustainable development. This explanatory power is negatively oriented and has quite a high level of significance. When the level of corruption rises, the level of prosperity and sustainable development highly diminishes. According to the results of the analysis, the negatively oriented effect of corruption on prosperity is greater than the negative effect on sustainable development.
Keywords: Corruption, Welfare, Wealth, Development, Panel Data
1. Introduction
How effective is corruption, which means the abuse of public property for private interests, on prosperity and the sustainability of prosperity? Corruption has quite a complex structure containing economic, social, political, cultural and religious constituents. This complex structure mostly relates to political activities, presidents, dictators and the activities of public officers (Tanzi, 1998; Bakre, 2007). Corruption is like a “cancer”, “virus” or “epidemic illness” negatively affecting the economic, social and political variables of a country. This epidemic
ESKİŞEHİR OSMANGAZİ ÜNİVERSİTESİ İİBF DERGİSİ
182
illness disrupts the functioning of the economic structure, reduces tax revenues and public investments, damages the reliance placed on laws and institutions, paves the way for the emergence of gangs and causes the quality of life to decline. Therefore, even though there are opinions on the fact that corruption positively affects the economic activities (Leys, 1965; Lui, 1985; Acemoglu and Verdier, 1998), corruption, as a general opinion, causes the prosperity levels of countries to decline (Amundsen, 2006; Klitgaard, 2000).
Since the study of Nye (1967), which examined the relationship between economic growth and corruption, there is broad literature on the effects of corruption on economic growth and development1 . According to scientific studies, corruption has a negatively oriented effect on economic variables such as sustainable development, economic growth, savings, income, investment, democracy, public expenditures and foreign aids (Svensson, 2005). For example, in the study where he measured the sustainable development by a genuine investment variable, Aidt (2010) used data from 110 countries during the years between 1996 and 2007. According to the study, which used panel data analysis, corruption causes a reduction in the genuine wealth per capita. In another study, Aidt (2009) analysed whether corruption is “grease” or “sand” for economies. According to the study, corruption does not contribute to economic improvement. On the contrary, corruption causes a reduction in the genuine wealth per capita. Similar findings were also obtained by Bentzen (2012), Reiter and Steensma (2010), Mendez and Sepulveda (2006) and Mo (2001).
Corruption is also a substantial threat to environmental sustainability. The fact that environmental regulations are a deterrent and are reinforced by strict rules also indicates that they may be removed or reconstituted due to corruption. Thus, corruption leads to an increase in environmental pollution by eliminating the efficiency of environmental regulations (Lopez and Mitra, 2000; Hafner, 1998; Dasgupta et al., 1995). The studies prove that there is a negatively oriented relationship between corruption and environmental sustainability. For example, Mukherjee and Chakraborty (2010) researched whether the level of environmental sustainability is affected by corruption as well as socio-economic and socio-political factors. According to the analytical findings of the research, there is a negatively oriented relationship between corruption and environmental sustainability. Accordingly, corruption causes environmental sustainability to decline. Similar findings were also obtained by Welsch (2004), Damania et al. (2003) and Lopez and Mitra (2000).
The aim of this study is to analyse how effective corruption actually is on prosperity and sustainable development. As also mentioned in the second chapter
of the study, prosperity and the environment are two important variables that are dependent on each other. Because the sustainability of the environment in which the economic activities are maintained also depends on the creation of today’s economic prosperity as well as on the level of prosperity that will be created in future, it is not negatively affected by the level of today’s prosperity. His phenomenon is one of the basic structures of the concept of sustainable development. Therefore, this study uses a prosperity index that is calculated in a detailed way by means of eight main sub-variables and a sustainable development variable obtained by adding an environment variable to this index.
According to the results of the panel data analysis, there is a negatively oriented and statistically significant relationship between the level of corruption and prosperity and sustainable development. According to analyses of data from 109 countries, when the level of corruption rises, sustainable development and prosperity decrease. Although corruption accounts for more than 70% of prosperity, this ratio increases to 48% for sustainable development. This explanatory power indicates the magnitude of the harmful effect of corruption on prosperity and sustainable development. In the study, the countries were also divided into developing and developed countries and estimation results were obtained for these country groups. The negatively oriented effect of corruption on prosperity and sustainable development in developed countries is greater in proportion to developing countries.
The chapters of this study are organised as follows. In the second chapter of the study, the relationship between prosperity and the environment is explained. In the third chapter, the constituents of the prosperity variable and the addition of the environment variable to the prosperity variable are included. The fourth chapter presents data and method. In the fifth chapter the analysis results indicating the relationship between the level of prosperity and environment variables and the level of corruption are included. The sixth chapter presents the conclusions.
2. The Relationship Between Prosperity and Environment:
Sustainable Development
The level of prosperity created in an economy is closely related to the environment variable, which is affected considerably by economic activities. In Our Common Future, a report also known as the Brundtland Report, which is prepared by the World Commission on Environment and Development (WCED), sustainable development is defined as follows: fulfilling the present-day requirements of the community through resource utilisation at the level that will
ESKİŞEHİR OSMANGAZİ ÜNİVERSİTESİ İİBF DERGİSİ
184
not deprive the next generations of the community of the ability to meet their own requirements. By this definition, sustainable development has three dimensions. These are the sustainability of valid growth; the fulfilment of today’s requirements, namely, causing all people to attain a standard of living even though it is at a minimum; and the removal of poverty and securing the life and prosperity of the next generations (WCED, 1987)2 . However, the harmful effects of a running economy on the environment are required to be kept at a level that will not threaten the civilisation in order for these targets to be achieved.
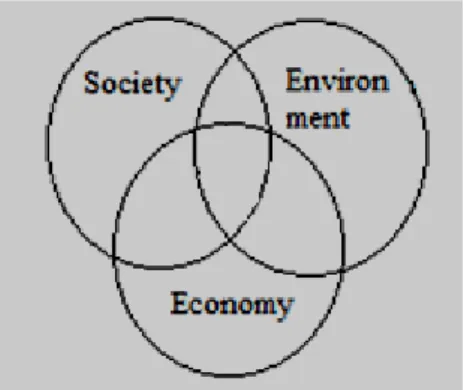
It is accepted that the concept of sustainable development has general social, environmental and economic substructures. Figure 1, which Peeters (2012: 293) constituted, represents the 3 variables underlying the concept of sustainable development. When the activities of social, economic and environmental variables are discussed separately, it is known that the results produced from each one constitute a problem for another variable in the long term. Accordingly, the section on which these three variables intersect indicates the sustainability of development. Therefore, sustainable development is frequently shown as the convergent section of these three variables.
Figure 1: Three Variables of Sustainable Development (Source:Peeters (2012: 293)
The concept of sustainable development, which takes place at the intersection point of the triangle of economy, community and environment, may also be an indicator of the field of activity of these three variables. More clearly, the communities conducting their economic activities realise these activities in the framework of an ecosystem. In other words, human production affects the atmosphere, oceans, waterways, forests, glaciers and biological diversity. Thus, the ecosystem is the most important factor bearing the burden of the economic activities of communities.
2The statements similar to this definition were also mentioned in the studies of Solow (1992), Pezzey (1992), Heal
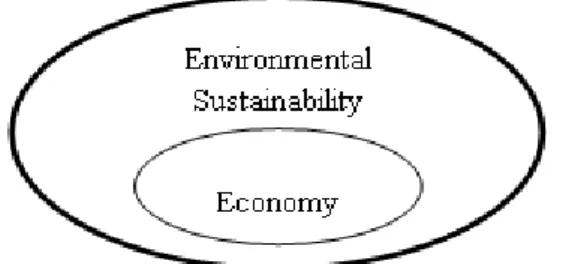
The “next generations”, which the sustainable development defined in Brundtland Report implies, suggests quite a long time for human existence. Thus, resource utilisation at the level that will not deprive the next generations of the ability to meet their own requirements is only possible through a very long-term protection of the ecosystem, namely, the environment (Parkin, 2010; Güney, 2014). Figure 2 was constituted to represent this condition.
Accordingly, the substructure of economic activities is completely composed of the sustainable environment variable. The concept of sustainable development built in a sustainable environment has six universal targets in the vision of 2030 according to Griggs et al. (2013:307). These targets reinforce the close relationship between the economy and environment variables, as shown in Figure 2. In these targets, economic goals (poverty must decrease, education level must increase, prosperity of individuals must increase, unemployment must decrease, income must be distributed fairly, health and housing conditions must be improved) as well as environmental goals (long-term food security must be ensured, nutrition conditions must be improved, starvation in the world must be reduced or eliminated, the production, distribution and consumption chain must have a sustainable system of functioning, water safety must be sustainable, clean energy must have a universal dimension and the ecosystem must function healthily and efficiently) are at the forefront.
Figure 2: Sustainable Environment and Development (Source: Drawing of the author)
It is also understood that communities must notice the close relationship between the economy and the environment to be able to reach the targets such as education, unemployment, fair income distribution, health, housing conditions, resource utilisation, clean water, clean energy and safe food. The aim must be that future prosperity is affected at the very least by the environmental pollution caused by economic activities while these activities are conducted to increase present-day prosperity.
ESKİŞEHİR OSMANGAZİ ÜNİVERSİTESİ İİBF DERGİSİ
186
3. The Relationship Between Prosperity, Environment and
Corruption
Although the study of prosperity does not precisely reflect the levels of prosperity of different countries (Gruen and Klasen, 2008), those who study prosperity frequently use economic growth or GDP per capita to measure the level of prosperity. The reason why economic growth or GDP per capita cannot reflect the level of prosperity precisely stems from the fact that it does not include variables such as health, education, asset rights, social capital, social relationships and security. Economic growth or GDP per capita, in which these variables are not included, indicates only the economic aspect of development. With the exception of using economic growth or GDP per capita variables, there are various approaches that researchers use as indicators of the level of prosperity and sustainable development. These are corrected GDP, happiness indices and the Human Development Index. Each of these variables has distinctive advantages and disadvantages. The Human Development Index (HDI) is used as the indicator of the level of social prosperity and represents the average of three variables. These variables are the averages of GDP per capita, health and education. Thus, HDI measures social prosperity by the variables of education, health and the average of income per capita.
The approach of corrected GDP aims to use the indicators that might measure a shift in the level of social prosperity. Due to this character, the approach of corrected GDP, which is closely related to the welfare economy, tends to represent shifts in social prosperity rather than measuring the level of prosperity. Happiness approaches measure the level of prosperity subjectively through questions asked of individuals. “Genuine investment”, which is another approach, aims to measure the capital stock of the economy. Genuine investment calculates the manufacturing industry and human, social and natural capital variables by their current prices and is frequently used by researchers (Aidt, 2010:3).
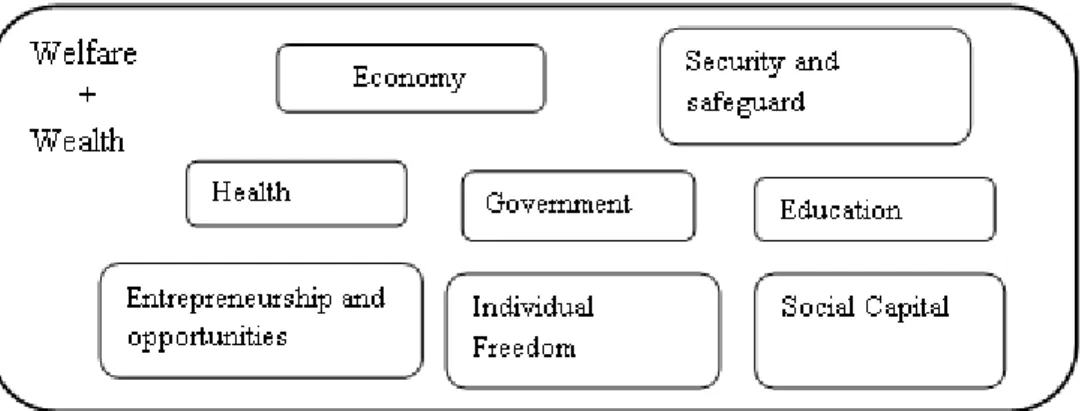
As the indicator of the level of prosperity, the Prosperity Index (PI) is used in this study. PI is an index prepared and published by the Legatum Institute. PI, which is the combination of the words wealth and welfare, consists of 8 sub-indexes: government3, entrepreneurship and opportunities, education, health, individual freedom, security and safeguard, social capital and an economy variable. These eight sub-indexes are also calculated with the help of their own sub-indexes, resulting in 89 indicators in total. Considering this aspect, PI makes quite a comprehensive measurement of the level of prosperity. Therefore, it is preferred in this study. Figure 3 shows the scope and sub-indexes of PI.
As also mentioned before, the level of prosperity, which is obtained as a result of economic activities, is closely related to the environment because economic activities are conducted in the framework of an ecosystem. Therefore, the environment variable should not be ignored in the quest for prosperity.
Figure 3: PI and its sub-indexes (Source: Drawing of the author)
Then, when environmental sustainability and prosperity are handled as a whole, only the actual level of prosperity may be mentioned. Moreover, it is also known that corruption has a negatively oriented effect on the environment. Therefore, the actual effect of corruption on prosperity is only possible by also considering environmental sustainability, which is part of the level of prosperity. This case is observed in Figure 4.
Figure 4: Prosperity, Environment and Corruption (Source: Drawing of the Author)
4. Data and Method
4.1. Data Definitions and Sources
In this study, two corruption indexes are used to analyse the effect of corruption on prosperity and sustainable development. These are the Corruption Perception Index (CPI) and the Corruption Control Index (CCI). As the indicator of prosperity, the Prosperity Index (PI) is used. The index, which has been prepared and
ESKİŞEHİR OSMANGAZİ ÜNİVERSİTESİ İİBF DERGİSİ
188
published regularly each year since 2009, included 142 countries in 2013. The index is constituted by scoring seven sub-indexes based on the number of countries and ranks the countries from low to high as a result of this scoring. The index gets figures between -5 and +4. A low score indicates a low level of prosperity, while a higher score represents a higher level of prosperity. PI includes data from the years 2009 to 2013. These data were received from the Legatum Institute.
In our study, CPI and CCI are the preferred corruption scores. CPI gets scores between 0 and 10. In CPI, as the scores approach 10, the level of corruption decreases; as they approach 0, the level of corruption increases. The CPI data used were from the years 2009 to 2013. The data were received from Transparency International. When measurement figures are considered4, it is expected that the PI level of sustainable development will increase (Paldam, 2002; Aidt, 2009; Aidt, 2010) when CPI increases.
CCI includes the period of time from 1996 to 2012 and was most recently calculated for 230 countries. CCI defines public sector corruption in terms of bureaucracy and policy. The index figures, which measure corruption based on a wide range of agencies and institutes, are between -2.5 and +2.5. As the index value increases, corruption decreases. CCI uses data from the years 2009 to 2013. These data were obtained from the World Bank’s Worldwide Governance Indicators. When the measurement figures are taken into account5, it is expected that PI and the level of sustainable development will increase when CCI increases. In the study, four more variables are available aside from the corruption indexes. These are democracy, literacy, urbanisation and bank credits. The variables used in our analyses were chosen in terms of their practicality and in light of studies found in our hypothesis and related literature. The independent variables are defined, and their prospective signs are discussed below.
The democracy variable consists of the average of the individual freedom and political right variables. The data compiled from Freedom House range from 1 to 7. As the figures approach 1, the level of democracy improves; when they approach 7, the level of democracy worsens6. When the level of democracy rises, PI is also expected to increase (Tavares and Wacziarg, 2001; Rivera-Batiz, 2002;
4 When corruption decreases, CPI values approach 10 while the level of prosperity rises, PI approaches 4. 5When corruption decreases, CCI values approach 2,5 while the level of prosperity rises, PI approaches 4. 6 Measurement of PI and democracy variable is different. When PI rises, the level of prosperity increases while the
case is exact opposite in democracy variable. To remove measurement difference between two variables, democracy figures are multiplied by (-1). So, measurement difference of two variables is removed.
Aidt, 2010). The literacy variable was obtained from Worldwide Development Indicators (WDI). The variable obtains figures between 0 and 1. When literacy increases, PI is also expected to increase (WCED, 1987; Barro, 2001; Welsch 2004). Urbanisation, which is another variable, represents the number of people living in cities. When the urbanisation level rises, PI is also expected to increase (Akçay, 2006). The variable obtains figures between 0 and 1. The data were obtained from WDI. The bank credit variable represents the ratio of domestic credits that the private sector uses to the GDP. When the credit variable rises, PI is also expected to increase (Wei and Wu, 2002). The variable obtains figures between 0 and 1. The data were obtained from WDI.
Another variable used in this study is the Environmental Performance Index (EPI). It is prepared under the partnership between the Yale Centre for Environmental Law and Policy and the Centre for International Earth Science Information Network with cooperation from the World Economic Forum and the Joint Research Centre of the European Commission and support from many experts from different fields. EPI has been calculated for 178 countries in 2014. EPI concentrates on two different aims for environmental protection. These are the aims of reducing environmental stresses on human health (environmental health) and protecting ecosystem vitality (ecosystem vitality). The EPI index gets figures between 0 and 100. The value 0 indicates the lowest environmental performance, whereas figures approaching 100 indicate that the environmental performance improves. EPI data from 2008, 2010 and 2012 were used. The data were received from Yale University.
The reason why the EPI variable was included in this study is to obtain a sustainable development variable together with PI as a constituent of sustainable development because, as mentioned in chapter three, PI does not include any environmental variable. For this purpose, PI and EPI were converted to a decimal scale by means of the following formula. The lowest and highest figures in the series of variables were first found to find the standard figure for each variable in the decimal scale. Then, to find the standard value of the observation for each year in the decimal scale, the conversion to the decimal scale was ensured by writing the observation figure of the handled year in place of the Year’s Figure in the formula.
Standard Value= Year's Value-The Lowest Value
ESKİŞEHİR OSMANGAZİ ÜNİVERSİTESİ İİBF DERGİSİ
190
After the conversion of the observation figures of the two variables to the decimal scale, the data for a sustainable development (SD) variable7 were obtained by averaging these two variables. The SD figure ranges from 0 to 10 and has the characteristics of the PI and EPI observation figures. As the value of this variable approaches 10, sustainable development improves; as the figure approaches 0, sustainable development worsens.
SD=PI+EPI2 (2)
Equation (2) was used to obtain SD because, as mentioned in the third chapter, the environment represents the medium where the economic activities are conducted and is one of the two important constituents of sustainable development. The other important constituent is the economy indicated by PI. Therefore, sustainable development may be represented as the average of these two variables. When the measurement figures are taken into account8, SD is also expected to increase when CPI and CCI increase.
4.2. Empirical Method of Analysis
In this study, the method of panel data is used. Becoming quite widespread in recent years, the method of panel data has two dimensions: cross-section and time. In other words, there are N pieces of units and T pieces of observations corresponding to each unit in panel data models. Thus, increasing the number of observations ensures that the problem of a multilinear relationship is removed by adding more variability to the relation between the variables measured. Another advantage of panel data is that it incorporates the effects that cannot be observed during units and/or handled time into the model because, in the method of panel data, there are effects that cannot be observed during unit and time. Accordingly, the models that take into consideration the effects that cannot be observed during both unit and time are called bidirectional panel data, whereas the models that take only the unit dimension or only the time dimension into consideration are called unidirectional panel data. In this study, the model of cross-section effects is preferred9.
In this study, two econometric models are estimated. The first equation to be estimated is as follows:
7SD values are derived by dealing 2008 values of EPI together with 2009 values of PI, 2010 values together with
2010 and 2011 values of PI, 2012 values together with 2012 and 2013 values of PI.
8Sustainable development increases as SD values approach 10
9Because the data include between 2009 and 2013. It is considered that, in this period, the countries tend to put
more emphasis on the factors that might negatively affect the economic indicators such as corruption with the effect of 2008 financial crisis. FCross-Section test results which show unidirectional cross-section effect are given in
Prosperityit = αi + β1Corruptionit + β2Democracyit + β3Literacyit+ β4Urbanisationit +
β5Creditit +εit (3)
In Equation (3), αi represents the unobservable unit effect, i represents the number of units, and t represents time interval. Prosperity represents the prosperity figures of countries. Corruption represents the corruption figures of countries. Democracy represents the democracy figures of countries. Literacy represents the ratio of literates to the total population. Urbanisation represents the ratio of the population living in cities to the total population. Finally, Credit represents the ratio of domestic credits used by the private sector to the GDP. Equation (4), which is shown below, is another regression equation to be estimated in this study.
SDit = αi + β1Corruptionit + β2Democracyit + β3Literacyit + β4Urbanisationit
+ β5Creditit + εit (4)
In Equation (4), αi represents the unobservable unit effect, i represents the number of units, and t represents time interval. SD represents the sustainable development figures of countries, while Corruption represents the corruption figures of countries. Democracy represents the democracy figures of countries, and Literacy represents the ratio of literates to the total population. Urbanisation represents the ratio of the population living in cities to the total population, and
Credit represents the ratio of domestic credits used by the private sector to the
GDP.
5. The Effect of Corruption on Prosperity and Sustainable
Development
Of the methods of panel data, fixed effects are preferred for the estimation results concerning the effects of corruption on prosperity and sustainable development. The reason is that the Hausman test results are in favour of fixed effects. Another reason is the problem of probable internality in models. The method of fixed effects is a method that helps avoid the problem of potential internality and omitted variables because this study mainly addresses the effect of corruption on prosperity and sustainable development10. For potential heteroscedasticity and autocorrelation, White cross-section weights are used.
10Fixed effects(FE) explore the relationship between predictor and outcome variables within an entity (country,
person, company, etc.). Each entity has its own individual characteristics that may or may not influence the predictor variables.When using FE we assume that something within the individual may impact or bias the predictor or outcome variables and we need to control for this. This is the rationale behind the assumption of the correlation between entity’s error term and predictor variables. FE remove the effect of those time-invariant characteristics so we can assess the net effect of the predictors on the outcome variable.Another important
ESKİŞEHİR OSMANGAZİ ÜNİVERSİTESİ İİBF DERGİSİ
192
5.1. The Effect of Corruption on Prosperity
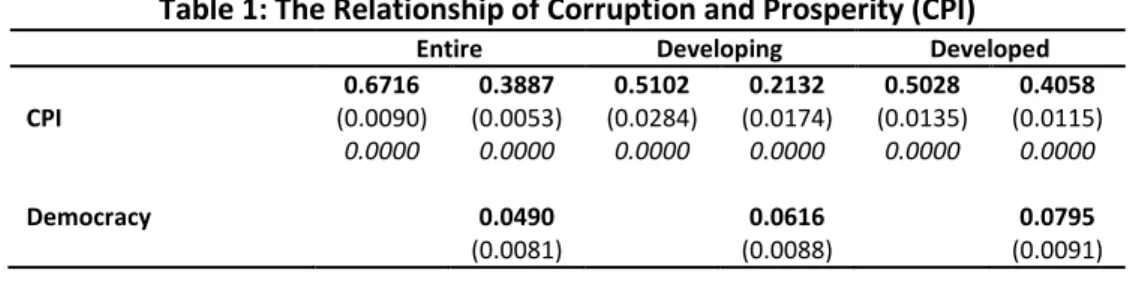
Table 1 and Table 2 indicate the estimation results for Equation (3). The estimation results obtained by adding the CPI corruption index to the analyses are shown in Table 1, while Table 2 indicates the estimation results obtained from the analyses made using CCI. When the effect of corruption on prosperity for all countries (Entire) according to Table 1 is examined, CPI affects a significant part of PI.
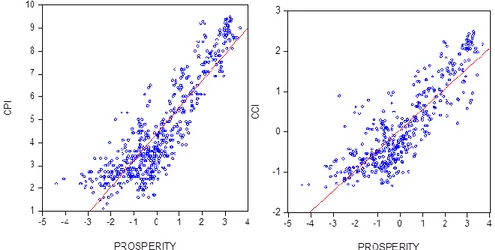
This effect is statistically significant even at the 1% the significance level. Accordingly, 77% of PI—which is composed of 7 sub-indexes, including economy, entrepreneurship and opportunities, education, health, individual freedom, security and safeguard and social capital—is accounted for by corruption. This result suggests how great a threat corruption is to the level of prosperity in all countries. The figure on the left side in Figure 5 suggests this close relationship between CPI and PI. Accordingly, CPI and PI are positively related. When the level of corruption decreases, the level of prosperity rises.
When the Democracy, Literacy, Urbanisation and Credit variables as well as the CPI are added to the model, all variables reach the power of accounting for 91% of the PI. The Democracy, Literacy, Urbanisation and Credit variables obtain the expected marks and exhibit statistical significance even at the 1% significance level. When developing countries11are dealt with according to Table 1, it is observed that the power of corruption to account for prosperity is quite lower than in developed countries. CPI accounts for 22% of the PI in developing countries, while the ratio accounting for all variables of PI rises to 72% when other variables are added to the model. Again, the Democracy, Literacy, Urbanisation and Credit variables obtain the expected marks and have statistical significance even at the 1% significance level. The average level of corruption for developing countries is higher in proportion to developed countries, but their average level of prosperity is lower in proportion to developed countries.
Table 1: The Relationship of Corruption and Prosperity (CPI)
Entire Developing Developed
CPI 0.6716 (0.0090) 0.0000 0.3887 (0.0053) 0.0000 0.5102 (0.0284) 0.0000 0.2132 (0.0174) 0.0000 0.5028 (0.0135) 0.0000 0.4058 (0.0115) 0.0000 Democracy 0.0490 (0.0081) 0.0616 (0.0088) 0.0795 (0.0091)
assumption of the FE model is that those time-invariant characteristics are unique to the individual and should not be correlated with other individual characteristics. Each entity is different therefore the entity’s error term and the constant should not be correlated with the others. If the error terms are correlated, then FE is no suitable since inferences may not be correct and you need to model that relationship (probably using random-effects), this is the main rationale for the Hausman test.
0.0000 0.0000 0.0000 Literacy 0.0289 (0.0006) 0.0000 0.0270 (0.0011) 0.0000 Urban 0.0062 (0.0003) 0.0000 0.0083 (0.0006) 0.0000 -0.0020 (0.0009) 0.0288 Credits 0.0053 (0.0002) 0.0000 0.0055 (0.0004) 0.0000 0.0045 (0.0002) 0.0000 C -2.9183 (0.0575) 0.0000 -4.7854 (0.0856) 0.0000 -2.5425 (0.1248) 0.0000 -4.2131 (0.1049) 0.0000 -1.5694 (0.0709) 0.0000 -1.2167 (0.0773) 0.0000 Adj.R2 0.77 0.91 0.22 0.72 0.78 0.85 F 1929.153 0.0000 810.6845 0.0000 107.3063 0.0000 131.5740 0.0000 755.0333 0.0000 218.7302 0.0000 Hausman 75.0323 0.0000 123.4967 0.0000 7.6971 0.0055 56.7521 0.0000 76.6399 0.0000 77.2771 0.0000 FCross-Section 63.3176 0.0000 32.8094 0.0000 61.1517 0.0000 28.0199 0.0000 48.1557 0.0000 34.6211 0.0000 Number of observations 545 392 335 248 210 144 Number of countries 109 100 67 63 42 37
Note: Standard errors are in parenthesis. Italic values are p estimations.
A similar situation is also valid for other variables12. To raise the level of prosperity, it is very effective for developing countries to increase the level of democracy, the literacy rate of the population, balanced and healthy urbanisation and domestic credits used by the private sector and to reduce corruption. The increase in the R2 figure from 22% to 72% shows the importance of democracy, urbanisation, literacy and credit variables for developing countries in terms of prosperity. However, it must be kept in mind that the widespread and high level of corruption in these countries is a disease that also has the potential of affecting the democracy, literacy, urbanisation and private sector credit variables. In other words, the fact that developing countries reduce the level of corruption means that the democracy, literacy, urbanisation and private sector credit variables are also positively affected and that their positive contributions to the level of prosperity increase—namely, corruption is still a very important variable for developing countries in terms of raising the level of prosperity.
ESKİŞEHİR OSMANGAZİ ÜNİVERSİTESİ İİBF DERGİSİ
194
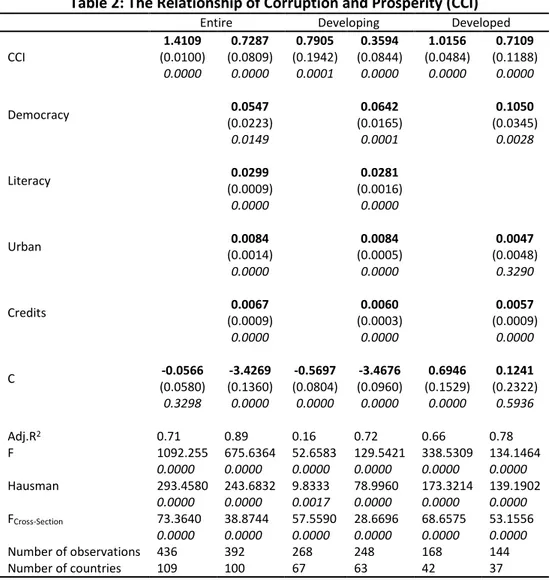
Table 2: The Relationship of Corruption and Prosperity (CCI)
Entire Developing Developed
CCI 1.4109 (0.0100) 0.0000 0.7287 (0.0809) 0.0000 0.7905 (0.1942) 0.0001 0.3594 (0.0844) 0.0000 1.0156 (0.0484) 0.0000 0.7109 (0.1188) 0.0000 Democracy 0.0547 (0.0223) 0.0149 0.0642 (0.0165) 0.0001 0.1050 (0.0345) 0.0028 Literacy 0.0299 (0.0009) 0.0000 0.0281 (0.0016) 0.0000 Urban 0.0084 (0.0014) 0.0000 0.0084 (0.0005) 0.0000 0.0047 (0.0048) 0.3290 Credits 0.0067 (0.0009) 0.0000 0.0060 (0.0003) 0.0000 0.0057 (0.0009) 0.0000 C -0.0566 (0.0580) 0.3298 -3.4269 (0.1360) 0.0000 -0.5697 (0.0804) 0.0000 -3.4676 (0.0960) 0.0000 0.6946 (0.1529) 0.0000 0.1241 (0.2322) 0.5936 Adj.R2 0.71 0.89 0.16 0.72 0.66 0.78 F 1092.255 0.0000 675.6364 0.0000 52.6583 0.0000 129.5421 0.0000 338.5309 0.0000 134.1464 0.0000 Hausman 293.4580 0.0000 243.6832 0.0000 9.8333 0.0017 78.9960 0.0000 173.3214 0.0000 139.1902 0.0000 FCross-Section 73.3640 0.0000 38.8744 0.0000 57.5590 0.0000 28.6696 0.0000 68.6575 0.0000 53.1556 0.0000 Number of observations 436 392 268 248 168 144 Number of countries 109 100 67 63 42 37
Note: Standard errors are in parenthesis. Italic values are p estimations.
When the estimation results obtained for developed countries in Table 1 are examined, CPI’s explanatory power for PI indicates a high figure, such as 78%. When the Democracy, Urbanisation and Credit variables13 are included in the model, this figure rises to 85% by adding 13% to the R2 figure. The Democracy, Urbanisation and Credit variables do not affect the level of prosperity in developed countries as much as the corruption variable. The average figures of these variables are quite higher in developed countries than developing countries. In other words, developed countries have reached a high level of prosperity by increasing the level of democracy and the literacy rate of the population and
improving balanced and healthy urbanisation and domestic credit used by the private sector.
Then, according to the variables used in our analysis, the most important instrument in increasing the level of prosperity further in developed countries where the level of prosperity is relatively high is the reduction of corruption. Table 2 shows the estimation results obtained from the analyses made for the determination of the effect of CCI on PI. In the estimations made for all countries, developing countries and developed countries, all variables obtained the expected mark.
The urbanisation variable does not have statistical significance in the estimation for developed countries, while the democracy variable is statistically significant at the 5% level in the estimation made for all countries. Other variables are statistically significant at the 1% significance level in the three models.
According to Table 2, CCI also accounts for an important part of PI, similarly to CPI. In fact, 77% of PI is accounted for by CPI, while this rate is 71% for CCI. The figure on the right side in Figure 5 suggests this close relationship between CCI and PI. Accordingly, CCI and PI are positively related. When the level of corruption decreases, the level of prosperity rises.When the Democracy, Literacy, Urbanisation and Credit variables are included in the model, R2 rises to 89%. When the estimation figures obtained for developed and developing countries in Table 2 are examined, it is observed that these results are similar to those shown in Table 1.
Accordingly, CCI accounts for only 16% of PI in developing countries, while this ratio rises to approximately 72% when other variables are included in the model. The ratio added to R2 is 56%. CCI accounts for 66% of PI in developed countries, while this ratio rises to 78% when other variables are included in the model. The ratio added to R2 is only 12%.
ESKİŞEHİR OSMANGAZİ ÜNİVERSİTESİ İİBF DERGİSİ
196
Figure 5: The Relationship of CPI, CCI and PI (Entire)
As also mentioned before, the examination of the data shown in Appendix 1 reveals that the average level of corruption is high and the average prosperity, democracy, literacy, urbanisation and credit figures are relatively low in developing countries. However, the situation is the exact opposite in developed countries. Therefore, a reduction in the level of corruption of the countries where corruption is widespread will raise the level of prosperity and will positively affect the contribution of these variables to the level of prosperity.
5.2. The Effect of Corruption on SD
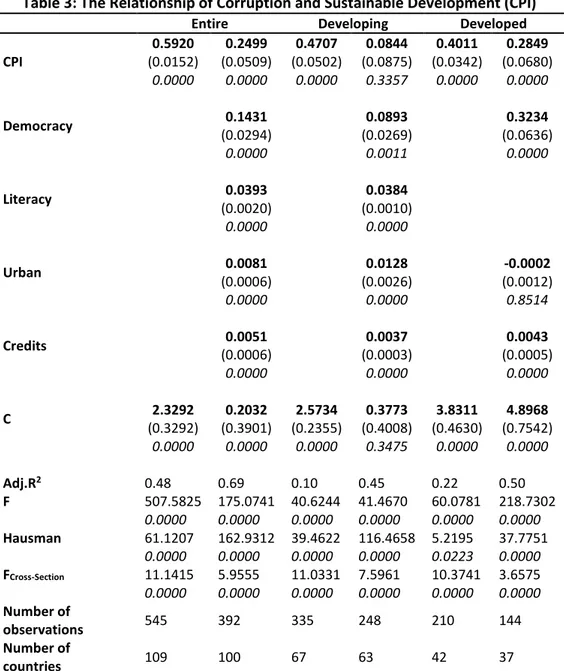
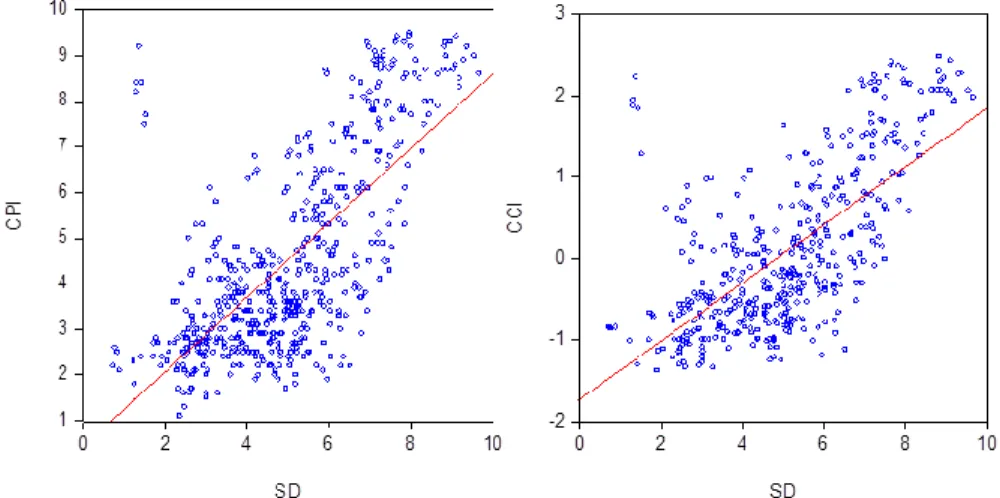
Table 3 and Table 4 indicate the estimation results for Equation (4). The estimation results obtained by adding CPI as the corruption index to the analyses are shown in Table 3, while Table 4 indicates the estimation results obtained from the analyses made using CCI. When all of the countries are examined in Table 3, CPI accounts for 48% of SD, which indicates sustainable development.
In other words, corruption represents approximately half of sustainable development, and this ratio is quite significant. In the figure on the left side in Figure 6, the relationship between CPI and SD is clearly observed. Accordingly, CPI and SD are positively related. When the level of corruption decreases, the level of sustainable development rises. As also stated in section 4.1, the SD variable is the average figure of PI, which consists of 7 sub-indexes, namely economy, entrepreneurship and opportunities, education, health, individual freedom, security and safeguard and social capital, and EPI, which has three important constituents (environmental burden of diseases, water, and air pollution). When countries reduce the level of corruption, these variables, which are the components of the sustainable development level, will undergo a positive change and help the SD level rise.
Table 3: The Relationship of Corruption and Sustainable Development (CPI)
Entire Developing Developed CPI 0.5920 (0.0152) 0.0000 0.2499 (0.0509) 0.0000 0.4707 (0.0502) 0.0000 0.0844 (0.0875) 0.3357 0.4011 (0.0342) 0.0000 0.2849 (0.0680) 0.0000 Democracy 0.1431 (0.0294) 0.0000 0.0893 (0.0269) 0.0011 0.3234 (0.0636) 0.0000 Literacy 0.0393 (0.0020) 0.0000 0.0384 (0.0010) 0.0000 Urban 0.0081 (0.0006) 0.0000 0.0128 (0.0026) 0.0000 -0.0002 (0.0012) 0.8514 Credits 0.0051 (0.0006) 0.0000 0.0037 (0.0003) 0.0000 0.0043 (0.0005) 0.0000 C 2.3292 (0.3292) 0.0000 0.2032 (0.3901) 0.0000 2.5734 (0.2355) 0.0000 0.3773 (0.4008) 0.3475 3.8311 (0.4630) 0.0000 4.8968 (0.7542) 0.0000 Adj.R2 0.48 0.69 0.10 0.45 0.22 0.50 F 507.5825 0.0000 175.0741 0.0000 40.6244 0.0000 41.4670 0.0000 60.0781 0.0000 218.7302 0.0000 Hausman 61.1207 0.0000 162.9312 0.0000 39.4622 0.0000 116.4658 0.0000 5.2195 0.0223 37.7751 0.0000 FCross-Section 11.1415 0.0000 5.9555 0.0000 11.0331 0.0000 7.5961 0.0000 10.3741 0.0000 3.6575 0.0000 Number of observations 545 392 335 248 210 144 Number of countries 109 100 67 63 42 37
Note: Standard errors are in parenthesis. Italic values are p estimations.
When the Democracy, Literacy, Urbanisation and Credit variables as well as CPI are added to the analysis for all countries, the R2 figure rises from 48% to 69%. These four variables obtain the expected mark and are statistically significant even at the 1% significance level. Therefore, the fact that countries attach importance to democratic improvement, healthy urbanisation, increasing the
ESKİŞEHİR OSMANGAZİ ÜNİVERSİTESİ İİBF DERGİSİ
198
literacy rate and the credit amount used by the private sector as well as the reduction of corruption makes a positive contribution capable of raising the level of sustainable development.
When the countries are divided into developing and developed countries according to the estimation results, the effect of corruption on sustainable development differs slightly. When the effect of CPI on SD is examined for developing countries, we find that the R2 figure is 10%. Accordingly, corruption in these countries accounts for only 10% of sustainable development. On the other hand, when other variables are included in the analysis, it is observed that the statistical significance of CPI disappears. When the Democracy, Literacy, Urbanisation and Credit variables are added, the R2 figure rises to 45%. This result, which is obtained for developing countries, suggests the importance of these four variables in raising the level of sustainable development, similarly to their importance in the level of prosperity. On the other hand, when the average SD and CPI figures of these countries are examined, it is also observed that the level of sustainable development is relatively low, while the level of corruption is high. In developed countries, SD is relatively high, and CPI is relatively low14.
The estimation results obtained for developed countries shown in Table 3 indicate higher R2 figures in proportion to those found in developing countries. In developed countries, CPI singly accounts for 22% of SD. When the Democracy, Literacy and Credit variables are added to the model, the R2 figure rises to 0.50. Of these variables, the Democracy and Credit variables obtain the expected mark and exhibit statistical significance even at the 1% significance level. However, the Urbanisation variable does not have the expected mark and is insignificant. Accordingly, it may be mentioned that the level of democracy and private sector credits as well as corruption account for half of the level of sustainable development in developed countries.
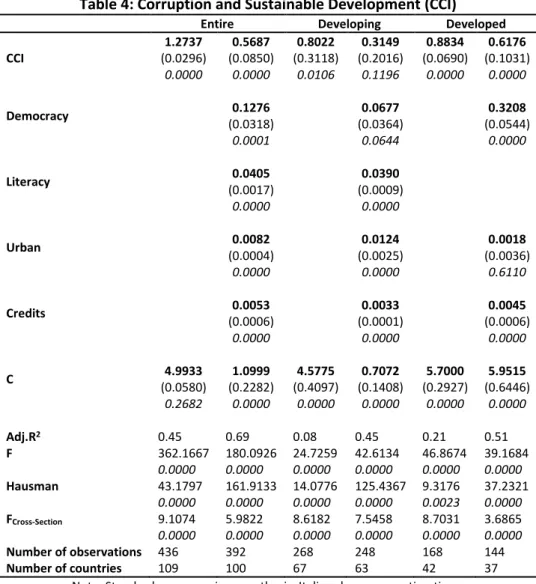
Table 4 shows the estimation results obtained from the analyses made using CCI as the corruption variable. These results exhibit characteristics similar to those obtained from the analyses made using CPI. When all countries are examined in Table 4, CCI accounts for 45% of SD, indicating sustainable development. In other words, corruption represents approximately half of sustainable development, and this ratio is quite significant. When the Democracy, Literacy, Urbanisation and Credit variables are added to the analysis made for all countries, the R2 figure rises to 0.69. These four variables achieve the expected mark and are statistically significant even at the 1% significance level. Accordingly, this result again suggests the importance of reducing corruption, ensuring democratic improvement and
healthy urbanisation, raising the literacy rate and increasing the credit amount used by the private sector.
Table 4: Corruption and Sustainable Development (CCI)
Entire Developing Developed
CCI 1.2737 (0.0296) 0.0000 0.5687 (0.0850) 0.0000 0.8022 (0.3118) 0.0106 0.3149 (0.2016) 0.1196 0.8834 (0.0690) 0.0000 0.6176 (0.1031) 0.0000 Democracy 0.1276 (0.0318) 0.0001 0.0677 (0.0364) 0.0644 0.3208 (0.0544) 0.0000 Literacy 0.0405 (0.0017) 0.0000 0.0390 (0.0009) 0.0000 Urban 0.0082 (0.0004) 0.0000 0.0124 (0.0025) 0.0000 0.0018 (0.0036) 0.6110 Credits 0.0053 (0.0006) 0.0000 0.0033 (0.0001) 0.0000 0.0045 (0.0006) 0.0000 C 4.9933 (0.0580) 0.2682 1.0999 (0.2282) 0.0000 4.5775 (0.4097) 0.0000 0.7072 (0.1408) 0.0000 5.7000 (0.2927) 0.0000 5.9515 (0.6446) 0.0000 Adj.R2 0.45 0.69 0.08 0.45 0.21 0.51 F 362.1667 0.0000 180.0926 0.0000 24.7259 0.0000 42.6134 0.0000 46.8674 0.0000 39.1684 0.0000 Hausman 43.1797 0.0000 161.9133 0.0000 14.0776 0.0000 125.4367 0.0000 9.3176 0.0023 37.2321 0.0000 FCross-Section 9.1074 0.0000 5.9822 0.0000 8.6182 0.0000 7.5458 0.0000 8.7031 0.0000 3.6865 0.0000 Number of observations 436 392 268 248 168 144 Number of countries 109 100 67 63 42 37
Note: Standard errors are in parenthesis. Italic values are p estimations.
The figure on the right side in Figure 6 shows the character of the relationship between CCI and SD clearly. Accordingly, CCI and SD are positively related. When the level of corruption decreases, the level of sustainable development rises. According to Table 4, the effect of CCI on SD is 0.21 in developed countries, whereas it is 0.08 in developing countries. These results are quite close to the results obtained in the analyses made by CPI. When all of the variables are
ESKİŞEHİR OSMANGAZİ ÜNİVERSİTESİ İİBF DERGİSİ
200
examined in the analysis of developing countries, the R2 figure rises to 0.45, as shown in Table 3, and CCI, the corruption variable, loses its significance.
Figure 6: The relationship of CPI, CCI and SD (Entire)
The Democracy variable is significant at the 10% level, whereas the Literacy, Urbanisation and Credit variables have significance even at the 1% significance level. On the other hand, when the Democracy, Urbanisation and Credit variables as well as the CCI variable are added to the model of developed countries, the R2 figure rises to 0.51. These variables achieve the expected mark. All of the variables except the Urbanisation variable are statistically significant. Therefore, corruption, democracy and private sector credits account for more than half of the sustainable development in developed countries.
6. Conclusion
The aim of this study is to analyse the effect of corruption on prosperity and the sustainability of prosperity. The negatively oriented effect of the two separate corruption indexes used in the study on prosperity, which was measured by eight main variables, is quite high. The corruption variables account for more than 70% of prosperity. In other words, in the event that countries reduce their levels of corruption, the level of prosperity would rise considerably. Moreover, approximately half of prosperity and sustainable development, which is derived from the environmental performance indicator, is accounted for by the corruption variables. There is a negatively oriented relationship between these two variables. In other words, when the level of corruption raises, the level of sustainable development decreases considerably. These results suggest the importance of the effect of corruption on prosperity and sustainable development. Therefore, the fact that fighting against corruption is adopted and regarded by all countries will
make a considerably positive contribution to the levels of prosperity and sustainable development of the countries. In addition, this finding indicates how necessary all non-governmental organisations, national governments and international organisations fighting against corruption are and that they should be supported more.
In addition, the estimation results obtained for developing and developed countries indicate that the effect of corruption on prosperity and sustainable development varies by country. The estimation results indicate that the negatively oriented effect of corruption on prosperity and sustainable development is lower in developing countries in comparison with developed countries. In order for developing countries to raise their level of prosperity and sustainable development, they should attach importance to the level of democracy, a literate population, healthy urbanisation and private sector credits as well as corruption because those countries whose level of corruption is relatively high are further behind developed countries in terms of the level of democracy, literacy rate, healthy urbanisation and private sector credits.
It should not be forgotten that corruption, which is widespread in developing countries, has the characteristic of being able to negatively affect the other socio-economic variables that may positively affect prosperity and sustainable development in addition to negatively affecting prosperity and sustainable development because corruption is a disease that threatens all socio-economic variables of countries. Thus, when developing countries reduce their level of corruption, they will have ensured the positively oriented improvement of other socio-economic variables as well as increasing the level of prosperity and sustainable development. Therefore, developing countries must be more enthusiastic and hardworking toward activities conducted for the reduction of corruption and give more support to every national and international initiative that fights against corruption.
ESKİŞEHİR OSMANGAZİ ÜNİVERSİTESİ İİBF DERGİSİ
202
References
Acemoglu, D. and T. Verdier (1998), “Property Rights, Corruption and the Allocation of Talent: A General Equilibrium Approach”, The Economic Journal, 108, 1381–1403.
Aidt, T. S. (2009), “Corruption, Institutions, and Economic Development,” Oxford Review of Economic Policy, 25(2), 271–291.
Aidt, T. S. (2010), “Corruption and Sustainable Development”, CWPE 1061.
Akçay, S. (2006), “Corruption and Human Development”, Cato Journal, 26(1), 29-48.
Amundsen, I. (2006), “Political Corruption”, U4 Issue 6, Chr. Michelsen Institute (CMI), Bergen.
Asheim, G. (2003), “Green National Accounts for Welfare and Sustainability: A Taxonomy of Assumptions and Results”, Scottish Journal of Political Econom, 50 (2), 113–30.
Bakre, O. M. (2007), ‘Money Laundering and Trans-Organised Crime in Nigeria: Collaboration of Local and Foreign Capitalist Elites’, School of Accounting, Finance and Management Working Paper 07/03, University of Essex, Colchester.
Barro, R. J. (2001), “Human Capital and Growth”, The American Economic Review, 91(2), 12-17.
Bentzen, J. S. (2012), “How Bad is Corruption? Cross-country Evidence of the Impact of Corruption on Economic Prosperity”, Review of Development Economics, 16(1), 167-184.
Damania, R., P. G. Fredriksson, and J.A. List (2003), “Trade Liberalization, Corruption, and Environmental Policy Formation: Theory and Evidence”, Journal of Environmental Economics and Management, 46(3), 490-512.
Dasgupta, S., Mody, A., Roy, S. and D. Wheeler (1995) “Environmental Regulation and Development: A Cross-Country Empirical Analysis”, Policy Research Working Paper 1448. World Bank, Washington, D.C.
Gnegne, Y. (2009), “Adjusted net saving and welfare change”, Ecological Economics, 68, 1127-1139.
Greene W. H. (2003). Econometric Analysis, (5th Ed). Upper Saddle River, N.J.: Prentice- Hall.
Griggs, D., M. Stafford-Smith, O. Gaffney, J. Rockström, M. C. Öhman, P. Shyamsundar, W. Steffen, G. Glaser, N. Kanie, and I.. Noble (2013), “Sustainable Development Goals For People and Planet”, Nature, 495, 303-308.
Gruen, C. and S. Klasen (2008), “Growth, Inequality, and Welfare: Comparisons Across Space and Time”, Oxford Economic Papers, 60, 213-236.
Güney, Taner (2014), “Environmental sustainability and pressure groups”, Quality
& Quantity, 1-14, DOI10.1007/s11135-014-0116-6
Hafner, O. (1998), “The Role Of Corruption in The Misappropriation Of Tropical Forest Resources and in Tropical Forest Destruction”, Transparency International Working Paper, www.transparency.org/documents/work-papers (Erişim: 20.03.2014).
Heal, G. M. (1998), Valuing the Future:Economic Theory and Sustainability. New York: Columbia University Press.
Hediger, W. (2000), “Sustainable Development and Social Welfare”, Ecological Economics, 32, 481-492.
Klitgaard, R. (2000), “Subverting corruption”, Finance and Development, www.imf.org/External/Pubs/Ft/Fandd/2000/06/pdf/klitgaar.pdf (Erişim: 16.03.2014).
Lambsdorff, J.G. (1999), “Corruption in Empirical Research- A Review”, 9th International Anti-Corruption Conference, Durban, South Africa, 10-15 December. Leys, C., (1965), “What is the Problem About Corruption”, The Journal of Modern African Studies, 3(02), 215-230.
Lopez, R. and S. Mitra (2000), “Corruption, Pollution, and the Kuznets Environment Curve”, Journal of Environmental Economics and Management, 40, 137-150.
Lui, F. T. (1985), “An Equilibrium Queuing Model Of Bribery”, Journal of Political Economy, 93(4), 760-81.
Mendez, F. and F. Sepulveda (2006), “Corruption, Growth and Political Regimes: Cross Country Evidence”, European Journal of Political Economy, 22, 82– 98. Mo, P. H. (2001), “Corruption and Economic Growth”, Journal of Comparative Economics, 29, 66-79.
Mukherjee, S., and D. Chakraborty (2010), “Is there any Relationship between Environment, Human Development, Political and Governance Regimes? Evidences from a Cross-Country Analysis,” MPRA Paper 19968, University Library of Munich, Germany.
Nye, J. S. (1967), “Corruption and Development: A Cost-Benefit Analysis”, The American Political Science Review, 61(2), 417-427.
ESKİŞEHİR OSMANGAZİ ÜNİVERSİTESİ İİBF DERGİSİ
204
Paldam, M. (2002), “The Cross-Country Pattern Of Corruption: Economics, Culture and The Seesaw Dynamics”, European Journal of Political Economy, 18(2), 215-240.
Parkin, S. (2010), The Positive Deviant, Sustainability Leadership in A Perverse World, London: Earthscan.
Peeters, J. (2012), “The Place Of Social Work in Sustainable Development: Towards Ecosocial Practice”, International Journal of Social Welfare, 21(3), 287– 298.
Pezzey, J. (1992), “Sustainable Development Concepts: An Economic Analysis”, World Bank Environment Paper No. 2, World Bank, Washington, D.C.
Reiter, S.L., and K. H. Steensma (2010), “Human Development and Foreign Direct Investment in Developing Countries: The Influence of FDI Policy and Corruption”, World Development, 38(12), 1678–1691.
Rivera-Batiz, F. L. (2002), “Democracy, Governance and Economic Growth: Theory And Evidence”, Review of Development Economics, 6(2), 225-247.
Solow, Robert M. (1992), “An Almost Practical Step toward Sustainability.” Resources for the Future 40th Anniversary Lecture, Washington, D.C.: Resources for the Future.
Svensson, J. (2005), “Eight Questions about Corruption”, The Journal of Economic Perspectives, 19(3), 19-42.
Tanzi, V. (1998) “Corruption Around the World: Causes, Consequences, Scope and Cures”, IMF Staff Papers, 54 (4), 559-594.
Tavares, J., and R. Wacziarg (2001), “How Democracy Affects Growth”, European Economic Review, 45, 1341-1378.
WCED (1987), Our Common Future, The World Commission on Environment and Development, Oxford University Press, Oxford.
Wei, S., and Y. Wu, (2002), ‘Negative Alchemy? Corruption, Composition of Capital Flows, and Currency Crises’, http://www.nber.org/chapters/ c10642.pdf (Erişim: 01.04.2014).
Welsch, H. (2004), “Corruption, Growth, and The Environment: A Cross-Country Analysis”, Environment and Development Economics, 9, 663-693.
ESKİŞEHİR OSMANGAZİ ÜNİVERSİTESİ İİBF DERGİSİ