Dergi web sayfası:
www.agri.ankara.edu.tr/dergi www.agri.ankara.edu.tr/journalJournal homepage:
TARIM BİLİMLERİ DERGİSİ
—
JOURNAL OF AGRICUL
TURAL SCIENCES
23 (2017) 34-41
Inheritance of Some Agronomic Characters in Pea
Duran ŞİMŞEKa, Ercan CEYHANb
aBircan Seed Company, Antalya, TURKEY
bSelçuk University, Faculty of Agriculture, Department of Field Crops, Konya, TURKEY ARTICLE INFO
Research Article
Corresponding Author: Ercan CEYHAN, E-mail: [email protected], Tel: +90 (332) 223 28 56 Received: 16 October 2014, Received in Revised Form: 01 October 2015, Accepted: 06 October 2015
ABSTRACT
This study was conducted by using Jinks-Hayman type analyses on four pea genotypes (PS4009, PS3053, PS3073 and Reyna) and their population of the complete diallel reciprocal crosses in order to examine the genetic structure. According to the results of all diallel crosses, environmental variance (E) and additive gene variance (D) was not significant. All the features of the dominant gene variances were higher than the additive gene variances (H1) and D-H1
value was found to be negative. In the population, dominant genes were found significant for all the characteristics except number of seed per pod. Result of Wr, Vr graphics indicated partial dominancy for the number of seed per pod, and over dominancy for the rest of the characters studied.
Keywords: Agronomic characters; Diallel; Inheritance; Pea
Bezelyede Bazı Agronomik Özelliklerin Kalıtımı
ESER BİLGİSİ
Araştırma Makalesi
Sorumlu Yazar: Ercan CEYHAN, E-posta: [email protected], Tel: +90 (332) 223 28 56 Geliş Tarihi: 16 Ekim 2014, Düzeltmelerin Gelişi: 01 Ekim 2015, Kabul: 06 Ekim 2015
ÖZET
Bu araştırma, dört bezelye genotipi (PS4009, PS3053, PS3073 ve Reyna) ile bunların tam diallel melezlerinden oluşturulan populasyonun Jinks-Hayman tipi analiz kullanarak genetik yapısını incelemek amacı ile yapılmıştır. Diallel melez sonuçlarına göre incelenen tüm özelliklerde çevre varyansı (E) ve eklemeli gen varyansı (D) önemsiz bulunmuştur. Tüm özelliklerinde dominant gen varyansları (H1) eklemeli gen varyanslarından yüksek olup, buna paralel olarak D-H1 değerleri ise negatif bulunmuştur. Populasyonda baklada tane sayısı üzerine resesif genler, bitki boyu, bakla sayısı, yüz tane ağırlığı, bakla verimi ve tane verimi özelliklerine ise dominant genlerin daha etkili olduğu tespit edilmiştir. Wr, Vr grafikleri sonucu baklada tane sayısı için kısmi dominantlık, incelenen diğer özelliklerde ise aşırı dominantlık saptanmıştır.
Anahtar Kelimeler: Agronomik özellikler; Diallel; Kalıtım; Bezelye
1. Introduction
Sources of proteins have undeniable importance in human nutrition. As a leguminous plant, peas are considered a good source of protein and contain 20-30% protein; sufficient carbohydrates; rich in calcium, iron, phosphorus and vitamins (Ceyhan et al 2011). Considering worldwide consumption, human nutrition were made of 22% vegetable proteins, 7% carbohydrates and animal nutrition of 38% proteins and 5% carbohydrates are derived from edible legumes (Sehirali 1988; Adak et al 2010). Thus, peas have a big importance on canned and frozen food industry as a human nutrition.
Success in developing varieties depends on range of variation and right selection from the variations. Pea breeders often make crosses to create new variations. But lack of labor, time, high costs etc. are limiting factors to make numerous crosses. That’s why breeders need to choose accurate parental lines to avoid extra expenses and long working hours. Success rate could be higher if the genetic inheritance of parental lines would be identified earlier with different methods. Breeder needs to know effects of the genes on the agronomic characters of interests. Inheritance of genes governing the trait of interest determines the generation for selection in breeding a self-pollinated plant species like peas (Ceyhan & Avci 2004).
Various methods are used in determination of the genetic parameters. With the help of these genetic parameters, information is obtained about the status of the population, the value of a feature to breeding and the effectiveness of the selection. Diallel crossing is one of these methods (Ceyhan & Kahraman 2013). Seed yield and its genetic parameters and heritability were the subject of many researches (Snoad & Arthur 1974; Ceyhan et al 2008; 2014b; Ceyhan & Kahraman 2013).
In this work, a 4x4 complete diallel reciprocal combinations of parents and populations was studied by using Jinks-Hayman type analysis to identify and the genetic structure of agricultural features.
2. Material and Methods
In this study, three pure pea lines (PS4009, PS3053, PS3073) and Reyna a commercial variety were
used. The study was conducted at Selcuk University experimental field in 2012 and 2013. The parental lines were planted on 8 March 2012, followed by five consecutive plantings at 10 days intervals in order to coincide flowering times of the genotypes. For the ease of crossing, parental lines were planted in 3x1 m rows 25 cm apart. The four genotypes were crossed in a 4x4 complete diallel reciprocal according to Eser (1974) and Ceyhan (2003) in 2012.
Soil analysis was made from the soil that was taken from 0-30 cm depth. The results revealed that soil was a clay-loam, light alkaline (pH= 7.8), low in organic matter (1.20%), and has an EC (µS cm-1) of 189, available P2O5 of 10.74 mg kg-1, Fe of 1.28 mg kg-1, and exchangeable K
2O of 219.96 mg kg-1, Zn of 2.16 mg kg-1, Cu of 0.82 mg kg-1, Mn of 4.95 mg kg-1, and Ca of 5863 mg kg-1.
The study was conducted in Konya where summers are hot and dry and winters are cold. During the vegetation in 2013 for 5 months (March through July) average temperature was 19.5 oC, total rain 63.4 mm, humidity 39.7%.
Parental lines and crosses were planted by hand on March 2013 as three rows 2 m in length with a 50 cm row spacing and 20 cm plant spacing, each plot had 36 seeds which were planted 5 cm deep. Trials were made by “Randomized Block Design’’ in 3 replicates at Selcuk University Agricultural Department Trial Station. Plots were fertilized with 15 kg DAP (Diammonium phosphate 18-46%) at planting (Ceyhan 2003; Ceyhan et al 2014a). To reinforce the germination after the planting, sprinkle irrigation was used, and by drip irrigation system twice during growing period. Plots were hand-weeded and harvesting was made by hand between 03 and 14 July 2013.
At the parental lines and F1 plants, plant height, number of pod, number of seed per pod, 100 seed weight, pod yield and seed yield were studied (Ceyhan 2003). Mean values were used to analyze the variation. In the study, the traits under the genetic control were analyzed by Jinks & Hayman (1953) diallel method. After detecting significant statistical differences between parents and among the crosses, validity of hypothesis was checked (Hayman 1954).
The parameters for genetic variation and regression analysis of Wr and Vr values of parents were made according to Jinks & Hayman (1953) and Hayman (1954) diallel analysis method. Statistical analysis was made by using TARPOPGEN statistical package programme (Özcan & Açıkgöz 1999).
3. Results and Discussion
Analysis of variance results were shown in Table 1. To apply the Jinks-Hayman type analysis, the validity of the assumption was checked first. All the measurement made from 4x4 peas complete diallel reciprocal were found to be significant at P= 0.01
level. Results indicated the presence of large enough variation in order to proceed to advanced genetic analysis (Jinks & Hayman 1953; Hayman 1954; Jinks 1954; Ceyhan & Kahraman 2013).
To apply Jinks-Hayman type diallel analysis some of the assumptions have to be valid. Validation of these assumptions (Yildirim et al 1979) was checked in 2 ways. The Wr, Vr variance analysis results are given in Table 2. The F values deduced from Wr-Vr variance analysis of F1 populations was found not significant, indicating that Wr, Vr variation differences are uniform. Thus, means of the three replications were used to do genetic analysis. Table 1- Mean sum of squares of the measurements
Çizelge 1- İncelenen özelliklere ait kareler ortalaması
Sources SD Plant height Number of pod Number of seed per pod 100 seed weight Pod yield Seed yield
Block 2 178.938 1.021 0.023 3.559 0.764 2.710
Genotype 15 357.950** 144.421** 0.728** 38.138** 78.894** 78.914**
Error 30 94.071 9.888 0.196 2.558 5.708 3.935
**, P<0.01
Table 2- Sum of squares for Wr, Vr variances
Çizelge 2- İncelenen özelliklere ait Wr, Vr varyans analizi kareler ortalaması
Sources SD Plant height Number of pod Number of seed per pod 100 seed weight Pod yield Seed yield
Replication 2 4307.043 118.231 0.079 61.171 5.788 57.197
Series 3 8162.156 1368.434 0.138 219.802 151.596 174.993
Error 6 14365.334 155.353 0.062 95.980 105.576 71.583
Wr, Vr regression values detected with regression analysis and t values calculated for b= 1 hypothesis are presented at Table 3. The average regression values and t values obtained from b= 1 hypothesis showed that b= 1 hypothesis is suitable.
3.1. Genetic structure of the population
Variance components estimated by Jinks-Hayman method and standard errors are shown in Table 4. In this research environmental variance and additive gene variance were found to be not significant. This result shows that selection would not be successful for the traits studied, similar
Table 3- Regression values calculated from means (Wr,Vr) of the blocks and t values calculated for b= 1 hypothesis
Çizelge 3- Bloklar üzerinden alınmış ortalama (Wr, Vr) değerleri arasındaki regresyon katsayıları ve b= 1 hipotezi için hesaplanan t değerleri
Features b SH t1
Plant height 0.503 0.253 1.965
Number of pod 0.704 0.289 1.025
Number of seed per pod 0.449 0.193 2.853
100 seed weight 1.203 0.624 -0.325
Pod yield 0.769 0.351 0.658
results were reported before (Sarawat et al 1994; Ceyhan & Kahraman 2013).
Of all the traits studied, dominant gene variances (H1) was higher than the additive gene variances, and D-H1 was negative (Table 4). Similar results were reported elsewhere (Snoad & Arthur 1974; Sarawat et al 1994; Girase & Deshmukh 2000; Ceyhan & Kahraman 2013).
F value that shows direction of recessive and dominant alleles was found to be positive except for the number of pod (Table 4). This indicates dominant and additive gene effects of allels are together and in increasing direction (Yildirim et al 1979; Ceyhan & Kahraman 2013). Positive F value shows that dominant alleles outnumbers the recessive alleles. For the number of seed per pod negative F value opposite effect of above mentioned condition (Yildirim et al 1979; Ceyhan & Kahraman 2013).
The average degree of dominancy (H1/D)1/2 indicates the degree of the domination in a population (Table 4). All the data collected in this study, (H1/D)1/2 value was higher than 1 that may mean the population may have over dominancy
(Snoad & Arthur 1974; Ceyhan et al 2008; 2014a; 2014b; Ceyhan & Kahraman 2013).
Dominant and recessive alleles (H2/4H1) showed similar frequencies for seed yield (0.20) and number of seed per pod (0.34) (Table 4). This may indicate that dominant and recessive alleles frequencies are close to each other (0.5), and multiplication of dominant and recessive alleles frequencies would be around 0.25, a high enough value for successful phenotypic selection (Ceyhan & Kahraman 2013).
Ratio of dominant alleles to recessive alleles (KD/KR) for number of seed per pod was lower than 1 (0.77), indicating number of recessive alleles outnumbers dominant alleles (Table 4). For the remaining characters studied, KD/KR value was higher than 1, a strong indication that genes operating on these traits are dominant (Ceyhan & Kahraman 2013). Another factor that was examined in this research which, this means features manages. Therefore in research population, except pea count other features were more dominant than recessive genes.
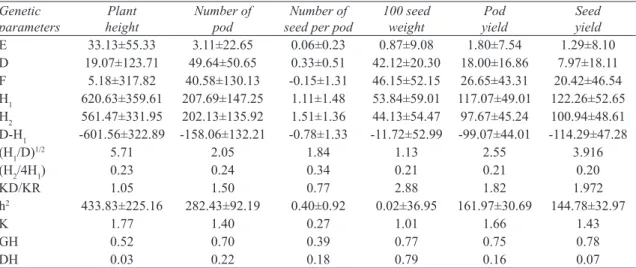
For the effective number of genes (K), all the traits, except number of seed per pod, had K>1 Table 4- Variance components of the 4x4 complete diallel pea cross populations
Çizelge 4- 4x4 tam diallel bezelye melez populasyonlarında bazı agronomik özelliklerin genetik varyans komponentleri ve bunlar arasındaki oranlar
Genetic
parameters heightPlant Number of pod seed per podNumber of 100 seed weight yieldPod Seed yield
E 33.13±55.33 3.11±22.65 0.06±0.23 0.87±9.08 1.80±7.54 1.29±8.10 D 19.07±123.71 49.64±50.65 0.33±0.51 42.12±20.30 18.00±16.86 7.97±18.11 F 5.18±317.82 40.58±130.13 -0.15±1.31 46.15±52.15 26.65±43.31 20.42±46.54 H1 620.63±359.61 207.69±147.25 1.11±1.48 53.84±59.01 117.07±49.01 122.26±52.65 H2 561.47±331.95 202.13±135.92 1.51±1.36 44.13±54.47 97.67±45.24 100.94±48.61 D-H1 -601.56±322.89 -158.06±132.21 -0.78±1.33 -11.72±52.99 -99.07±44.01 -114.29±47.28 (H1/D)1/2 5.71 2.05 1.84 1.13 2.55 3.916 (H2/4H1) 0.23 0.24 0.34 0.21 0.21 0.20 KD/KR 1.05 1.50 0.77 2.88 1.82 1.972 h2 433.83±225.16 282.43±92.19 0.40±0.92 0.02±36.95 161.97±30.69 144.78±32.97 K 1.77 1.40 0.27 1.01 1.66 1.43 GH 0.52 0.70 0.39 0.77 0.75 0.78 DH 0.03 0.22 0.18 0.79 0.16 0.07
values (Table 4). This may show that value of K depends largely on dominancy. It was reported that K value is associated with dominancy and K is underestimated in cases where there is weak dominant effect on traits (Jinks 1954; Yildirim 1974; Ceyhan & Kahraman 2013).
Narrow sense (DH) and broad sense heritabilities (GH) have also been evaluated (Table 4). Low DH values were evident on all traits but 100 seed weight, indicating a low response to selection. The DH for 100 seed weight was 0.79, which would be rather responsive to selection.
3.2. Analysis of Wr, Vr graphics
The Wr and Vr values of parents derived from the means of the 3 blocks are presented in Figure 1 to 6. The regression line for number of seed per pod cut through the Wr on positive side (above 0), indicating presence of a partial dominance for the trait. For all other traits studied, the regression line cut Wr on the negative region, showing over dominancy are in effect. Ceyhan & Kahraman (2013) reported that hundred seed weight was under the control of partial dominant genes while seed yield, plant height, and number of pod were under control of over dominant genes.
Figure 1- Wr, Vr values for the plant height of parents
Şekil 1- Bitki boyu için ebeveynlere ilişkin Wr, Vr değerleri
Figure 2- Wr, Vr values for the number of pod per plant of parents
Şekil 2- Bakla sayısı için ebeveynlere ilişkin Wr, Vr değerleri
Figure 3- Wr, Vr values for number of seed per pod of parents
Şekil 3- Baklada tane sayısı için ebeveynlere ilişkin Wr, Vr değerleri
Figure 4- Wr, Vr values for hundred seed weight of parents
Şekil 4- Yüz tane ağırlığı için ebeveynlere ilişkin Wr, Vr değerleri
Figure 5- Wr, Vr values for pod yield of parents Şekil 5- Bakla verimi için ebeveynlere ilişkin Wr, Vr değerleri
Figure 6- Wr, Vr values for the seed yield of parents Şekil 6- Tane verimi için ebeveynlere ilişkin Wr, Vr değerleri
At the parental lines shortest plant height were 33.33 cm for PS4009 and PS3073 lines while tallest were Reyna with 46.33 cm. And the shortest hybrid was 42.33 cm (PS3053 x PS3073), and the tallest was 69.00 cm (PS4009 x PS3053) (Table 5).
In terms of plant height, there is no epistatic effect in parental genotypes PS4009, PS3073, and Reyna because they were close to the regression line, while PS3053 was far from regression line, indicative of an epistatic effect in action. Because PS4009 was far from the origin, it transfers recessive gene to crosses. A negative correlation (r= -0.613) was found between the hypothetic dominance (Wr+Vr) of parents and the average value of the ancestors.
When average number of pod of parents was examined, PS3073 parent had the lowest with 9.00 and Reyna the highest with 26.33. While the PS4009 x PS3053 cross had 21.67 the lowest, and Reyna x PS3053 cross 36.67 the highest (Table 5).
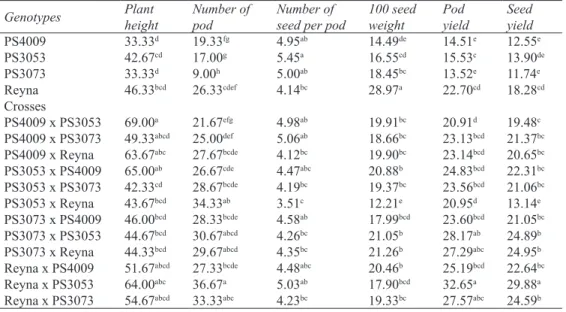
There is an epistatic effect for number of pod in PS4009 and Reyna. The crosses originating from parents with high pot numbers resulted with higher pod numbers. The correlation between hypotetical Table 5- Agronomic values of the 4x4 full diallel pea cross populations
Çizelge 5- 4x4 tam diallel bezelye melez populasyonlarında bazı agronomik özelliklere ait değerler
Genotypes Plantheight Number ofpod Number ofseed per pod 100 seedweight Podyield Seedyield
PS4009 33.33d 19.33fg 4.95ab 14.49de 14.51e 12.55e PS3053 42.67cd 17.00g 5.45a 16.55cd 15.53c 13.90de PS3073 33.33d 9.00h 5.00ab 18.45bc 13.52e 11.74e Reyna 46.33bcd 26.33cdef 4.14bc 28.97a 22.70cd 18.28cd Crosses PS4009 x PS3053 69.00a 21.67efg 4.98ab 19.91bc 20.91d 19.48c PS4009 x PS3073 49.33abcd 25.00def 5.06ab 18.66bc 23.13bcd 21.37bc
PS4009 x Reyna 63.67abc 27.67bcde 4.12bc 19.90bc 23.14bcd 20.65bc
PS3053 x PS4009 65.00ab 26.67cde 4.47abc 20.88b 24.83bcd 22.31bc
PS3053 x PS3073 42.33cd 28.67bcde 4.19bc 19.37bc 23.56bcd 21.06bc
PS3053 x Reyna 43.67bcd 34.33ab 3.51c 12.21e 20.95d 13.14e
PS3073 x PS4009 46.00bcd 28.33bcde 4.58ab 17.99bcd 23.60bcd 21.05bc
PS3073 x PS3053 44.67bcd 30.67abcd 4.26bc 21.05b 28.17ab 24.89b
PS3073 x Reyna 44.33bcd 29.67abcd 4.35bc 21.26b 27.29abc 24.95b
Reyna x PS4009 51.67abcd 27.33bcde 4.48abc 20.46b 25.19bcd 22.64bc
Reyna x PS3053 64.00abc 36.67a 5.03ab 17.90bcd 32.65a 29.88a
dominance and mean values of parents was negative (r= -0.947). This shows that they carry the dominant genes of high pot number.
When number of seed per pod was examined, Reyna had 4.14 peas the lowest, and PS3053 had 5.45 peas the highest counts. The PS3053 x Reyna cross possessed 3.51 peas while PS4009 x PS3073 cross had 5.06 peas per pod (Table 5).
For the number of seed per pod, the parents PS4009 and PS3073 had epistatic effects. Analysis (Wr+Vr) indicated that the lower number of peas per pot was dominant in action (r= 0.582).
The 100 seed weight ranged from 14.49 g (PS4009) to 28.97 g (Reyna) where PS3053 x Reyna cross had the lowest 100 seed weight with 12.21 g and PS3073 x Reyna cross the highest with 21.26 g (Table 5). The lower hundred seed weight trait (i.e. smaller seed size) was found to be dominant (r= 0.845).
When approximate pod yield was examined, PS3073 parent and PS4009 x PS3053 cross had the lowest pod yields with 13.52 g and 22.91 g while Reyna parent and Reyna x PS3053 cross the highest with 22.70 g and 32.65 g, respectively (Table 5). Genetic analysis (Wr+Vr) showed that high pod yield was dominant (r= -0.701).
The seed yield of parents ranged from 11.74 g (PS3073) to 18.28 g (Reyna) and crosses from 13.14 g (PS3053 x Reyna) to 29.88 g (Reyna x PS3053) (Table 5). All of the parents except the PS4009 showed epistatic effect for seed yield. The parents with PS4009 and Reyna transferred dominant genes to the crosses while the parent with PS3073 transferred recessive gen. The negative correlation (r= -0.633) between the theoretical dominance (Wr+Vr) and means of the values in the population implied having dominant genes of the parents that are high yielded.
4. Conclusions
A large enough genetic variation exists for the traits studied in the population. It was concluded that recessive genes for number of seed per pod, and
dominant genes for plant height, number of pod, 100 seed weight, pod yield and seed yield are in action. The presence of high DH for hundred seed weight shows that genetic gains are possible at early generation selection for the trait.
Acknowledgements
This work is project financially supported by the Selçuk University Scientific Research Projects (BAP), Konya, Turkey.
References
Adak M S, Güler M & Kayan N (2010). Yemeklik baklagillerin üretimini artırma olanakları. Ziraat
Mühendisliği VII. Teknik Kongresi, 11-15 Ocak,
Ankara, Türkiye, pp. 329-341
Ceyhan E (2003). Determination of some agricultural characters and their heredity though line x tester method in pea parents and crosses. PhD Thesis, Selcuk University (Unpublished), Konya, Turkey Ceyhan E & Avci M A (2004). Bezelye melezlerinde bazı
agronomik özellikler için tek dizi analiziyle genotipik değerlendirme. Selçuk Üniversitesi Ziraat Fakültesi
Dergisi 19(36): 13-17
Ceyhan E & Kahraman A (2013). Genetic analysis of yield and some characters in peas. Legume Research
36: 273-279
Ceyhan E, Avci M M & Karadas S (2008). Line x tester analysis in pea (Pisum sativum L.): Identification of superior parents for seed yield and its components.
African Journal of Biotechnology 7: 2810-2817
Ceyhan E, Kahraman A, Karadas S, Avcı M A & Onder M (2011). Yemeklik bezelye (Pisum sativum L.)
genotiplerinin Konya ekolojik koşullarında bazı tarımsal özelliklerinin belirlenmesi. Türkiye IX. Tarla
Bitkileri Kongresi, 12-15 Eylül, Bursa, Türkiye, Cilt:
1, pp. 659-664
Ceyhan E, Harmankaya A & Kahraman A (2014a). Combining ability and heterosis for concentration of mineral elements and protein in common bean (Phaseolus vulgaris L.). Turkish Journal of
Agriculture & Forestry 38: 581-590
Ceyhan E, Kahraman A, Avci M A & Dalgic H (2014b). Combining ability of bean genotypes estimated by line x tester analysis under highly-calcareous soils.
The Journal of Animal and Plant Sciences 24:
579-584
Eser D (1974). Yemeklik Tane Baklagillerde Çiçek Yapısı ve Melezleme Tekniği. Çayır-Mera ve Zootekni Araştırma Enstitüsü Yayın No: 46, Ankara
Girase V S & Deshmukh R B (2000). Gene action for yield and its components in chickpea. Indian Journal
of Genetics 60: 185-186
Hayman B I (1954). The theory and analysis of diallel crosses. Genetics 39: 789-809
Jinks J L (1954). The analysis of continuous variation in a diallele cross of Nicotiana rustica varieties. Genetics
39: 767-788
Jinks J L & Hayman B I (1953). The analysis of diallele crosses. Maize Cooperation Newsletter 27: 48-54
Özcan K & Açıkgöz N (1999). Populasyon genetiği için bir istatistik paket program geliştirmesi. 3. Tarımda
Bilgisayar Uygulamaları Sempozyumu, 3-6 Ekim,
Adana, Turkiye
Sarawat P, Stoddard F L & Marshall D R (1994). Genetic distance and its association with heterosis in peas.
Euphytica 73: 255-264
Sehirali S (1988). Yemeklik Dane Baklagiller. Ankara Üniversitesi Ziraat Fakültesi Yayınları: 1089, Ders Kitabi: 314, Ankara
Snoad B & Arthur A E (1974). Genetically studies of quantitative characters in peas. 3. Seed and seedling characters in the F2, of a six-parent diallele set of crosses. Euphytica 23: 105-113
Yildirim M B (1974). Beş ekmeklik buğday çeşidinin diallel melez döllerinde bazı tarımsal özelliklerin populasyon analizleri. Doçentlik tezi, Ege Üniversitesi, Ziraat Fakültesi, İzmir, Türkiye
Yildirim M B, Öztürk A, Ekiz F & Püskülcü H (1979). Bitki Islahinda İstatistik-Genetik Yöntemler. Ege Bölge Zirai Araştırma Enstitüsü, İzmir