İSTANBUL BİLGİ UNIVERSITY
INSTITUTE OF SOCIAL SCIENCES
MA PROGRAM IN INTERNATIONAL POLITICAL ECONOMY
GENDER WAGE GAP IN THE TURKISH LABOR MARKET
MA Thesis by
BERNA DOĞAN
İSTANBUL BİLGİ UNIVERSITY
INSTITUTE OF SOCIAL SCIENCES
MA PROGRAM IN INTERNATIONAL POLITICAL ECONOMY
GENDER WAGE GAP IN THE TURKISH LABOR MARKET
M.A. Thesis by
BERNA DOĞAN
Supervisor: Prof. Dr. Nurhan Yentürk
GENDER WAGE GAP IN THE TURKISH LABOR MARKET
TÜRK İŞGÜCÜ PİYASASINDA CİNSİYETE DAYALI ÜCRET FARKLILIKLARI by
Berna Doğan
Submitted to the Institute of Social Sciences of İstanbul Bilgi University in partial fulfillment of the requirements for the degree of Master of Art in International Political Economy.
I certify that this thesis satisfies all the requirements as a thesis for the degree of Master of Arts. ………. Prof. Dr. Asaf Savaş Akat
Head of the Program
This is to certify that we have read this thesis and that in our opinion it is fully adequate, in scope and quality, as a thesis for the degree of Master of Arts.
……….
Prof. Dr. Nurhan Yentürk Supervisor
Dissertation Committee Members
Prof. Dr. Ertuğrul Ahmet Tonak (IBU, Economics)..………
Prof. Dr. Nurhan Yentürk (IBU, Economics)…….………
I hereby declare that all information in this document has been obtained and presented in accordance with academic rules and ethical conduct. I also declare that, as required by these rules and conduct, I have fully cited and referenced all material and results that are not original to this work.
iv ABSTRACT
The aim of this study is to explore the causes and the extent of the gender wage gap in the Turkish labor market. For this purpose, standard wage regressions are estimated using micro data from an official survey for the year 2006. A number of variables in the dataset enable a comprehensive quantitative analysis including both human capital variables and job-related variables. Furthermore, in order to examine the wage gap in detail, Oaxaca decomposition method is employed. Decomposing the differential into two components enables to understand whether the gap is caused by the differences in human capital endowments or by the discrimination in the labor market. Using the abovementioned raw data we find a very slight wage gap in favor of women. But, the discrimination component of 46.5 per cent is substantially high.
Keywords: female labor force participation, gender wage gap, Oaxaca decomposition,
v ÖZET
Bu çalışmanın amacı Türk işgücü piyasasında cinsiyete dayalı ücret farklılıklarının nedenlerini ve boyutlarını araştırmaktır. Bu amaçla, 2006 yılı için resmi anket sonuçlarından derlenen mikro veri kullanılarak standart ücret regresyonları tahmin edilmiştir. Veri setinde yer alan çok sayıda değişken, beşeri sermaye ve işe ilişkin veriler üzerinden kapsamlı bir nicel analizi mümkün kılmıştır. Bunun yanı sıra, ücret farkının daha detaylı olarak incelenmesi için Oaxaca ayrıştırma yöntemi kullanılmıştır. Ücret farkının iki bileşene ayrıştırılması, bu farkın beşeri sermaye donanımındaki farklardan mı yoksa işgücü piyasasındaki ayrımcılıktan mı kaynaklandığının anlaşılmasını sağlar. Yukarıda bahsedilen ham veriyi kullanarak, kadınlar lehine çok küçük bir ücret avantajı bulduk. Fakat bulduğumuz yüzde 46.5 oranındaki ayrımcılık bileşeni önemli ölçüde yüksektir.
Anahtar Kelimeler: kadınların işgücüne katılımı, cinsiyete dayalı ücret farklılıkları, Oaxaca
vi ACKNOWLEDGEMENTS
My greatest gratitude goes to Nurhan Yentürk; for her high confidence in me at a moment when I thought everything was over. Without her belief in me and great motivation this work could not be completed.
I am also most grateful to the distinguished faculty of the International Political Economy program of İstanbul Bilgi University for introducing me with the broad and critical approach to the study of economics. I would like to express my special thanks to Ahmet Tonak and Hakan Arslan for their invaluable support for my future studies.
Finally, I would like to express my appreciation for my parents for their patience and generosity throughout this challenging period. I am also thankful to TUBITAK for providing the financial support during my studies.
vii
TABLE OF CONTENTS
Page #
STATEMENT OF AUTHORSHIP ... iii
ABSTRACT ... iv ÖZET ... v ACKNOWLEDGEMENT ... vi LIST OF TABLES ... ix LIST OF FIGURES ... x 1. INTRODUCTION ... 1
2. AN OVERVIEW OF THE FEMALE LABOR FORCE PARTICIPATION AND WAGE TRENDS ... 3
2.1 Worldwide Trends ... 3
2.1.1 Female Labor Force Participation in the Post-War Period ... 3
2.1.2 The Evolution of Female Wages ... 13
2.2 Turkish Case ... 18
2.1.1 Female Labor Force Participation in the Post-War Period ... 18
2.1.2 The Evolution of Female Wages ... 28
3. AN OVERVIEW OF THE GENDER WAGE GAP ... 33
3.1 Setting the Theoretical Framework ... 33
3.1.1 Supply-Side Explanations ... 33
3.1.2 Demand-Side Explanations ... 36
3.1.3 Occupational Segregation ... 38
3.2 Empirical Studies ... 40
3.2.1 Gender Wage Gap Within and Across Countries ... 40
3.2.2 Gender Wage Gap in Turkey ... 46
4. ANALYSIS OF THE GENDER WAGE GAP ... 54
viii 4.2 Methodology ... 59 4.3 Findings ... 64 5. CONCLUSION ... 73 REFERENCES ... 76 APPENDIX A ... 85 APPENDIX B ... 87
ix LIST OF TABLES
Page #
Table 2.1 Female Labor Force Status by Educational Level ... 24
Table 2.2 Occuptaional and Industrial Distribution of Women and Men in Turkish Labor Market, (2006) ... 27
Table 2.3 Female-to-Male Wages in Manufacturing (per cent) ... 29
Table 2.4 Annual Average Gross Earnings by Sex, (2006) ... 30
Table 4.1 Descriptive Statistics ... 56
Table 4.2 Occupational and Industrial Segregation by Sex ... 58
Table 4.3 Human Capital Based Wage Regressions (Model 1) ... 64
Table 4.4 Human Capital Based Wage Regressions (Model 2) ... 65
Table 4.5 Wage Regressions for Expanded Model (Model 3) ... 66
Table 4.6 Oaxaca Decomposition with Basic Model ... 70
Table 4.7 Oaxaca Decomposition with Expanded Model ... 71
x LIST OF FIGURES
Page #
Figure 2.1 Decomposition of Female Labor Force by Age, (1960-2009) ... 8
Figure 2.2 Trends Followed by Cohorts, (1960-2009) ... 10
Figure 2.3 Female Labor Force Participation in Selected Countries, (1980-2009) ... 11
Figure 2.4 Female Labor Force Participation in OECD-Total, (1960-2009) ... 12
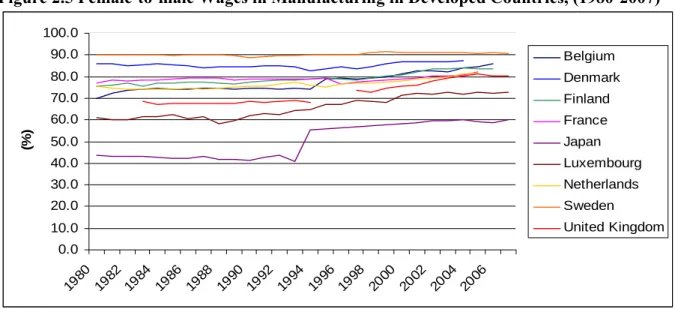
Figure 2.5 Female-to-Male Wages in Manufacturing in Developed Countries, (1980-2007) ... 14
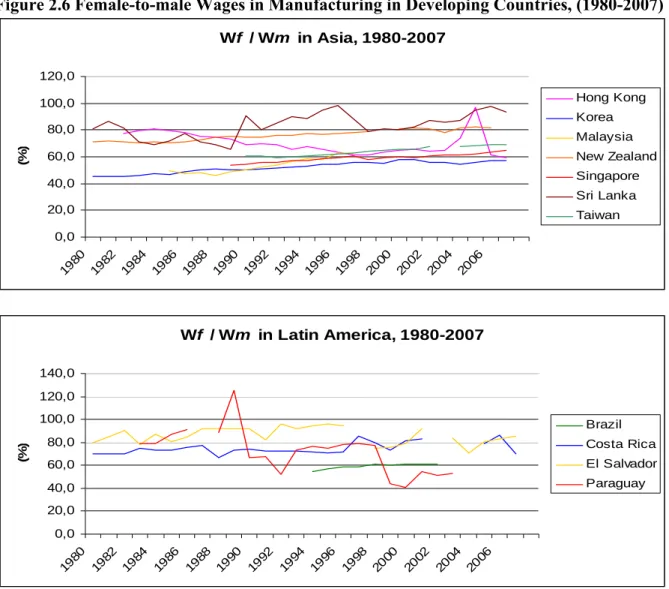
Figure 2.6 Female-to-Male Wages in Manufacturing in Developing Countries, (1980-2007) ... 15
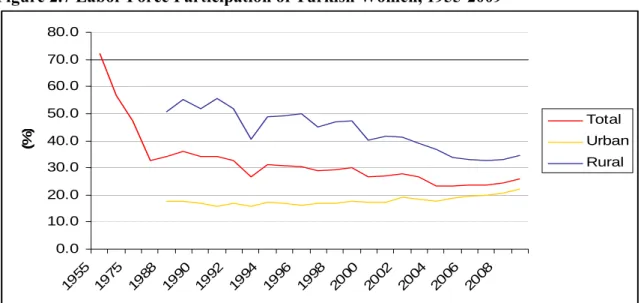
Figure 2.7 Labor Force Participationof Turkish Women, (1955-2009) ... 18
1 1. INTRODUCTION
The gender wage gap is one of the most important indicators of the gender inequalities in the labor market. International Labor Organization (ILO) statistics verify that female wages are lower than that of male in every country. In the post-World War 2 period the ratio of female-to-male wages followed an increasing path. Yet neither the expanding antidiscrimination legislations nor the significant rise in female labor force participation led to closing the gap. A narrowed gender wage gap still persists in most labor markets.
In spite of the general improvement of the female wages, Turkey is one of the few countries with a deteriorating gender wage gap. In the post-1980 period, dramatic economic, social, and cultural changes profoundly affected the decisions of women related to labor force participation, and their wages. But in overall terms, both followed decreasing trends. According to the official statistics the difference between female and male wages is 0.21 in 2006 (TURKSTAT). This study attempts to understand the underlying reasons of this growing gender wage differentials in Turkey.
The paper starts with a historical overview of both labor force participation and wages of women. Most studies on this subject start the analysis from late 1970s and early 1980s which are considered as the beginning of the globalization. In our opinion, however, such a historical evaluation should be traced back to World War 2. Because, investigating the past of the
2
developed market economies, the strongest momentum to shift from traditional one-earner family to double-earner family model was experienced during the World War 2. Therefore, Section 2 of this study covers a period from the end of the War to today. In order to provide a comparative analysis, first worldwide trends, then Turkish case is examined.
In the third section, the literature on gender wage gap is reviewed. First, theoretical framework is discussed, and both economic and sociological approaches are briefly argued. In the second part of this section, the findings of empirical works on the topic are evaluated. Earlier empirical studies focus on human capital endowment differences between women and men as the source of wage differentials. The examination of education and experience within the context of family responsibilities were believed to provide an explanation for the difference between women’s wages and men’s wages. Nonetheless, subsequent usage of firm-level data enabled more comprehensive analyses. Inclusion of a wider set of variables such as occupation, industry, sector, firm size, collective bargaining coverage provided a better understanding of the underlying causes of gender wage gap. Therefore, a wide range of literature covered in this section. Finally, empirical studies with a focus on Turkish labor market are examined.
Fourth section of this study is the empirical part. In line with the recent empirical, studies, factors of the wage differentials between women and men are analyzed via wage regressions. Regressions include both individual- and firm-level data. So, the effects of individual differences in human capital endowments and labor market characteristics are explored. Besides estimating wage regressions, Oaxaca decomposition is used to distinguish the portions of the gender wage gap that is explained whether by returns to human capital endowments and gender discrimination against women.
3
2. AN OVERVIEW OF THE FEMALE LABOR FORCE PARTICIPATION AND WAGE TRENDS
This section provides an historical overview of female labor force participation and of female wages. The majority of historical evaluations of the issue start from late 1970s and early 1980s which are considered as the beginning of the globalization. In my opinion, however, such a historical evaluation should be traced back to World War 2. Because, the investigation of the past of the developed countries reveals that the strongest momentum to shift from traditional one-earner families to double-one-earner family model was experienced during the World War 2. Therefore, in this section the period starting by the end of World War 2 is analyzed in detail. First, worldwide trends are explored. In the second part of the section, the trends are examined for the case of Turkey.
2.1. Worldwide Trends
2.1.1. Female Labor Force Participation in the Post-War Period
Although, the years following the Second World War were prominently called ‘the Golden Age’, they were not ‘that’ golden when it is women in question. Demand for female labor sharply rose during the war, as men were mobilized for the armed forces. But, after the War, as men returned to the civilian labor force, women had to return their homes. Following the end of wartime emergency, there was a great desire to return back to normality, including ‘traditional roles’ of both men and women. Therefore, “social values changed [immediately] and the employment of
4
married women outside the home was once again frowned up” (Blau and Ferber 1992, p.106). For instance, in the USA, rate of women in the labor force declined to 31.5 per cent in 1947 while it was 35.8 per cent in 1945. (Blau and Ferber 1992, p.75, Table 4.1) This lower rate of participation lasted until the late 1950s.
The traditional roles attributed to both sexes –also known as traditional sexual division of labor1- profoundly affected the fundamentals of welfare states whose foundation coincided the same period in the developed world. The primary objective of the welfare states was to protect workers against the social risks of the system, but they did not bring a new discourse about female labor. Jessop (2000) notes that “Welfare policies are premised on rights attached to national citizenships and, in many cases, on stable ‘traditional’ family structures and the gender relations they authorize.” (p.180). Due to this basic rationale behind the welfare states, male breadwinner and
family wage had been the key concepts characterizing this period (Misra et al. 2007; Lewis 2001;
1997; Matthaei 2001; Sainsbury 1999; Orloff 1996; Çağatay and Özler 1995). Wages were held at a ‘family wage’ level which was high enough to define a man’s job as working outside the home and maintaining a reasonable standard of living to his unemployed, hence dependent, spouse and children. Relying on this model, the need for a second wage-earner at home had been removed. Bleses condemns this disparity between women and men, and writes “While most
1 The concept of ‘sexual division of labor’ has two meanings. First one is originally derived from the ‘domestic
division of labor’ which refers to the distribution of the productive jobs and responsibilities of a home between male and female members. In traditional societies, during the early phases of industrialization, this distribution presumed men’s task as working outside the home to provide monetary necessities of the family, while women were responsible for caregiving and doing the housework. This traditional sexual division of labor started to be questioned as women got more active participants of the labor market. Especially since 1970s, relying on Marxist theories, feminists have argued that women’s housework is as productive as men’s wage labor. And as a demonstration of critiques, the concepts ‘gendered division of labor’ or ‘sexual division of labor’ started to be used in the feminist literature. Second meaning of ‘sexual division of labor’ is the segregation in labor markets where women do only traditionally women’s jobs. As these are mostly low-status and low-paying jobs, patriarchal hierarchy remains unchanged. In the text, the first usage of the term is referred. For a conceptual analysis, see ‘Domestic Division of Labor’ chapter in Pilcher and Whelehan 2004. For a detailed Marxist theoretical debate on sexual division of labor, see ‘Feminizm and Marxizm’ in Donovan 2009.
5
western European and North American welfare states of the 1950s can be categorized as ‘patriarchal welfare states’, the division of labor between sexes was most clearly institutionalized in the ‘strong male breadwinner model’ welfare state” (Bleses 2004, p. 23)2.
It was by 1960s that women get out of their homes and appeared again in the labor market. Throughout this decade, economic conjuncture was particularly favorable for rising participation rates. Especially in the developed world, unprecedented rates of economic growth were accompanied by rapid growth of productivity and capital stock which required increasingly more labor. Hence, real wages steadily rose and unemployment rates substantially declined. These developments in the economy enabled increasing labor supply of women to be easily absorbed by the labor markets.
In spite of the increase in total number of working women, female labor force participation behavior showed significant differences in this period (Howes and Singh 1995). Traditional values were still the determinant factor of working decisions of women. For example, in the United States (US), while there was great diversity between the lives of women from different races and classes, most married women were still considered to be responsible for the ‘homemaking’ (Goldin 2006; Thistle 2006; Matthaei 2001). Unmarried women, apart from the racial or ethnic group they belong to, were much tended to be in the labor force. “Among married women, women of color were more likely to be in the labor force than white married women” (Thistle 2006, p.43). Not only in US but also in Germany, where female labor force participation
2 There is a wide literature on gender relations and welfare states. Most of the existing studies criticize welfare states
for promoting patriarchal social relations. Especially in the context of women’s economic activity, welfare states are criticized for being gendered institutions. From this critical point of view, it is broadly acknowledged that social welfare policies are adversely correlated with labor force participation of women. For more information on both theoretical debates and different country examples, see Korpi 2000; Sainsbury 1999; Lewis 1997; Orloff 1996.
6
was relatively higher than other European countries, that was the case until the early 1970s (Bleses 2004, p.36).
Following the changes in the world economy in the first half of the 1970s, labor force participation of women entered a new era. The most significant changes took place in developed countries. In the US, labor force participation rate (LFPR) of women increased 10 percentage points throughout this decade, from 50 per cent in 1970 to 61 per cent in 1980. In Sweden, LFPR of women rose from 60 per cent to 75 per cent and it rose from 41 per cent to 51 per cent in Australia in the same decade (OECD Labor Market Statistics).3 New patterns of international trade and investment played an important role in this drastic increase. In line with the new restructuring of the world economy, developed countries underwent a deindustrialization process which stands for the falling share of manufacturing in both employment and production. Deindustrialization in this sense started in the mid-1960s in countries such as Sweden, the United Kingdom and Belgium, and extended to virtually all developed countries by mid-1970s (Howes and Singh 1995). Service jobs, which replaced the industrial ones, provided wide employment opportunities to women, as they were considered as ‘serving jobs’, hence incompatible with men’s masculine nature. These jobs favored women over men as long as they required less skill and less technological knowledge (Howes and Singh 1995). The specific role assigned to women, as a flexible –and often cheaper- labor in the process of competitive restructuring due to deindustrialization, increased the availability of flexible employment and part-time work (Orloff 2009; Özler 2000). Also, the erosion of corporatist labor relations due to the decline of welfare states (Standing 1999), equal opportunity and anti-discrimination legislation (Orloff 2009), and
3 The increase in female labor force participation did take place in both developed and developing countries. But
7
the relative improvement of female earnings (Howes and Singh 1995) contributed to the increasing number of working women in developed economies.4
In developing economies, on the other hand, increasing labor force participation of women is generally argued in relation to feminization of labor. With the notion of ‘global feminization’ Guy Standing refers to the reduction in average job quality that has accompanied by the growth in women’s labor force participation (Standing 1989). He attributes the feminization of labor in developing countries to supply-side economic policies, particularly structural adjustment programs and macroeconomic stabilization policies urged by the International Monetary Fund (IMF) and the World Bank. These special programs amplified by the late 1970s and early 1980s, in the wake of debt crises. However, women had already become a part of the labor market due to rapid industrialization since 1960s in developing world. This increase in the number of working women in developing economies was the outcome of not only structural adjustment and stabilization policies, but also of trade liberalization and export promotion. “More significantly, a group of Asian and Latin American nations –the so-called NICs [Newly Industrializing Countries] were especially successful after WWII in establishing technical, scientific, and industrial infrastructures, in training their labor forces, in creating managerial and organizational capacities and in developing broad-based industrial bases” (Howes and Singh 1995, p.1904). By the early 1970s, these countries emerged as competitive trade powers in the world economy. Thus, they pose a serious threat to the industrial monopoly of developed countries. As the global trade had become more competitive, cost of labor turned out to be the most important component
4 Since the main subject of this study is not labor force participation decisions of women, the reasons affecting these
decisions and their results are not analyzed in detail. Rather, the periodic increases briefly mentioned while place of women in labor market is being examined only as a historical trend. For detailed discussion on the relation of economic globalization and female labor see Bussmann 2009; Richards and Gelleny 2007; Howes and Singh 1995; Standing 1989, 1999.
8
of production due to the combination of new production and labor-control technologies and competition between low-wage production zones. And at first it focused on women. Because, in most cases, “women [were] ready suppliers of low-wage labor in developing countries because of the social construction of women as secondary wage earners supplementing men’s wages” (Fussell 2000, p. 60). Therefore, within the new international division of labor, women are heavily concentrated in low-income sectors producing manufactured exports. Lower wages of women boosted the demand for their labor in highly mobile, labor-intensive industries (Heintz 2002). Çağatay and Özler (1995) states that “between 1950 and 1980, most advanced industrialized countries experienced feminization along with most Eastern European, East Asian, Caribbean, Latin American, Middle Eastern and North African economies” (p.1884).
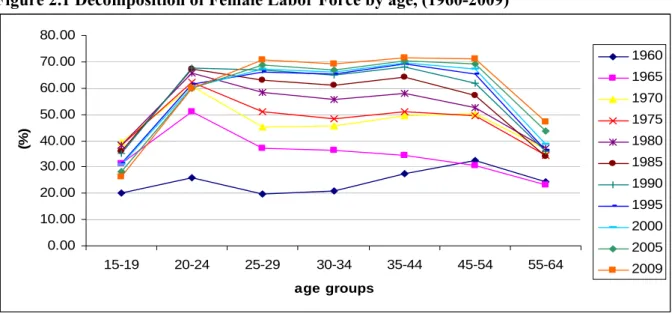
Figure 2.1 Decomposition of Female Labor Force by age, (1960-2009)
Source: OECD Labor Market Statistics
The increase in female labor force participation took place in all around the world. But, it was a slight rise, rather than a significant growth, in most developing countries. Moreover, in spite of an overall increase, decomposing working women by age groups reveals that the participation behavior of women did not profoundly differed from that of the Golden Age (Figure 2.1). In
0.00 10.00 20.00 30.00 40.00 50.00 60.00 70.00 80.00 15-19 20-24 25-29 30-34 35-44 45-54 55-64 age groups (% ) 1960 1965 1970 1975 1980 1985 1990 1995 2000 2005 2009
9
other words, under the extensive effects of the feminist movement of 1960s, women began to get rid of the strict ties of their traditional roles, but this did not have a widespread influence before 1980s. Bleses (2004) puts it as follows:
“Until the late 1980s overall labor force participation among women increased only slowly, and perhaps even more importantly, the shape of the curve did not change substantially; that is, the rate of female labor force participation dropped at the age when women typically married and/or had children” (Bleses 2004, p.36).
Data for OECD-total, confirms this explanation of Bleses. Figure 2.1 shows the trends of labor force participation of women by cohorts for every five year since 1960. It is obvious that women join the labor force at the highest rate between the ages 20-24. This is followed by a decline in the subsequent years. The reason for the decrease was the withdrawal of women with young children from labor force (Olivetti 2006; Horton 1999; Blau and Ferber 1992). Lim (2002) puts it more explicitly as “most women entered the labor force in their twenties, left after a few years to bear and raise children and re-entered the labor force towards the end of their childbearing years” (p.204). Due to the fluctuations in female labor force participation, the line reaches a peak at ages 20-24, and after a decline it goes up again by ages 35-44, but this time to a lesser point. This
double-peaked age patterns of participation were exhibited particularly in developed countries in
the past (Olivetti 2006). Germany, Japan, Sweden and United States perfectly exemplify this ‘double-peak’ with the most significant volatilities in participation rates across cohorts (OECD Labor Market Statistics). In accord with Bleses’s explanation, the sharp decline in the young women’s participation rate in 1970s verifies the close relation between women’s paid-work outside the home and their traditional roles. Matthei (2001) notes that “[The period from 1970s onward] represented a liberation for women from the rigid restrictions of the sexual division of
10
labor” (p. 472); however, it was too early in 1970s to have a widespread impact, at least in statistical terms.
Along with traditional constraints, the unstable economic conjuncture of 1970s and early 1980s was another reason of the unsustainable increasing trend in female labor force participation. Blau and Ferber (1992) notes that “during much of the 1960s, rising real wages and relatively low unemployment rates also contributed to the increases in female labor force participation rates. However, during the 1970s and the early 1980s, a stagnating economy resulted in frequent bouts of high unemployment and little progress in real wages.” (p.108). Such an unfavorable period led to impairment of the affirmative action policies, which were designed in 1960s in order to integrate women into the labor market as equal participants (Muttari 2001).
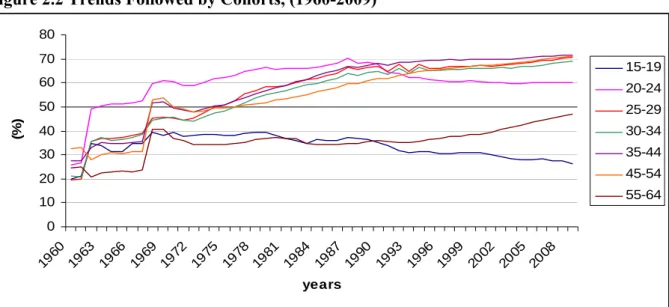
Figure 2.2 Trends Followed by Cohorts, (1960-2009)
Source: OECD Labor Market Statistics
Only by 1980s, the female LFPR gained a ‘sustainable’ increasing trend, both in cohorts and overall terms (Figures 2.2 and 2.4). The most important contributor was the profound consequences of ‘new international division of labor’ on the traditional sexual division of labor within countries. It means that from 1980s onwards, women’s market work was primarily
0 10 20 30 40 50 60 70 80 1960 1963 1966 1969 1972 1975 1978 1981 1984 1987 1990 1993 1996 1999 2002 2005 2008 years (% ) 15-19 20-24 25-29 30-34 35-44 45-54 55-64
11
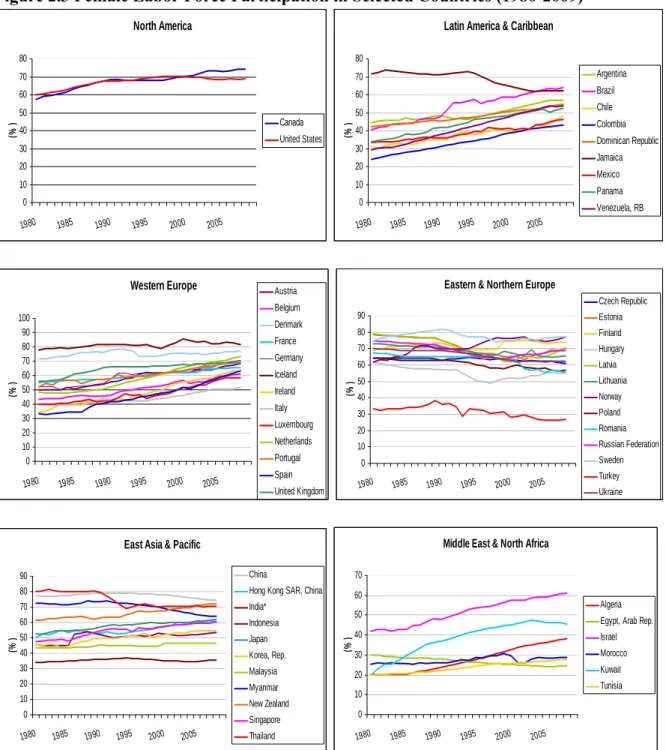
Figure 2.3 Female Labor Force Participation in Selected Countries (1980-2009)
* Countries are grouped according to World Bank classification. Only India is sorted in a different group. It is classified as a South Asian country in original groups.
Source: World Bank Gender Statistics.
North America 0 10 20 30 40 50 60 70 80 1980 1985 1990 1995 2000 2005 (% ) Canada United States
Latin America & Caribbean
0 10 20 30 40 50 60 70 80 1980 1985 1990 1995 2000 2005 (% ) Argentina Brazil Chile Colombia Dominican Republic Jamaica Mexico Panama Venezuela, RB Western Europe 0 10 20 30 40 50 60 70 80 90 100 1980 1985 1990 1995 2000 2005 (% ) Austria Belgium Denmark France Germany Iceland Ireland Italy Luxembourg Netherlands Portugal Spain United Kingdom
Eastern & Northern Europe
0 10 20 30 40 50 60 70 80 90 1980 1985 1990 1995 2000 2005 (% ) Czech Republic Estonia Finland Hungary Latvia Lithuania Norway Poland Romania Russian Federation Sweden Turkey Ukraine
East Asia & Pacific
0 10 20 30 40 50 60 70 80 90 1980 1985 1990 1995 2000 2005 (% ) China
Hong Kong SAR, China India* Indonesia Japan Korea, Rep. Malaysia Myanmar New Zealand Singapore Thailand
Middle East & North Africa
0 10 20 30 40 50 60 70 1980 1985 1990 1995 2000 2005 (% ) Algeria Egypt, Arab Rep. Israel Morocco Kuwait Tunisia
12
determined by international division of labor, rather than each country’s internal dynamics. In other words, women's employment was shaped according to the country's place in the world economy. Therefore, participation rates diversify substantially amongst country-specific cases. Figure 2.3 exhibits the patterns of labor force participation of women in selected countries by the year 1980.
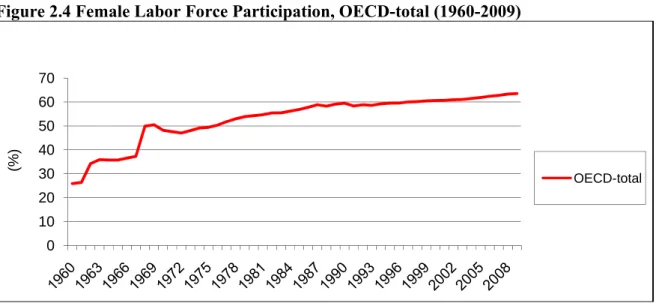
Figure 2.4 Female Labor Force Participation, OECD-total (1960-2009)
Source: OECD Labor Market Statistics
Despite the country-specific differences, in general both labor supply and employment of women followed an increasing trend throughout 1980s. Labor force participation rate of women rose from 57.4 per cent in 1980 to 68.4 per cent in 1990 in Canada. It was 49.8 per cent and 53 per cent for the same years in Hong Kong, and was 47.7 per cent and 54.6 per cent in Singapore. LFPR of women was 47.5 per cent in 1990 in Brazil, while it was 40.6 per cent in 1980 (World Bank Statistics).5 This rise in participation rates lasted in 1990s and 2000s, though at a slower pace (Figure 2.4).
5 There were decreasing rates of female labor force participation, too. But they were mostly associated with the
structural characteristics of the countries. So, they should be regarded as county-specific cases and should be excluded from the general trend estimations.
0 10 20 30 40 50 60 70 (%) OECD-total
13 2.1.2. The Evolution of Female Wages
Rapid increase in women's labor force participation took place together with relative enhancement in women’s earnings throughout 1980s. In the previous decades there was no remarkable improvement in female wages. This was, particularly, due to the social welfare states of postwar period. Family wage was, by definition, regarded as a ‘men’s right’ (Section 2.1.1). Hence, the paid labor of married women was not a requisite component of the labor market. Moreover, young women’s work before marriage was not a permanent tendency. Therefore, women were mostly considered to be reserve labor, as in the case of World War 2. Even when they work, women were regarded as supplementary to men’s labor (Standing 1989). Matthaei (2001) notes that “Women’s jobs lacked the potential upward mobility that came to characterize most white men’s jobs, and even though some employed women were single mothers trying to support their families, women’s jobs do not pay family wages” (p. 468). In developing countries, on the other hand, women mostly worked in the agricultural sector or do the traditionally women’s jobs. Their wages were so low that could not compete with that of men. Therefore, before 1980s, women’s wages stayed almost constant with reasonable differences to men’s wages. By late 1970s, structural changes in female labor supply and demand, and also new employment areas entailed enhancement in female wages. Since then, there has been an improvement in the pay gap and in the ratio of female wages to male wages in general. But, unlike the participation rates, pay gap did not followed a steady path. This inconsistency in paths was due to fluctuations in pay gaps across both countries and decades.
In developed countries gender wage gap significantly narrowed in 1980s. Before late 1970s, wage differentials were almost constant or convergence was very slow. But throughout 1980s this convergence was more noticeable. Particularly in the US, narrowing of the gap was much more
14
significant than in other countries. The ratio of median annual earnings of women to that of men rose from 59.7 per cent in 1979 to 68.7 per cent in 1989. It means 9.0 percentage points increase. But in 1990s this convergence slowed down: It was 72.2 per cent in 1999- which accounts for only 3.5 percentage point increase. (Blau and Kahn 2006, p. 45) In other developed countries, changes in the earnings ratios were not as dramatic as in the USA. Female-to-male wages in manufacturing in France was 76.8 per cent in 1980. It was 78.8 per cent in 1990 and remained constant throughout the 1990s. In Netherlands it was 75.3 per cent for the whole 1980s and increased only 3 percentage points during 1990s. However, gender pay gap increased in Denmark throughout 1980s. Women’s wages were 86 per cent of men’s wages in 1980, while it was 84.6 per cent in 1990. (World Bank Gender Statistics)
Figure 2.5 Female-to-male Wages in Manufacturing in Developed Countries, (1980-2007)
Source: ILO Labor Statistics
In developing countries, too, there were great diversities between country-specific cases. In Korea, the ratio of female-to-male wages in manufacturing increased by 11 per cent during 1980s, from 45 per cent in 1980 to 50.2 per cent in 1990. It rose to 57.2 per cent in 2000. In Malaysia it increased rapidly too, from 47.5 per cent in 1983 to 57.9 per cent in 1995, which
0.0 10.0 20.0 30.0 40.0 50.0 60.0 70.0 80.0 90.0 100.0 1980 198 2 1984 1986 1988 1990 1992 1994 1996 1998 2000 200 2 2004 2006 (% ) Belgium Denmark Finland France Japan Luxembourg Netherlands Sweden United Kingdom
15
means a 22 per cent increase. In a sharp contrast, female-to-male earnings decreased steadily from 77.7 per cent in 1982 to 59.4 in 2007 in Hong Kong. (Figure 2.6)
Figure 2.6 Female-to-male Wages in Manufacturing in Developing Countries, (1980-2007)
Source: ILO Labor Statistics
Data points to significant variations in the paths gender wage gap followed in different countries. Therefore, it is not possible to claim a general trend. Yet, one can still argue a more stable path in developed countries. Because, although the female-to-male wage ratio dropped in some countries and in some periods, these were not dramatic or permanent decreases (Figure 2.5).
Wf / Wm in Asia, 1980-2007 0,0 20,0 40,0 60,0 80,0 100,0 120,0 198 0 1982 1984 1986 1988 199 0 1992 1994 199 6 1998 2000 2002 2004 200 6 (% ) Hong Kong Korea Malaysia New Zealand Singapore Sri Lanka Taiwan Wf / Wm in Latin America, 1980-2007 0,0 20,0 40,0 60,0 80,0 100,0 120,0 140,0 198 0 1982 198 4 1986 198 8 1990 199 2 1994 1996 1998 2000 2002 2004 2006 (% ) Brazil Costa Rica El Salvador Paraguay
16
The relative enhancement of the wage gap in developed countries can be considered in association with wage structure, as well as development of strong social and economic institutions, particularly the wage-setting ones (Olivetti and Petrongolo 2008; Kumlin 2007; Blau and Kahn 2003; Korpi 2000). “These institutions take the form of collective bargaining conventions, minimum wage laws, and governmentally mandated extentions of the terms of collective bargaining to nonunion workers” (Blau and Kahn 2003, p. 111). In addition to wage-related policies, gender-specific policies, too, contributed to narrowing gender wage gaps in developed world. Gender-specific policies include “equal employment opportunity and antidiscrimination laws, as well as laws and policies governing parental leave and child care availability” (Blau and Kahn 2003, p. 110). By the mid-1980s, almost all OECD countries enacted antidiscrimination laws (Blau and Kahn 2003). Feminist movements of 1960s-70s, and antidiscrimination legislations jointly encouraged women to train and enter traditionally male-dominated jobs (Blau and Kahn 1997). “The entrance of women into men’s jobs, along with the decline in men’s real wages, led to a decreasing ‘wage gap’ between sexes” (Matthaei 2001, p.472). Furthermore, policies, which support mother’s employment, increased the number of working mothers. In other words, labor market attachment of women increased (Olivetti 2006; Blau 1998). This had a positive impact on gender based wage differentials, since longer years in labor market meant an uninterrupted career and more experience. Within the context of such policies, Continental European women are exposed to the highest wage gaps, while women of Nordic countries report the least, and North American women report intermediate levels of wage gaps (Misra et al. 2007; Sigle-Rushton and Waldfogel 2006).
In developing world, gender wage gap was much more volatile since women’s status and wages were closely related to the way of integration of countries into the world economy (Richards and
17
Gelleny 2007).6 In most developing countries women’s engagement with labor markets was through manufacturing industries. Women were mostly employed in free trade zones, such as the
maquiladoras of Mexico where they were paid lower wages vis-à-vis men, and encountered job
insecurity, occupational segregation, lack of advancement possibilities and a variety of oppressive working conditions (Ward and Pyle1995). Extensive employment in such jobs did not raise the bargaining power of women (Heintz 2002). Furthermore, unlike their counterparts in developed countries, women in developing world were not provided institutional rights such as antidiscrimination laws or equal employment-equal pay legislation. Therefore, women in countries which implemented strict export promotion and trade liberalization strategies lacked of an improvement in gender wage gap (Özler 2000). Even in some NICs, female-to-male wage differentials persisted over time (Figure 2.6).
Fussell (2000) explains the situation of women of industrializing countries as follows:
“Women’s employment in export-processing firms is a double-edged sword. These jobs offer women economic autonomy but pay insufficient wages to support oneself or one’s dependents and little hope of advancement.” (Fussell 2000, p. 62)
In some developing countries where women had the opportunity of higher education, longer years of experience, and were protected via laws, the ratio of female earnings to male’s increased at some various rates (Ward and Pyle1995). But, as Figure 2.6 depicts, female-to-male wages in manufacturing followed an inconsistent, and sometimes a severely fluctuating, path.
6 Richards and Gelleny (2007) state that “The relationship between economic globalization and women’s status
differs by the type of globalization, type of status, and era.” ( p.871). They analyze the effects of type of economic globalization in three groups. These are financial globalization, trade globalization and structural adjustment policies. They find that in most cases portfolio investment has adverse effects on women’s economic and social status. On the contrary, women are generally bettered-off by trade liberalization, since they are more likely to find non-agricultural employment opportunities.
18 2.2. Turkish Case
2.2.1. Female Labor Force Participation in the Post-War Period
The situation of Turkish women in labor market substantially differs from the worldwide trend. In the early years of postwar era, the LFPR of Turkish women followed a relatively stable path with respect to that of Western women. Although, Turkey had not gone to the War, men were called up for the armed forces due to the mobilization. So, Turkish labor market encountered a severe shortage of labor. But unlike Western countries, this shortage in the workforce was compensated with child labor rather than female labor. The share of child labor in total workforce rose from 8.80 per cent in 1937 to 18.86 per cent in 1943. The corresponding numbers for female labor were 18.89 per cent and 20.76 per cent (Makal 2001, p.135). Such a slight increase was followed by a slight decrease after the war years. This steady decline has continued until today. (Figure 2.7)
Figure 2.7 Labor Force Participation of Turkish Women, 1955-2009
Source: Derived from TURKSTAT, Household Labor Force Surveys; Values for the years 1955, 1965, 1975, and 1985 are from Ozbay 2010, Table 3, p.119.
0.0 10.0 20.0 30.0 40.0 50.0 60.0 70.0 80.0 1955 1975 1988 1990 1992 1994 1996 1998 2000 2002 2004 2006 2008 (% ) Total Urban Rural
19
Women’s labor force behavior is universally affected from socio-cultural factors. But the low rates of female labor force participation even in wartime, reveals that socio-cultural factors have very strong impact on Turkish women's employment decisions. The years following the war particularly verify this idea.
In the early years of postwar era, female labor market was segregated with sharp distinctions. A majority of women were concentrated in agriculture and traditional sectors. In 1955, 94.8 per cent of women were employed in agriculture (Özbay 2010, p.118). Most working women were unpaid family workers. The rate of unpaid family workers in 1955 was 93.5 per cent in rural areas and 52.2 per cent in urban areas (Makal 2001, p.128). Paid-worker positions in agriculture were available only in certain regions such as Çukurova and some Western Anatolian cities where industrial agriculture had been developing (Arıkan 1988, p. 5). Women's share in industry, on the other hand, remained quite low in this period: It was 16.3 per cent in 1960 and 22.5 per cent in 1970 in manufacturing (Çağatay and Berik 1990, p.123). Urban women often preferred to work at service sector which was regarded as more prestigious. They were concentrated in education, public administration, and health services in public; and clerical, and sales jobs in private sector. (Ecevit 2010, p. 107) Women in industrial jobs were most likely to belong to low-income families in the cities.
Such clear-cut borders in the female labor market vanished since 1970s. Especially by 1980s, female employment was shaped by more complicated factors. This transition of the determinants of female employment was closely related to the characteristics of Turkish economy of which agriculture still comprised the major part. Agriculture accounted for more than 30 per cent of the GDP and 77 per cent of employment in the early 1960s (Kepenek and Yentürk 2007. p.377). As a result of the strong agrarian basis of the society, education and migration were the principal
20
factors of social mobility in the post-war Turkey (Özbay 2010). But the functioning of these factors substantially differed between sexes.
Education was kind of a privilege which was mostly utilized by men. Marriage was regarded as more important for the future status of a young girl. Hence, girls’ education persisted at low levels in both rural and urban areas. Women’s educational attainment was lower than that of men at all levels. Furthermore, there was a distinct gender-based discrimination in the labor market even between those with same education levels (Özbay 2010). 7
Migration, on the other hand, was common among those living in small towns with better financial situations, rather than the rural poor (Özbay 2010). Especially until the early 1960s, in contrast with the general belief, the direction of internal migration was not rural-to-urban but urban-to-urban (Kepenek and Yentürk 2007). 8 Because, during these years, living in the cities
per se was a source of ‘social status’ both for women and men. Nevertheless, with respect to
integration into the urban labor market, they were affected almost in opposite ways. Women obtained a better status than rural women via migration. However, unlike men, this did not come about by shifting from agricultural to non-agricultural employment, but the removal of the need to women in labor force (Özbay 2010). For women in cities, ‘withdrawing from the production’ became a matter of prestige (Ecevit 2010; Özbay 2010).
7 Women’s education was profoundly affected by traditional values. General opinion of the society was that women,
even if educated, could not exist outside the family on their own. Besides, the rising level of girls’ education was believed to make it harder to find an appropriate marriage partner. Furthermore, the expenses related to education of girls were considered as a total loss since these expenses would not return to the family in the future. All these factors together contributed to low levels of female education (Ozbay 2010)
8 Provinces and counties are considered as urban areas. From this point of view, it can be inferred that migration to
big cities took place on a gradual basis. It means that the rural-to-urban migration initially headed towards small cities, and subsequently to big cities. (Kepenek and Yentürk 2007)
21
İlkkaracan (2010) evaluates the unwillingness of urban women to work with reference to import-substituting industrialization. According to this view, import-substitution strategy prompted migration since it was the first step of development in many developing countries. Women’s arrival in the cities due to migration symbolized getting rid of the heavy conditions of unpaid agricultural employment. Therefore, becoming a full-time housewife was regarded as an increase in the welfare of women, rather than an inequality (İlkkaracan 2010).
From economic perspective, the limited non-agricultural employment of women was the outcome of import-substituting industrialization strategy which was adopted between 1950-1980. The growth model dependent on the ‘domestic demand’ enabled high wages and low levels of men’s unemployment. This positive development in the labor market facilitated the sustainability of traditional ‘one-earner family’. Furthermore, dominated labor markets entailed
male-dominated unionization which resulted in men being taken as the reference point in collective
wage bargaining. As a consequence, import-substituting industrialization, similar to the welfare states of the day, led to the low levels of urban women’s participation in the labor force (İlkkaracan 2010).
Export-oriented industrialization of post-1980 period affected women’s employment in the opposite way. Newly adopted growth model which was dependent on ‘foreign demand’ promoted such labor-intensive industries as textile, garment, and food which mostly relied on female labor. On the other hand, decreasing reel wages throughout the same period impeded the sustainability of male-breadwinner family model.
The transition of social and cultural factors also contributed to the change of labor force participation behavior of women. Especially the changing composition of migration should be
22
investigated within this context. The prominent reasons of the varying characteristics of migration were the decrease in agricultural employment due to mechanization in agriculture since the early 1950s, and also the decline of agriculture's share in total production as a result of the accelerated industrialization following the 1960 coup (Kongar 2002). Following these experiences, migration had become more than a luxury resulting from the search for higher living standards of bourgeoisie of small towns: It turned into a dramatic fact resulting from the pursuit of subsistence of rural poor.
Women's labor force participation changed severely in the aftermath of rural-to-urban migration, particularly since 1980s. İlkkaracan (2000) points out three distinct groups in which female labor force participation can be evaluated. In one group she places rural women who have relatively high rates of labor force participation. Most of these women work as unpaid family workers in the agricultural sector. In another group there are urban women from income, high-education families. Labor force participation has been high in this group too, and most of the women in this group work at career jobs. In the middle of these two ends, İlkkaracan places urban women of low-income, low-education families. These women are mostly first- or second- generation rural-to-urban migrants. From this perspective, women who had been previously accounted as unpaid family workers were excluded from labor market as a result of the shift of population from villages to metropolitan areas (DPT/WB 2009; Makal 2001). Those without education or other qualifications required for urban economic activities mostly had to spend their lives as ‘housewives’ (DPT/WB 2009; Yücesan-Özdemir and Özdemir 2008; İlkkaracan 2000; Arıkan 1988)9. Traditional family dynamics and cultural attitudes were also the crucial factors
9 Bora (2010) considers ‘breadwinner male’ model as an outcome of migration and modernization as working
23
behind the low rates of participation of first generation migrants (DPT/WB 2009; Yücesan-Özdemir and Yücesan-Özdemir 2008).
As a consequence of the gradual withdrawal of women from labor market, Turkey, along with most Middle Eastern countries, is pointed out as one of the few countries which did not experience the feminization trend (Figure 2.3). However, data shows that despite the significant decrease in overall LFPR of women, urban women’s labor force participation has slightly increased in this period. Every 100 persons increase in the urban adult female population was corresponded by 16.7 persons increase in the non-agricultural employment in the pre-1980 period. In the post-1980 period this number increased to 19.7 persons (İlkkaracan 2010).
Worsening life conditions in the cities due to the unstable economic conditions played an important role in increasing labor supply of women. Rising education levels and urban women’s pursuit of economic freedom, too, contributed to increasing levels of participation (DPT/WB 2009; Dayıoğlu and Kırdar 2010; Kepenek and Yentürk 2007). It is often stated that there is a positive correlation between women’s education level and their labor force participation (Yücesan-Özdemir and Özdemir 2008; Toksöz 2007). This correlation is more noticeable especially in the cities (Dayıoğlu and Kırdar 2009). Toksöz (2007) notes that “education not only lays the ground for wage increases by raising productivity, but also gives social legitimacy to this participation by weakening patriarchal ways of thinking” (p.23) Table 2.1 shows women’s labor force composition by education. The ratio of women with higher education is doubled in urban female labor market between 1990 and 2009.
24
Table 2.1 FemaleLabor Force Status by Education Level, (+15)
Illiterate Less than
High School Vocational High and School Higher Education Total TOTAL 1990 30.2 55.8 9.3 4.7 100.0 1995 21.5 59.7 12.0 6.8 100.0 2000 20.6 53.5 14.7 11.2 100.0 2005 13.4 51.5 18.6 16.5 100.0 2009 10.5 50.0 18.7 20.9 100.0 URBAN 1990 10.1 47.4 27.1 15.4 100.0 1995 7.0 41.6 31.3 20.1 100.0 2000 4.3 37.9 31.4 26.4 100.0 2005 5.1 40.3 27.7 27.0 100.0 2009 3.4 38.4 26.4 31.8 100.0 RURAL 1990 37.1 58.6 3.2 1.0 100.0 1995 27.9 67.7 3.5 0.9 100.0 2000 30.8 63.2 4.3 1.7 100.0 2005 24.0 66.0 6.8 3.1 100.0 2009 20.9 67.1 7.2 4.8 100.0
Source: Derived from TURKSTAT, Household Labor Force Survey.
Women in the third group of the classification of İlkkaracan (2010) constitute another group with increasing labor force participation. These women’s entry into the formal labor market is limited with labor-intensive and low-paying jobs. As a result, informal sector has been a way-out for them 10 (DPT/WB 2009). In 1988, of 5,9 million women in labor force, 4,3 million were not registered under any social security institutions (TURKSTAT, Labor Statistics). This accounts to 73 per cent of Turkish female labor market. (Figure 2.8) Because of such a high share in employment, informal sector is one of the most important characteristics of contemporary Turkish labor market. So, a closer examination on informal employment is very important in understanding female labor force participation and wage trends.
10 İlkkaracan (2000) notes that “It is this final group which is pointed out for forming the basis of the falling rates of
25
Rapid informalization of female labor in 1980s is closely related to limited employment
opportunities. Throughout 1980s, industry and service sector developed rapidly via government
incentives. But, private sector’s capacity to create employment was too limited. Therefore, unemployment rate increased dramatically. Buğra and Yakut-Çakar (2010) note that “Neither this increase in industrial employment nor the significant growth of employment in services (from 31.2 per cent to 49.8 per cent) could compensate the impact of de-ruralization” (p.523).
Figure 2.8 Informal Employment of Women, (1988-2009)
Source: Derived from TURKSTAT, Household Labor Force Surveys.
Flexibilization of production is another reason of informalization. With the introduction of
flexible production techniques in manufacturing, production moved from large-scale to small-scale industries. The labor-intensive small-small-scale textile and garment ateliers in the outskirts of metropolises heavily rely on female workers as a source of cheap labor (Dedeoğlu 2004). Home-based works are also a common way of informal working. Home-Home-based sewing and embroidery works are important for particularly urban married women who have little children, or who belong to conservative families which do not allow women to work outside home (Yücesan-Özdemir and Yücesan 2008; Çınar 1994). Homemaking is another common way of engaging in
0,0 10,0 20,0 30,0 40,0 50,0 60,0 70,0 80,0 (% ) Informal Employment
26
paid-work for a number of urban married women of low socio-economic families. They work informally since most of the time they are considered as wage-earners supplementary to their husbands (Bora 2010)
Economic crises of the 1990s, too, contributed in informal female employment as they caused
instability in growth and employment. Furthermore, in the aftermath of the 2001 crisis, "jobless growth" problem emerged (İlkkaracan 2010). These factors negatively affected not only women’s employment but also men’s employment. Increasing rates of male unemployment and decreasing reel wages together led to degradation of women’s status to “reserve labor”11 (İlkkaracan 2010; DPT/WB 2009). Particularly women who are from low-education and low-income families, and who are considered as secondary wage-earners are likely to withdraw from formal labor market. In 2009, 50 per cent of the women in the female labor market of Turkey are still employed in informal sector (Figure 2.8).
Majority of women working in informal jobs are unpaid or underpaid. Dedeoğlu (2004) underlines their role as helping to mediate the familial relations by working for free or for wages lower than the legal minimum wages. They encounter gender-based discrimination, unpaid overtime work, and sexual abuse and harassment. In home-based jobs, they are not covered by social security and they suffer from health problems due to working under inappropriate conditions. Furthermore, they are not accounted in labor force since they are not included in statistics (Yücesan-Özdemir and Özdemir 2008).
Table 2.2 shows the occupational and industrial distribution of women and men in Turkey. According to the table, one-third of women are agricultural workers. This is followed by
11 DPT/WB (2009) asserts that female employment have increased since December 2007. This verifies the idea of
27
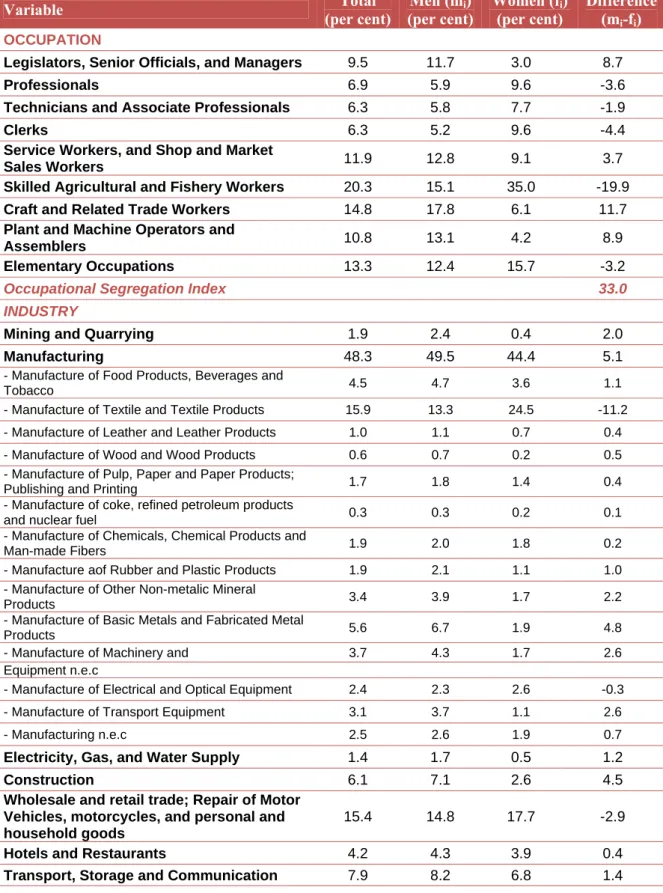
Table 2.2 Occupational and Industrial Distribution of Women and Men in Turkish Labor Market (2006)
Variable (per cent)Total Men (mi)
(per cent) Women (fi) (per cent) Difference (mi-fi) OCCUPATION
Legislators, Senior Officials, and Managers 9.5 11.7 3.0 8.7
Professionals 6.9 5.9 9.6 -3.6
Technicians and Associate Professionals 6.3 5.8 7.7 -1.9
Clerks 6.3 5.2 9.6 -4.4
Service Workers, and Shop and Market
Sales Workers 11.9 12.8 9.1 3.7
Skilled Agricultural and Fishery Workers 20.3 15.1 35.0 -19.9
Craft and Related Trade Workers 14.8 17.8 6.1 11.7
Plant and Machine Operators and
Assemblers 10.8 13.1 4.2 8.9
Elementary Occupations 13.3 12.4 15.7 -3.2
Occupational Segregation Index 33.0
INDUSTRY
Mining and Quarrying 1.9 2.4 0.4 2.0
Manufacturing 48.3 49.5 44.4 5.1
- Manufacture of Food Products, Beverages and
Tobacco 4.5 4.7 3.6 1.1
- Manufacture of Textile and Textile Products 15.9 13.3 24.5 -11.2
- Manufacture of Leather and Leather Products 1.0 1.1 0.7 0.4
- Manufacture of Wood and Wood Products 0.6 0.7 0.2 0.5
- Manufacture of Pulp, Paper and Paper Products;
Publishing and Printing 1.7 1.8 1.4 0.4
- Manufacture of coke, refined petroleum products
and nuclear fuel 0.3 0.3 0.2 0.1
- Manufacture of Chemicals, Chemical Products and
Man-made Fibers 1.9 2.0 1.8 0.2
- Manufacture aof Rubber and Plastic Products 1.9 2.1 1.1 1.0
- Manufacture of Other Non-metalic Mineral
Products 3.4 3.9 1.7 2.2
- Manufacture of Basic Metals and Fabricated Metal
Products 5.6 6.7 1.9 4.8
- Manufacture of Machinery and 3.7 4.3 1.7 2.6
Equipment n.e.c
- Manufacture of Electrical and Optical Equipment 2.4 2.3 2.6 -0.3
- Manufacture of Transport Equipment 3.1 3.7 1.1 2.6
- Manufacturing n.e.c 2.5 2.6 1.9 0.7
Electricity, Gas, and Water Supply 1.4 1.7 0.5 1.2
Construction 6.1 7.1 2.6 4.5
Wholesale and retail trade; Repair of Motor Vehicles, motorcycles, and personal and household goods
15.4 14.8 17.7 -2.9
Hotels and Restaurants 4.2 4.3 3.9 0.4
28
Table 2.2 Continued
Financial Intermediation 1.8 1.3 3.7 -2.4
Real Estate, Renting, and Business
Activities 6.7 6.5 7.6 -1.1
Education 2.6 1.7 5.6 -3.9
Health and Social Work 2.1 1.0 5.4 -4.4
Other Community, Social and Personal
Service Activities 1.6 1.6 1.4 0.2
Industrial Segregation Index 14.8
Source: Structure of Earnings Survey 2006, TURKSTAT.
elementary occupations with 15 per cent. Elementary occupations are the jobs which do not require any training or skills. Other one-third of women are allocated between professional, clerical, and service jobs.
With respect to industrial distribution, manufacturing has the highest concentration of women. Almost half of women are employed in manufacturing. Within manufacturing, women are crowded into textile. Bearing in mind that official surveys could reflect only formal sector numbers, rate of women in textiles, or manufacturing in general, is predicted to be reasonably above than the given rate.
2.2.2. The Evolution of Female Wages
The instability in female labor force participation affected wage trends in a similar way. The female wage trend in Turkey, similar to LFPR, substantially diverged from the worldwide trend. Until 1980s, women's share in paid labor was very low. In the post-1980 period, as in the case of other countries, female wages were closely associated with the new international division of labor. Increasing proportion of women entering the labor force led to a general enhancement in their wages vis-à-vis men’s wages. In Turkey, however, it followed an exactly opposite path.
29
Female-to-male wages in manufacturing was 98.5 in 1982, and even 100.0 per cent in 1983 (World Bank Statistics). But it gradually diminished by 1980s.
Both internal and external dynamics affected this fall in wages. The period from 1981 to 1988 “was characterized by a severe suppression of wage incomes via hostile measures against organized labor.” (Boratav et al. 2000, p.3). In the same time the economy was opened to international trade and export-oriented industries promoted female labor. Under the effects of such dynamics, the rate of female wages with respect to men’s wages decreased substantially. It was 88.4 per cent in 1993, and in 2006, the annual gross female wage in manufacturing was 79.2 per cent of that of men. (Table 2.3)
Table 2.3 Female-to-male Wages in Manufacturing (per cent)
Years Wf / Wm * 100 ( Wf - Wm ) / Wm
1983 100.0 0.00
1993 88.4 0.12
2006 79.2 0.21
Source: Derived from World Bank Gender Statistics, and 2006 Structure of Earnings Survey of TURKSTAT.
Table 2.4 shows the annual average gross earnings by sex, and industrial and occupational groups. According to the table, women earn 98 per cent of men on an annual basis. However, this rate substantially varies between occupational and industrial categories. Among occupational groups, women earn more than men only in the first group. Yet this is not a significant difference. In other groups, female-to-male wages range from 75.5 to 92.0 per cent. This range is much wider with respect to industrial categories: from 73.6 per cent in ‘health and social works’ to 129.6 per cent in ‘transport, storage and communication’. Manufacturing has one of the lowest female-to-male wage ratios. In textile industry, women earn 92.5 of men.
30
Table 2.4 Annual Average Gross Earnings by Sex, (2006)
Total Men (Wm)
Women
(Wf) (Wf/Wm)*100
TOTAL 14,252 14,316 14,036 98.0
Occupation
Legislators, Senior Officials, and Managers 35,914 35,728 36,564 102.3
Professionals 23,605 26,165 21,355 81.6
Technicians and Associate Professionals 17,885 18,633 16,158 86.7
Clerks 14,897 15,826 13,658 86.3
Service Workers, and Shop and Market Sales
Workers 10,074 10,243 9,423 92.0
Skilled Agricultural and Fishery Workers 11,181 11,300 9,554 84.5 Craft and Related Trade Workers 11,095 11,523 8,695 75.5
Plant and Machine Operators and Assemblers 11,359 11,675 9,023 77.3
Elementary Occupations 9,294 9,544 8,209 86.0
Industry
Mining and Quarrying 14,936 14,990 13,924 92.9
Manufacturing 13,327 13,942 11,039 79.2
Electricity, Gas, and Water Supply 26,140 26,591 21,128 79.5
Construction 9,205 9,081 10,337 113.8
Wholesale and Retail Trade; Repair of Motor Vehicles, Motorcycles, and Personal and Household Goods
13,540 13,552 13,506 99.7
Hotels and Restaurants 10,170 9,963 10,934 109.7
Transport, Storage and Communication 20,510 19,375 25,105 129.6
Financial Intermediation 33,907 34,681 32,996 95.1
Real Estate, Renting, and Business Activities 13,455 12,758 15,427 120.9
Education 15,405 15,421 15,390 99.8
Health and Social Work 15,620 18,608 13,700 73.6
Other Community, Social and Personal
Service Activities 13,546 13,567 13,465 99.2
Source: Structure of Earnings Survey 2006, TURKSTAT.
Current rate of female-to-male wages in Turkey is quite above the OECD average, which was 77.0 per cent in 2006.12But data reveals that it was better in the past and has been sharply declining within the past thirty years. Looking at the high female-to-male wage ratio, provided that education level of women is much higher in non-agricultural employment, indeed the wage differential is expected to be in favor of women (İlkkaracan 2010). The rate of women with an
12 It should be noted that the high rate of female-to-male wage ratio is not a consequence of a satisfactorily high
31
education level at least high school is 66.2 per cent as opposed to 48.7 of men (TURKSTAT). Relying on this high difference in education levels, the relative worsening in female wages is regarded as an indicator of a discrimination against women in the Turkish labor market, rather than of a deterioration in or inadequacy of women’s productivity-related qualifications.
Discrimination against women appears on the ‘institutional’ level too. The declining female-to-male wage ratio is associated with the lack of developed social and economic institutions, especially the wage-setting ones. In Turkey, gendered unionization prevails as an outcome of the gendered labor market. This gender bias in collective labor favors men even in the wage determination process.
In recent years Turkey declared her commitments to ensure gender equality within the context of the process of alignment with the European Union (EU). The Labor Code no. 4857 is a product of this process. Article 5, under the heading equal treatment, states that “in the employment relation no discrimination can be made based on language, race, sex, political opinion, philosophical conviction, religion and sect”. The fourth paragraph of the same article provides the gender equality of payment for equal employment. Moreover, the Minimum Wage Regulation no. 25540 states that “no gender difference can be considered in setting minimum wage”.
Toksöz (2007) underlines that despite the fact that discrimination on the ground of gender is prohibited with the constitution; there is no definition of discrimination in the legislation. Furthermore, the term ‘employment relation’ confines the policy implementations only to those who are already employed. However, the majority of women are exposed to discrimination in the recruitment process. Thus, the legislation is inadequate also in its commitment for equal employment (Toksöz 2007).
32
Besides the wage related policies, gender-specific policies in Turkey are unsatisfactory too. Care and nursing leaves in cases of maternity are regulated in the Article 74 of same labor code. It is provided that female workers can not be employed for 8 weeks before and after delivery. This is longer than the 14 week-leave period of the EU. Regulation no. 25522, on the other hand, introduces the conditions of work of pregnant and nursing women, and nursing rooms and care centers in workplaces. According to this regulation, enterprises employing 100 to 150 females are obliged to have nursing rooms, and enterprises employing at least 150 female workers are obliged to have childcare centers. However, these regulations do not function well most of the time. Furthermore, they are criticized for being the reflectors of a gender bias in labor market regulations. Toksöz (2007) notes that;
“Basing the availability of rooms and care centers only upon the number of female workers is a manifestation of traditional patriarchal mentality which regards childcare as an obligation relevant only to women.” (Toksöz 2007, p.81)
The existence of gender-related legislation in Turkey can not provide equal pay for equal employment of women. What is worse is that female employment is discouraged since some policy applications are grounded on the number of women in workplaces. Therefore, the employment gap between women and men, along with the wage gap, remains a serious problem of Turkish labor market.
33
3. AN OVERVIEW OF GENDER WAGE GAP LITERATURE
Although, women have more actively joined the labor force and been well accepted since 1980s, there is still a gap between female and male wages. The persisting gender wage gap constitutes a wide theoretical literature in economics and sociology. Numerous empirical studies focus on the reasons and the extent of this gap. This section provides a brief overview of the gender wage gap literature.
3.1. Setting the Theoretical Framework 3.1.1. Supply-Side Explanations
The prominent supply-side explanation for gender wage gap is the human capital theory. The theory, briefly, suggests that if men and women are endowed with different levels of human capital, particularly education, then, different levels of wages are considered as acceptable. The special emphasis on education and training is in line with the works of earlier political economists.
In search for understanding the differences of national incomes, Adam Smith emphasized the effect of personal abilities on labor. In contrast with the contemporary theory, personal abilities
per se were not conceptualized in Smith’s theory. Instead, only education was highlighted as an
34
abilities acquired through “education, study, or apprenticeship, always costs a real expense, which is a capital fixed and realized, as it were, in… person” (Smith 1776/1981, p. 282) In accordance with the views of Smith, Alfred Marshall stated “We may define personal wealth so as to include all those energies, facilities, and habits which directly contribute to making people industrially efficient” (Marshall 1948 from Sweetland 1996, p. 344). Although the roots of the theory traces back to centuries ago, the term human capital was first discussed by Pigou in 1932. Its emergence as a field of inquiry took place in 1950s.
Modern neoclassical theory of labor is based on this human capital theory. Mincer (1958), unlike earlier works, claimed an explicit link between human capital and personal income. He criticized the earlier works for being unsatisfactory as “they shed no light on the economics of the distribution process” (Mincer 1958, p.283). The novelty of Mincer’s work was its suggestion that the ‘theory of rational choice’ be explored for a better understanding of personal income distribution. Based on Friedman's theory of ‘taste for risk’, he examined the effect of individual choices –with special reference to education- on personal income distribution. He identified two types of training, and used the length of time spent at school to measure formal training, and the amount of time spent on the job to measure experience, or ‘informal training’ as Sweetland calls it (Sweetland 1996, p. 345). Mincer (1958) found that the differences in training led to differences in levels of earnings. With respect to female wages he noted that “earnings of female workers are less dispersed than earnings of male workers” (Mincer 1958, p.300). And he concluded that “even perfect equality of ability and opportunity implies neither income equality nor symmetry in the income distribution” (ibid, p.302).
Bringing Mincer’s work further, Gary Becker used human capital theory in exploring labor market discrimination based on race, religion, sex, color, social class, personality, or other