EFFECT OF DIFFERENT FERTILIZER TREATMENTS ON
BOTANICAL COMPOSITION, HERBAGE YIELD AND HERBAGE
QUALITY IN THE EASTERN ANATOLIA REGION PASTURE OF
TURKEY
CACAN,E.
Department of Crop and Animal Production, Vocational School of Genc, University of Bingol Bingol, Turkey
(e-mail: [email protected]; phone: +90-505-844-5280; fax: +90-426-411-2083) (Received 13th Apr 2018; accepted 13th Jun 2018)
Abstract. This study was carried out to reveal the effect of different doses of nitrogen, phosphorus and combinations of these doses on the botanical composition, herbage yield and herbage quality in the Eastern Anatolia Region pasture of Turkey. In the study 0, 5, 10, 15 kg da-1 nitrogen, 0, 4, 8, 12 kg da-1 phosphorus doses and different combinations of these fertilizers (5-4, 5-8, 5-12, 10-4, 10-8, 10-12, 15-4, 15-8, 15-12 kg da-1) were used and the study was conducted over a natural pasture section of Research and Application Center of Bingol University. Experiments were conducted between the years 2014-2017 for 4 years in randomized blocks factorial experimental design with 3 replications and 2 factors. Weight-based botanical composition, green herbage yield, dry herbage yield, crude protein yield, acid detergent fiber (ADF), neutral detergent fiber (NDF) and relative feed values (RFV) were investigated. Present findings revealed that fertilizer treatments (nitrogen and phosphorus doses and combinations) increased legume ratio in botanical composition, green herbage yields, dry herbage yields, crude protein yields and relative feed values and reduced ADF and NDF ratios systematically during the first three years of the experiments. The greatest green herbage yield (758.9 kg da-1), dry herbage yield (458.6 kg da-1) and crude protein yield (63.7 kg da-1) were obtained from 10 kg da-1 nitrogen and 8 kg da-1 phosphorus treatments. As compared to the control plot, the plot with 10-8 kg da-1 N-P treatment had about 115.7% greater green herbage yield and 154.4% greater dry herbage yield. Therefore, 10 kg da-1 nitrogen and 8 kg da-1 phosphorus treatments could be recommended for fertilization programs to be applied in pastures of Bingol province and the Eastern Anatolia pastures with the similar ecological conditions.
Keywords: pasture, nitrogen, phosphorus, crude protein yield, relative feed value
Introduction
Meadow and pastures are commonly used in animal feeding in Turkey. Misuse of pastures for years, excessive and uncontrolled grazing practices have made soil surfaces barren, resulted in serious soil erosion over these surfaces and ultimately resulted in significant yield and quality losses. Then pastures were not able to meet the feed needs of the present animals. Therefore, pastures should urgently be reclaimed to make them sufficient again to meet forage needs of livestock. Fertilization is among the significant methods used for pasture reclamation.
Fertilizers are the primary inputs used in modern agriculture to improve yield levels (Ergene, 1997). They can alone provide about 40% yield increase in agricultural production activities and thus may provide significant contributions to food safety (Karaman, 2012). With the efficient use of fertilizers, about 50-70% yield increase can be achieved for nitrogen and 10-15% for phosphorus (IFA, 1999). Fertilization has versatile impacts on meadow and pastures. Fertilizers can improve herbage yield and quality, provide regular distribution of herbage throughout the grazing periods, ease the establishment of seed-propagated seedlings and enrich the taste of herbage (Altin, 1992; Heady and Child, 1994).
However, economic analyses should be performed to assess the economy of fertilization practices (level of yield increase achieved with the fertilizer quantity applied per unit area). For this purpose, the economic limit of the fertilizer to be applied should be well identified. The price of the product obtained with additional fertilizer should be greater or at least equal to the price of utilized fertilizer plus the price of other practices performed during fertilization. Otherwise, fertilizer use will not be economic (Sezen, 1995).
In previous studies carried out in Turkey and the other countries, it was stated that pasture vegetation could benefit from precipitations more efficiently, vegetation herbage quantity and quality could be improved with fertilization practices. With reclamation practices, pastures regain their previous statuses and may provide sufficient and quality herbage. To have expected benefits from the fertilizers, economic analyses should be performed, proper fertilizer types and doses should be well identified.
Previous studies also revealed that pasture class was improved from poor or risky to healthy with fertilization practices (Dasci et al., 2009), pasture herbage quality and quantities were improved with fertilization practices (Celik et al., 2001; Hatipoglu et al., 2001; Hatipoglu et al., 2005; Gur, 2007; Balabanli et al., 2010; Andic et al., 2001; Budakli and Carpici, 2011), crude protein of pasture hay was improved (Andic et al., 2001; Hatipoglu et al., 2005; Balabanli et al., 2010; Budakli and Carpici, 2011), ADF (Budakli and Carpici, 2011) and NDF ratios (Balabanlı et al., 2010) decreased and relative feed values increased with fertilization practices.
This study was conducted in Bingol province of Turkey to investigate the effects of different nitrogen doses combined with different phosphorus doses on botanical composition, herbage yield and quality of pastures and to determine proper fertilizer doses for Eastern Anatolia pastures and the other pastures with similar ecological conditions.
Materials and methods
Location, soil and climate
The studies were carried out in the province of Bingol. Bingol province is located in the Eastern Anatolia Region of Turkey. Experiments were set up in April of 2014 over the Research and Application Center of Bingol University about 15 km from Bingol province with an altitude of 1088 m (38.81256°N - 40.53551°E). The map of Turkey and a few photographs of the study area are given in Figure 1. Experiments were conducted between the years 2014-2017 for 4 years.
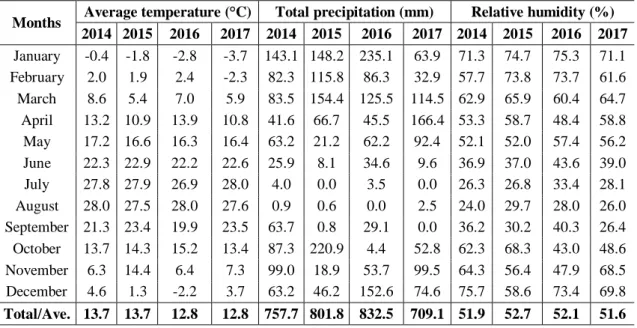
Meteorological data of the research site were received from Bingol Provincial Directorate of Meteorology. As it can be seen from Table 1, annual variations in temperature and relative humidity values were similar to each other, but precipitations of the years 2014 and 2017 were lower than the other years.
Soil samples were taken from 0-30 cm soil profile of different sections of the research site. Soil analyses were performed at laboratories of Soil Science and Plant Nutrition Department of Bingol University Agricultural Faculty. Soil analyses revealed that experimental soils were clay-loam in texture. Soils were slightly acidic (pH = 6.266), unsaline (0.014%), poor in organic matter (1.09%) and lime (0.41%) and sufficient in potassium (20.27 kg da-1) and phosphorus (7.60 kg da-1).
Figure 1. The map of Turkey and photographs of study area
Table 1. Monthly average climate data of Bingol for 2014-2017 years. (Source: General
Directorate of Meteorology, Bingol)
Months Average temperature (°C) Total precipitation (mm) Relative humidity (%) 2014 2015 2016 2017 2014 2015 2016 2017 2014 2015 2016 2017 January -0.4 -1.8 -2.8 -3.7 143.1 148.2 235.1 63.9 71.3 74.7 75.3 71.1 February 2.0 1.9 2.4 -2.3 82.3 115.8 86.3 32.9 57.7 73.8 73.7 61.6 March 8.6 5.4 7.0 5.9 83.5 154.4 125.5 114.5 62.9 65.9 60.4 64.7 April 13.2 10.9 13.9 10.8 41.6 66.7 45.5 166.4 53.3 58.7 48.4 58.8 May 17.2 16.6 16.3 16.4 63.2 21.2 62.2 92.4 52.1 52.0 57.4 56.2 June 22.3 22.9 22.2 22.6 25.9 8.1 34.6 9.6 36.9 37.0 43.6 39.0 July 27.8 27.9 26.9 28.0 4.0 0.0 3.5 0.0 26.3 26.8 33.4 28.1 August 28.0 27.5 28.0 27.6 0.9 0.6 0.0 2.5 24.0 29.7 28.0 26.0 September 21.3 23.4 19.9 23.5 63.7 0.8 29.1 0.0 36.2 30.2 40.3 26.4 October 13.7 14.3 15.2 13.4 87.3 220.9 4.4 52.8 62.3 68.3 43.0 48.6 November 6.3 14.4 6.4 7.3 99.0 18.9 53.7 99.5 64.3 56.4 47.9 68.5 December 4.6 1.3 -2.2 3.7 63.2 46.2 152.6 74.6 75.7 58.6 73.4 69.8 Total/Ave. 13.7 13.7 12.8 12.8 757.7 801.8 832.5 709.1 51.9 52.7 52.1 51.6
Trial design and treatments
Effects of four different nitrogen doses (0, 5, 10, 15 kg da-1), four different
phosphorus doses (0, 4, 8, 12 kg da-1) and combination of these doses (5-4, 5-8, 5-12,
vegetation were investigated in this study. Urea (46% N) as nitrogen source and triple
super phosphate (43-44% P2O5) as phosphorus source were used. The chemical
composition of urea is H2N-CO-NH2 and chemical composition of the triple super
phosphate is Ca(H2PO4)2.H2O. For each treatment and combination, plot size was
arranged as 2 x 6 = 12 m2. Experiments were conducted in randomized blocks with three replications and factorial experimental design with 2 factors. Phosphorus treatments were applied at the beginning of October in which effective precipitations started and nitrogen treatments were applied in April of each year. In the same way nitrogen application for combinations was carried out in April and phosphorus application in October.
Measurements
Vegetation was harvested from randomly placed 33 × 33 cm frame sections (3 frames for each plot) of each plot at earing stage of the dominant vegetation plants at the last week of May. Harvested herbage was weighted to get green herbage weight. Then, samples were dried at 78 °C for 24 h and weighted to get dry herbage weights. Dry weights were used to get dry herbage yields. The dry herbage obtained from the frames was divided into three groups, namely legumes, grasses and other family plants. The rates of botanical composition according to weight were obtained by dividing the dry herbage yield values of plant groups determined in each frame into the total dry herbage yield determined in said frames.
Dried samples were ground and subjected to crude protein, ADF (acid detergent fiber), NDF (neutral detergent fiber) and related quality analyses with the aid of NIRS (Near Infrared Spectroscopy - Foss Model 6500) device at Science and Technology Implementation and Research Center of Dicle University (Basaran et al., 2011; Mut et al., 2010; Cinar and Hatipoglu, 2015). Crude protein ratios were used to get crude protein yield per decare. ADF and NDF values were used to get relative feed value (RFV = (88.9 - (0.779 × %ADF)) × (120 / %NDF) / 1.29 (Van Dyke and Anderson, 2000; Morrison, 2003).
Statistics
Experimental data were subjected to variance analysis with JMP statistical software in accordance with randomized blocks factorial experimental design with three replications and two factors. Means were separated with Tukey’s HSD (honest significant difference) test (Steel and Torrie, 1980; Kalayci, 2005).
Results
Botanical composition (%)
Annual botanical composition of pastures with different nitrogen and phosphorus doses are presented in Figure 2. As it can be seen from Figure 2, fertilizer doses applied to pastures increased the ratio of legumes in botanical composition in the second and third year, but legume ratio decreased again in the fourth year. Phosphorus fertilizer was the primary reason for the increasing legume ratio of the pasture in 2015 and 2016. Since lower precipitation levels were received in 2014 and 2017, legume ratio of those years were lower than the other years. The pasture was dominantly a graminae pasture with about 93.50% graminae species.
Figure 2. The botanical composition of the pasture area (%)
Green and dry herbage yields (kg da-1)
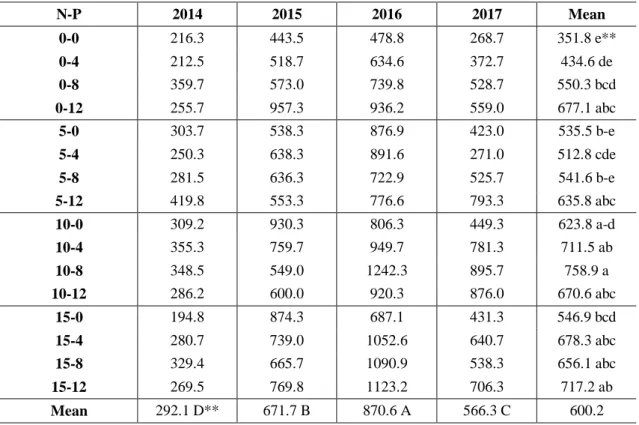
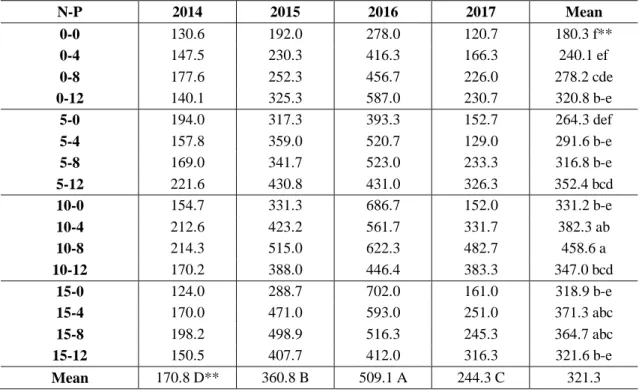
Green herbage yields and averages from the pastures treated with nitrogen and phosphorus doses for 4 years are provided in Table 2 and dry herbage yields and averages are provided in Table 3. The effects of nitrogen and phosphorus treatments on green and dry herbage yields were found to be significant and the differences in green and dry herbage yields of the years were also significant (1%). As the average of 4 years, the greatest green herbage yield (758.9 kg da-1) and the greatest dry herbage yield (458.6 kg da-1) were obtained from the plots with 10 kg da-1 N and 8 kg da-1 P treatments; the lowest green herbage yield (351.8 kg da-1) and the lowest dry herbage yield (180.3 kg da-1) were obtained from the control treatment (0-0 kg da-1).
Table 2. Green herbage yields and averages of the pasture parcels (kg da-1)
N-P 2014 2015 2016 2017 Mean 0-0 216.3 443.5 478.8 268.7 351.8 e** 0-4 212.5 518.7 634.6 372.7 434.6 de 0-8 359.7 573.0 739.8 528.7 550.3 bcd 0-12 255.7 957.3 936.2 559.0 677.1 abc 5-0 303.7 538.3 876.9 423.0 535.5 b-e 5-4 250.3 638.3 891.6 271.0 512.8 cde 5-8 281.5 636.3 722.9 525.7 541.6 b-e 5-12 419.8 553.3 776.6 793.3 635.8 abc 10-0 309.2 930.3 806.3 449.3 623.8 a-d 10-4 355.3 759.7 949.7 781.3 711.5 ab 10-8 348.5 549.0 1242.3 895.7 758.9 a 10-12 286.2 600.0 920.3 876.0 670.6 abc 15-0 194.8 874.3 687.1 431.3 546.9 bcd 15-4 280.7 739.0 1052.6 640.7 678.3 abc 15-8 329.4 665.7 1090.9 538.3 656.1 abc 15-12 269.5 769.8 1123.2 706.3 717.2 ab Mean 292.1 D** 671.7 B 870.6 A 566.3 C 600.2 **P < 0.01, CV(%): 22.5 Pe rc enta ge (%) (Years)
With fertilization treatments for 4 years, average green herbage yield increased from 351.8 kg da-1 to 600.2 kg da-1 and the average dry herbage yield increased from 180.3 kg da-1 to 321.3 kg da-1. Such values revealed that applied fertilizer doses resulted in 70.6% increase in green herbage yields and 78.2% increase in dry herbage yields.
However, considering the plot with the greatest yields (10 kg da-1 N and 8 kg da-1 P),
such an increase as compared to control (0-0 kg da-1) was 115.7% in green herbage yield and 154.4% in dry herbage yield.
Table 3. Dry herbage yields and averages of the pasture parcels (kg da-1)
N-P 2014 2015 2016 2017 Mean 0-0 130.6 192.0 278.0 120.7 180.3 f** 0-4 147.5 230.3 416.3 166.3 240.1 ef 0-8 177.6 252.3 456.7 226.0 278.2 cde 0-12 140.1 325.3 587.0 230.7 320.8 b-e 5-0 194.0 317.3 393.3 152.7 264.3 def 5-4 157.8 359.0 520.7 129.0 291.6 b-e 5-8 169.0 341.7 523.0 233.3 316.8 b-e 5-12 221.6 430.8 431.0 326.3 352.4 bcd 10-0 154.7 331.3 686.7 152.0 331.2 b-e 10-4 212.6 423.2 561.7 331.7 382.3 ab 10-8 214.3 515.0 622.3 482.7 458.6 a 10-12 170.2 388.0 446.4 383.3 347.0 bcd 15-0 124.0 288.7 702.0 161.0 318.9 b-e 15-4 170.0 471.0 593.0 251.0 371.3 abc 15-8 198.2 498.9 516.3 245.3 364.7 abc 15-12 150.5 407.7 412.0 316.3 321.6 b-e Mean 170.8 D** 360.8 B 509.1 A 244.3 C 321.3 **P < 0.01, CV(%): 21.3
With regard to yields of the years, the greatest green herbage and dry herbage yields were obtained from 2015 and 2016 and the lowest green herbage and dry herbage yields were obtained from 2014 and 2017. Lower precipitation levels of the years 2014 and 2017 were the primary reason of such lower yields in those years. Since 2014 was the first year of the experiments and thus the impacts of fertilizers did not showed up and the precipitations in March and April were lower than the other years, the lowest yields were observed in 2014.
As compared to control treatments (0-0 kg da-1), all nitrogen and phosphorus
treatments had greater yields (Fig. 3). However, only 10-0 kg da-1, 5-12 kg da-1, 10-4 kg
da-1, 10-8 kg da-1, 10-12 kg da-1, 15-4 kg da-1, 15-8 kg da-1 and 15-12 kg da-1 nitrogen
and phosphorus treatments had yield values greater than general average (321.3 kg da-1).
Therefore while preparing fertilization plans, cost-benefit analysis should be performed and one of those treatments should be selected.
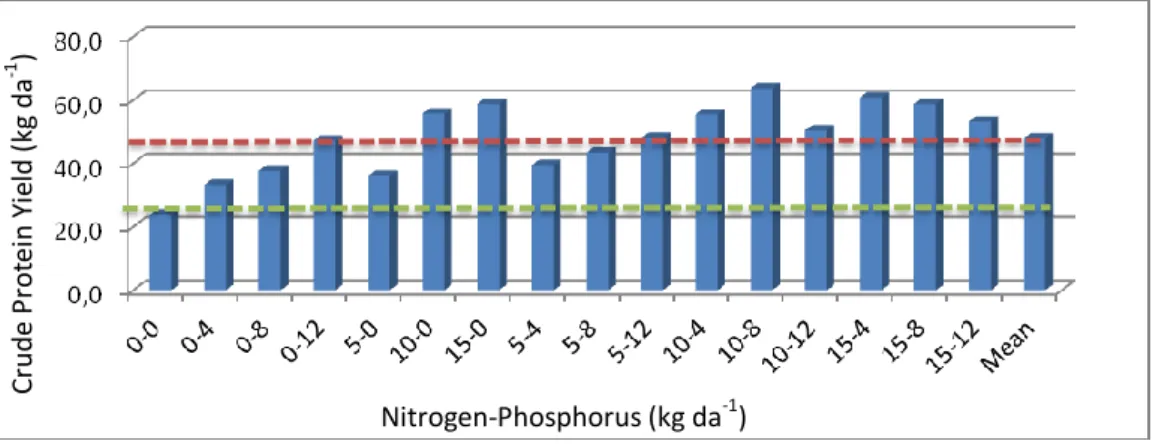
Crude protein yield (kg da-1)
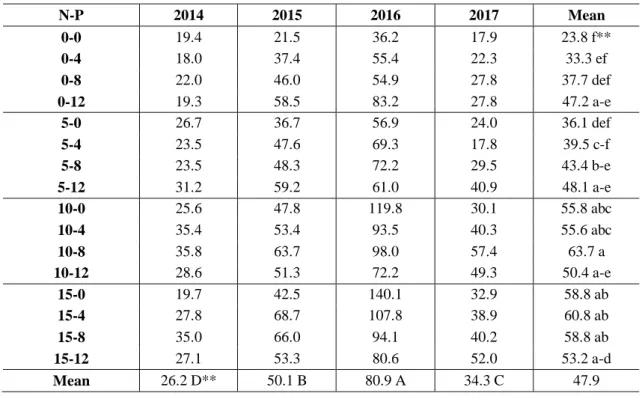
Crude protein ratios and averages of pasture plots treated with different nitrogen and phosphorus doses are provided in Table 4. The effects of nitrogen and phosphorus
treatments on crude protein yields were found to be significant and the differences in crude protein yields of the years were also significant (1%). The greatest crude protein
yield (63.7 kg da-1) was obtained from 10 kg N and 8 kg P treatments and the lowest
crude protein yield (23.8 kg da-1) was obtained from the control plot (0-0 kg da-1).
Figure 3. The dry herbage yield of the pasture parcels (kg da-1)
Table 4. Crude protein yields and averages of the pasture parcels (kg da-1)
N-P 2014 2015 2016 2017 Mean 0-0 19.4 21.5 36.2 17.9 23.8 f** 0-4 18.0 37.4 55.4 22.3 33.3 ef 0-8 22.0 46.0 54.9 27.8 37.7 def 0-12 19.3 58.5 83.2 27.8 47.2 a-e 5-0 26.7 36.7 56.9 24.0 36.1 def 5-4 23.5 47.6 69.3 17.8 39.5 c-f 5-8 23.5 48.3 72.2 29.5 43.4 b-e 5-12 31.2 59.2 61.0 40.9 48.1 a-e 10-0 25.6 47.8 119.8 30.1 55.8 abc 10-4 35.4 53.4 93.5 40.3 55.6 abc 10-8 35.8 63.7 98.0 57.4 63.7 a 10-12 28.6 51.3 72.2 49.3 50.4 a-e 15-0 19.7 42.5 140.1 32.9 58.8 ab 15-4 27.8 68.7 107.8 38.9 60.8 ab 15-8 35.0 66.0 94.1 40.2 58.8 ab 15-12 27.1 53.3 80.6 52.0 53.2 a-d Mean 26.2 D** 50.1 B 80.9 A 34.3 C 47.9 **P < 0.01, CV(%): 25.6
Considering the crude protein yields of the years, the greatest value (80.9 kg da-1) was obtained in 2016 and the lowest value (26.2 kg da-1) was obtained in 2014. As it was in green herbage and dry herbage yields, the lowest crude protein yield was observed in the first year of the experiments, crude protein yields then systematically increased in the second and third year and decreased again the fourth year. Since crude
D ry H er b age Y ie ld (kg da -1 ) Nitrogen-Phosphorus (kg da-1)
protein yield is obtained by multiplying dry herbage yield with crude protein ratio, crude protein yields were higher at doses and years with greater dry herbage yields.
As compared to control plots, nitrogen and phosphorus-treated plots had greater crude protein yields (Fig. 4). However, only 10-0 kg da-1, 15-0 kg da-1, 5-12 kg da-1, 10-4 kg da-1, 10-8 kg da-1, 10-12 kg da-1, 15-4 kg da-1, 15-8 kg da-1 and 15-12 kg da-1 nitrogen and phosphorus treatments had crude protein yields greater than the general average (47.9 kg da-1).
Figure 4. The crude protein yield of the pasture parcels (kg da-1)
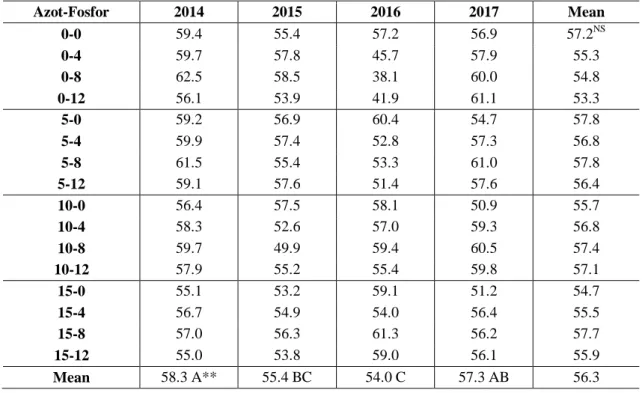
ADF and NDF ratios (%)
ADF ratios and averages of pasture plots with different nitrogen and phosphorus treatments are provided in Table 5 and NDF ratios and averages are provided in
Table 6. The effects of nitrogen and phosphorus treatments on ADF and NDF ratios
were not found to be significant. However, the differences in ADF and NDF ratios of the years were found to be significant (1%).
Table 5. ADF ratios and averages of the pasture parcels (%)
Azot-Fosfor 2014 2015 2016 2017 Mean 0-0 38.5 32.6 31.5 34.8 34.4NS 0-4 34.3 35.8 30.8 35.2 34.0 0-8 31.8 35.7 33.6 36.7 34.5 0-12 34.3 31.5 31.1 37.7 33.7 5-0 38.4 33.0 30.8 33.8 34.0 5-4 37.1 31.2 31.3 36.1 33.9 5-8 36.7 33.3 31.0 36.9 34.5 5-12 36.6 34.4 30.0 35.1 34.0 10-0 35.9 32.8 27.4 30.9 31.7 10-4 37.0 30.1 27.4 35.4 32.5 10-8 39.3 27.9 29.3 36.8 33.3 10-12 37.8 31.7 27.3 37.1 33.5 15-0 37.3 32.1 26.9 32.9 32.3 15-4 36.6 30.4 26.5 35.2 32.2 15-8 38.1 31.3 26.9 33.9 32.6 15-12 38.5 30.5 25.3 34.3 32.1 Mean 36.8 A** 32.1 C 29.2 D 35.2 B 33.3 NS: Non significant, **) P < 0.01, CV(%): 7.74 C rude P ro tei n Y ie ld (kg da -1 ) Nitrogen-Phosphorus (kg da-1)
ADF ratios varied between 31.7-34.5% with an average value of 33.3% and NDF ratios varied between 53.3-57.8% with an average value of 56.3%. The greatest ADF and NDF ratios were observed in the first year, the ratios systematically decreased in the second and third year and both ADF and NDF ratios increased again in the fourth year.
Table 6. NDF ratios and averages of the pasture parcels (%)
Azot-Fosfor 2014 2015 2016 2017 Mean 0-0 59.4 55.4 57.2 56.9 57.2NS 0-4 59.7 57.8 45.7 57.9 55.3 0-8 62.5 58.5 38.1 60.0 54.8 0-12 56.1 53.9 41.9 61.1 53.3 5-0 59.2 56.9 60.4 54.7 57.8 5-4 59.9 57.4 52.8 57.3 56.8 5-8 61.5 55.4 53.3 61.0 57.8 5-12 59.1 57.6 51.4 57.6 56.4 10-0 56.4 57.5 58.1 50.9 55.7 10-4 58.3 52.6 57.0 59.3 56.8 10-8 59.7 49.9 59.4 60.5 57.4 10-12 57.9 55.2 55.4 59.8 57.1 15-0 55.1 53.2 59.1 51.2 54.7 15-4 56.7 54.9 54.0 56.4 55.5 15-8 57.0 56.3 61.3 56.2 57.7 15-12 55.0 53.8 59.0 56.1 55.9 Mean 58.3 A** 55.4 BC 54.0 C 57.3 AB 56.3 NS: Non significant, **P < 0.01, CV(%): 9.07
Relative feed value
Relative feed values (RFV) and averages of the pasture plots treated with different nitrogen and phosphorus doses are provided in Table 7. The effects of different nitrogen and phosphorus treatments on relative feed values were not found to be significant, but the differences in relative feed values of the years were significant (1%). Relative feed values varied between 100.7-112.6 with an average value of 105.3.
With regard to ADF and NDF ratios of the years, it was observed that ADF and NDF ratios systematically decreased, thus relative feed values increased in the first three years. However, in the fourth year, ADF and NDF ratios started to increase, thus relative feed values get into decreasing trend again.
Discussion
Fertilizer doses increased weight-based ratios of the legumes in botanical composition. However, legume ratios decreased in 2014 and 2017 with lower precipitation levels than the other years. Phosphorus fertilizers were reported to increase legume ratios in botanical composition (Hatipoglu et al., 2001; Polat et al., 2007; Kacorzyk and Glab, 2017). However, phosphorus fertilization was recommended for pastures with less than 10% legume ratio in botanical composition (Altin et al., 2005).
Since the legume ratio in present botanical composition was 2.33%, phosphorus fertilization was not necessary for these pasture plots. Phosphorus supplementation not only meets the phosphorus needs of the plants, but also improves nitrogen efficiency (Black, 1968 and Whitehead, 1995). Therefore, phosphorus fertilizers to be made to enrich the botanical composition should be applied together with nitrogenous fertilizers.
Table 7. Relative feed values and averages of the pasture parcels
N-P 2014 2015 2016 2017 Mean 0-0 92.2 106.7 105.5 101.4 101.5NS 0-4 97.0 98.6 135.6 100.5 107.9 0-8 95.5 97.9 154.7 93.6 110.4 0-12 104.1 112.5 143.4 90.6 112.6 5-0 93.0 103.7 100.4 106.6 101.0 5-4 93.2 104.8 114.0 98.8 102.7 5-8 91.2 105.9 113.6 92.0 100.7 5-12 95.1 100.9 119.1 99.8 103.7 10-0 100.8 102.5 108.1 119.1 107.6 10-4 95.8 116.2 111.2 96.2 104.9 10-8 90.9 127.5 103.4 92.6 103.6 10-12 95.6 108.3 114.0 93.8 102.9 15-0 101.0 111.9 107.1 115.1 108.8 15-4 99.1 110.6 121.7 101.5 108.2 15-8 96.7 106.7 103.3 103.6 102.6 15-12 100.2 113.0 109.2 103.4 106.4 Mean 96.3 C** 108.0 B 116.5 A 100.5 C 105.3 NS: Non significant, **P < 0.01, CV(%): 11.78
With the fertilizer treatments, green and dry herbage yields increased from the first year, increases went on in the second and third year. However, in the fourth year, both green and dry herbage yields started to decrease again. There are two reasons of these trends. The first one was the lower precipitations of the first and the forth years than the other years. The second one was limited yield increase potential of fertilizers. It is normal to expect a yield increase with fertilizers, but such an increase will not be infinite. Yields reach to a peak value and then a stable yield levels expected. In present study, yields reached to a peak value in the third year, but a table peak levels were not attained in the fourth year because of lower precipitations. Kacorzyk and Glab (2017) carried out a study over the pastures for 10 years and indicated significant relationships between climate factors (temperature and precipitation) and yield parameters and reported lower yields in years with lower temperature and precipitation levels.
It was reported in previous studies that nitrogen and phosphorus fertilizations increased herbage yields of the pastures (Polat et al., 2007), nitrogen treatments alone increased dry matter yields (Aydin and Uzun, 2005; Balabanli et al., 2010; Budakli and Carpici, 2011), nitrogen treatments increased herbage yields of a pasture (with an average yields of 151.5 kg da-1) three folds (Celik et al., 2001). It was reported in previous studies that fertilizers increased dry herbage yield of a pasture from 166.3 kg da-1 to 386.4 kg da-1 (Hatipoglu et al., 2005), increased green herbage yields from
538.5 kg da-1 to 1228.5 kg da-1 and dry herbage yields from 337.6 kg da-1 to 808.0 kg
da-1 (Gur, 2007), increased green herbage yields by 189.5% and dry herbage yields by
163.3% (Altin et al., 2010).
The greatest yields in present study were obtained from 10 kg da-1 nitrogen and 8 kg
da-1 phosphorus treatments. Similarly, Cinar et al. (2005) in a tree-year study reported
the greatest yield levels for 10 kg da-1 nitrogen and 5 kg da-1 phosphorus treatments, Hatipoglu et al. (2005) and Dasci et al. (2009) recommended 10 kg da-1 nitrogen treatments. Altin et al. (2005) recommended 7.5-10 kg da-1 nitrogen and 5-10 kg da-1 phosphorus treatments for high-altitude Eastern Anatolia pastures. Present findings comply with all those earlier ones.
The crude protein yield of control (0-0 kg da-1) plot (23.8 kg da-1) increased to 47.9 kg da-1 with fertilizer treatments. Since crude protein yield is obtained by multiplying dry herbage yield with crude protein ratio, the variations in crude protein yields were similar with the variations in dry herbage yields. The crude protein yields were almost doubled (101.3%) with fertilizer treatments. It was reported in previous studies that nitrogenous fertilizers increased crude protein yields (Andic et al., 2001; Polat et al., 2007; Balabanli et al., 2010; Budakli Carpici, 2011).
It was reported in previous studies that phosphorus fertilizers did not have significant effects on ADF and NDF ratios (Budakli Carpici, 2011; Budakli Carpici et al., 2012), nitrogenous fertilizers combined with phosphorus and potassium reduced ADF and NDF ratios (Balabanli et al., 2010) and increasing nitrogen doses decreased ADF ratios of the herbage (Budakli Carpici, 2011). In present study, effects of fertilizer treatments on ADF, NDF ratios and RFV were not found to be significant. Therefore, great variations in ADF, NDF ratios and RFV should not be expected from one-year fertilization plans. Thusly, Heady and Child (1994) reported that fertilizers did not improved chemical composition of the herbage, but increased freshness and leaf ratios and stay-green durations of the herbage. However, multi-year studies may reveal significant variations in ADF, NDF ratios and RFV of pasture herbage.
Conclusion
Present nitrogen and phosphorus treatments increased legume ratio in botanical composition, and also systematically increased green herbage yields, dry herbage yields, crude protein yields and relative feed values and reduced ADF and NDF ratios during the initial three years. There was a direct relationship between the precipitations and herbage yields, the lower values were observed in 2014 and 2017 with lower precipitations than the other years.
The effects of nitrogen and phosphorus doses on ADF, NDF ratios and relative feed values of the years were found to be significant, however, the effects of fertilizer treatments with the same year were not found to be significant. Therefore, significant changes in ADF, NDF ratios and relative feed values should not be expected from one-year fertilization programs.
Nitrogen and phosphorus treatments generally yielded greater values than the control plots. However, cost-benefit analyses should be performed while preparing fertilization programs and the doses yielding greater values than the general averages should be selected.
In present study, the greatest green herbage yield, dry herbage yield and crude protein yield were obtained from 10 kg nitrogen and 8 kg phosphorus treatments.
Therefore, this combination (10-8 kg da-1 N-P) could be recommended for fertilization programs to be applied over the pastures of Eastern Anatolia region or over the pastures with similar ecological conditions.
The effects of applied nitrogen and phosphorus doses on plant nutrients and soil structure were not investigated in this study. Therefore, it is suggested to investigate the
effects of recommended 10 kg da-1 nitrogen and 8 kg da-1 phosphorus doses on the plant
nutrients and the soil structure in the future.
REFERENCES
[1] Altin, M. (1992): Meadow Pasture Improvement. – Trakya University, Agriculture Faculty of Tekirdag, Publication No: 152, Textbook No:3, Tekirdag.
[2] Altin, M., Gokkus, A., Koc, A. (2005): Meadow Pasture Improvement. – Ministry of Agriculture and Rural Affairs, General Directorate of Agricultural Production and Development, Ankara.
[3] Altin, M., Tuna, C., Gur, M. (2010): Effects of fertilizer application on forage production and botanical composition of floodplain and steppe rangelands of Tekirdag. – Journal of Tekirdag Agricultural Faculty 7(2): 191-198.
[4] Andic, C., Comakli, B., Mentese, O. (2001): Doğal bir merada gübreleme, otlatmaya başlama zamanı ve otlatma yoğunluğunun kuru ot ve ham protein verimi ile otun ham protein oranına etkileri. – Türkiye 4. Tarla Bitkileri Kongresi, 17-21 Eylül 2001, Tekirdağ (in Turkish).
[5] Aydin, I., Uzun, F. (2005): Nitrogen and phosphorate fertilization of rangelands affects yield, forage quality and the botanical composition. – Europ. J. Agronomy 23: 8-14. [6] Balabanli, C., Albayrak, S., Yuksel, O. (2010): Effects of nitrogen, phosphorus and
potassium fertilization on the quality and yield of native rangeland. – Turkish Journal of Field Crops 15(2): 164-168.
[7] Basaran, U., Mut, H., Onal, O., Acar, Z., Ayan, I. (2011): Variability in forage quality of Turkish grass pea (Lathyrus sativus L.) landraces. – Turkish Journal Field Crops 16: 9-14. [8] Black, A. L. (1968): Nitrogen and phosphorus fertilization for production of crested
wheatgrass and native grass in northeastern Montana. – Agron. J. 60: 213-216.
[9] Budakli Carpici, E. (2011): Changes in leaf area index, light interception, quality and dry matter yield of an abandoned rangeland as affected by the different levels of nitrogen and phosphorus fertilization. – Turkish Journal of Field Crops 16(2): 117-120.
[10] Budakli Carpici, E., Tunali, M. M., Celik, N. (2012): Effects of nitrogen and phosphorus fertilization on dry matter yield and quality of an abandoned rangeland. – Option Mediterraneennes A(102): 333-336.
[11] Celik, N., Bayram, G., Budakli, E. (2001): Economic aspects of fertilizer application in pastures. – Journal of Ministry of Agriculture and Rural Affairs 139: 48-51.
[12] Cinar, S., Hatioglu, R. (2015): Quality characteristics of the mixtures of some warm season perennial grasses with alfalfa (Medicago sativa L.) under irrigated conditions of Cukurova. – Turk J Field Crops 20(1): 31-37.
[13] Cinar, S., Avci, M., Hatipoglu, R., Kokten, K., Atis, I., Tukel, T., Aydemir, S., Yucel, H. (2005): Research on effects of different doses of nitrogen and phosphorus on botanical composition and hay yield and quality of upland site of a rangeland in Hanyeri village of Tufanbeyli province of Adana city. – Turkey 6th Field Crops Congress, 5-9 September 2005, Antalya.
[14] Dasci, M., Comakli, B., Gullap, M. K., Fayetorbay, D. (2009): The effect of fertilization on range quality score, range health class and similarity index in range sites with different topographical structure. – Turkey VIII. Field Crops Congress, 19-22 October 2009, Hatay.
[15] Ergene, A. (1997): Fundamentals of Soil Science. Expanded 7th ed. – Oz Education Publishing Distribution Co. Ltd. Sti.
[16] Gur, M. (2007): Comparison of different vegetation measurement methods in determining botanical composition and yield potential of the pasture in Yorukler village of Hayrabolu district, Tekirdag. – MSc. Thesis, Namik Kemal University, Graduate School of Natural and Applied Sciences, Department of Field Crops, Tekirdag.
[17] Hatipoglu, R., Avci, M., Kilicalp, N., Tukel, T., Kokten, K., Cinar, S. (2001): Research on the effects of phosphorus and nitrogen fertilization on the yield and quality of hay as well as the botanical composition of a pasture in the Cukurova region. – Turkey 4th Field Crops Congress, 17-21 September 2001, Tekirdag, Volume III, p. 1-6.
[18] Hatipoglu, R., Avci, M., Cinar, S., Kokten, K., Atis, I., Tukel, T., Kilicalp, N., Yucel, C. (2005): Research on effects of different doses of nitrogen and phosphorus on botanical composition and hay yield and quality of bottom land site of a rangeland in Hanyeri village of Tufanbeyli province of Adana city. – Turkey 6th Field Crops Congress, 5-9 September 2005, Antalya.
[19] Heady, F. H., Child, R. D. (1994): Rangeland Ecology and Management. – Westview Press, Inc., Colorado.
[20] IFA (1999): Fertilizer Use by Crop. 4th ed. – International Fertilizer Industry Association, Rome.
[21] Kacorzyk, P., Głąb, T. (2017): Effect of ten years of mineral and organic fertilization on the herbage production of a mountain meadow. – J. Elem. 22(1): 219-233.
[22] Kalayci, M. (2005): Use JUMP with Examples and Variance Analysis Models for Agricultural Research. – Anatolia Agricultural Research Institute Directorate Publication, Eskisehir.
[23] Karaman, M. R. (2012): Plant Nutrition. – Gubretas Guide Books Series: 2, Istanbul. [24] Morrison, J. (2003): Hay and Pasture Management. – In: University of Illinois at
Champaign (ed.) Illinois Agronomy Handbook. University of Illinois, Urbana-Champaign.
[25] Mut, H., Ayan, I., Acar, Z., Basaran, U., Onal Asci, O. (2010): The effect of different improvement methods on pasture yield and quality of hay obtained from the abandoned rangeland. – Turkish Journal of Field Crops 15(2): 198-203.
[26] Polat, T., Bukun, B., Okant, M. (2007): Dose response effect of nitrogen and phosphorus on forage quality, yield and economic return of rangelands. – Pak. J. Bot. 39(3): 807-816. [27] Sezen, Y. (1995): Fertilizers and Fertilization. – Agriculture Faculty of Ataturk
University, Erzurum.
[28] Steel, G. D., Torrie, J. H. (1980): Principles and Procedures of Statistics: A Biometrical Approach. 2. ed. – McGraw-Hill, New York.
[29] Van Dyke, N. J., Anderson, P. M. (2000): Interpreting a Forage Analysis. – Alabama Cooperative Extension. Circular ANR-890.