.Λ)·
·ϊ
Vгъ;.
Γ*ί" ~·. ι·’ - · ρ f f Sr '. <■ - ' · í v · V ' · ¿ V ^ V ‘ ï “ ' ■· ’ - - ■ i '* ^ · * » ' W 'Μ 'ν < Ι···(* ίΛ ,* ^ · 4^ · ■ c^>·· 7 I 3 3 í fС -/
CONTROLLED LATERAL AND PERPENDICULAR
MOTION OF ATOMS ON METAL SURFACES
A THESIS
SUBMITTED TO THE DEPARTMENT OF PHYSICS AND THE INSTITUTE OF ENGINEERING AND SCIENCE
OF BILKENT UNIVERSITY
IN PARTIAL FULFILLMENT OF THE REQUIREMENTS FOR THE DEGREE OF
MASTER OF SCIENCE
By
Alper Buldum
November 1994
9и
111
■ З - і б "¿ 2 .- Í
I certify that I have recid this thesis and that in my opinion it is fully adequate, in scope and in quality, as a dissertation for the degree of Master of Science.
Ûi/U·
Prof. Salim Çıracı (Supervisor) I certify that I have read this thesis and that in my opinion it is fully adequate, in scope and in quality, as a dissertation for the degree of Master of Science.
Prof. Walter A. Harrison
I certify that I have read this thesis and that in my opinion it is fully adequate, in scope and in quality, as a dissertation for the degree of Master of Science.
Prof. Atilla Aydınlı
Approved for the Institute of Engineering and Science:
Prof. Mehmet
Abstract
CONTROLLED LATERAL AND PERPENDICULAR
M OTION OF ATOMS ON METAL SURFACES
Alper Buldum
M. S. in Physics
Supervisor: Prof. Salim Çıracı
November 1994
Nanoscale modification of matter has been the subject of interest. Recently, several experimental studies have demonstrated that by using a scanning tunneling microscope one can translate atoms on metal surfaces to a desired position. Furthermore, it has been shown that an atom between surface and tip can be transferred reversibly which results in bistable conductance. The controlled dynamics of adsorbed species has opened a new field of research. This thesis work provides a theoretical investigation of the controlled lateral and perpendicular motion of an inert gas atom (Xe) on metal surfaces.
The lateral motion of Xe on the Ni(llO) and P t ( l l l ) surfaces is manipulated by a W tip. The interaction energy of the physisorbed atom with the tip and metal surface is described by an empirical potential. Using molecular statics the energy surfaces are calculated and the adsorbtion sites are determined. By using the molecular dynamics calculations, the variation in the coordinates of the adsorbate Xe with the tip moving at a given height are obtained. Three different modes of Xe translation are distinguished depending on the height of the tip. These are i) carriage on the tip, ii) pushing and, iii) pulling modes. The range
of the tip height where one of these modes occur is strongly depended on the relaxation of electrodes and the geometry of the tip.
Controlled and reversible transfer of atoms between the metal surface and the tip is studied by the transfer of Xe between two flat P t ( l l l ) surfaces. Physisorption of Xe on the P t ( l l l ) surface is studied by an empirical potential including short and long-range interactions and yielding correct account of several experimental data. Effective charge on Xe and the dipole moment constructed therefrom are calculated as a function of the Xe-surface separation. The potential energy curve of Xe between two P t ( l l l ) surfaces and quantum states of Xe therein are calculated as a function of the applied voltage and separation between two P t ( l l l ) surfaces. Within this model, various mechanisms, such as tunneling of Xe, dipole excitation and resonant tunneling, electromigration contributing to the transfer of Xe are examined. The transfer rate of Xe is then calculated for different mechanisms. Its dependence on the bias voltage is explored. The overall behavior of the total transfer rate is not a power law. While at low bias voltages thermal assisted atom tunneling is effective, the dipole excitation and resonant tunneling becomes dominant at high bias voltages.
K e y w o r d s ; Scanning tunneling microscope, atom transfer, atom switch, physisorption, chemisorption, Anderson-Newns model, molec ular statics, molecular dynamics, inelastic electron tunneling, electromigration, dipole excitation, resonant tunneling.
özet
ATOMLARIN METAL YÜZEYLERİNDE YATAY VE DÜŞEY
YÖN D E KONTROLLÜ HAREKETLERİ
Alper Buldum
Fizik Yüksek Lisans
Tez Yöneticisi: Prof. Salim Çıracı
Kasım 1994
Geçenlerde bazı deneyler, tarama tünelleme mikroskobu (T T M ) kullanılarak, metal yüzeylerinde bulunan atomların istenilen pozisyonlara taşınabileceğini gösterdi. Daha fazlası, bir atomun T T M ’nin iki elektrodu arasında tersinir bir şekilde, kontrollü olarak hareket ettirilebileceği gösterildi ki bu durumda iki sabit iletkenlik değeri elde ediliyordu. Adsorbe olmuş atomların ya da moleküllerin kontrollü dinamiği yeni bir araştırma alanı açtı. Bu tez çalışması, bir asal gaz atomunun (Xe) metal yüzeylerinde, yatay ve düşey yönde kontrollü hareketlerinin teorik olarak incelenmesidir.
Xe atomunun Ni(llO) ve P t ( l l l ) yüzeylerinde yatay hareketleri Tungsten bir iğne tarafından sağlanıyor. Bu atomun iğne ve metal yüzeğiyle etkileşim enerjisi amprik bir potansiyelle ifade edildi. Moleküler statik metoduyla, potansiyel enerji yüzeyleri hesaplandı ve adsorbsiyon pozisyonları tayin edildi. Moleküler dinamik metoduyla, verilen bir iğne yüksekliğinde Xe atomunun koordinatlarındaki değişiklikler elde edildi. İğne yüksekliğine bağlı olarak Xe atomunun üç çeşit hareketi keşfedildi: 1) İtilme 2) Çekilme 3) İğneye yapışarak taşınma.
Xe atomunun metal yüzeyi ile iğne arasındaki kontrollü ve tersinir hareketi
iki düzgün P t ( l l l ) yüzeğiyle çalışıldı. Xe atomunun P t ( l l l ) yüzeğiyle etkileşimi için kısa mesafe ve uzun mesafe etkileşimlerini içeren ve pek çok deneysel veriyle test edilmiş bir amprik potansiyel kullanıldı. Atomun efektif yükü ve metal yüzeyi ile arasında oluşan dipol momenti, atomla metal yüzeyi arasındaki mesafenin bir fonksiyonu olarak hesaplandı. Xe atomunun iki P t ( l l l ) yüzeyi arasındaki potansiyel enerji eğrisi ve bu eğrinin özdeğerleri ve özfonksiyonları uygulanan voltajın ve iki elektrot arasındaki mesafenin bir fonksiyonu olarak hesaplandı. Bu modelin içinde, Zenon’un tünellemesi, dipol uyarılması ve rezonant tünelleme, elektrogöç gibi Xe atomunun geçişinde rol oynayan çeşitli mekanizmalar incelendi. Xe atomunun geçiş hızı çeşitli mekanizmalara göre hesaplandı. Bu hızın uygulanan voltaja nasıl bağlı olduğu keşfedildi. Toplam geçiş hızının genel davranışı akımın ya da voltajın üstel bir fonksiyonu şeklinde değil. Düşük voltajda sıcaklık destekli atom tünellemesi etkili iken yüksek voltajda dipol uyarılması ve rezonant tünelleme daha etkin oluyor.
Anahtar
sözcükler: Tarama tünelleme mikroskobu, atom geçişi, atom anahtarı, tünelleme, fiziksel adsorbsiyon, kimyasal adsorbsiyon, Ander son Newns modeli, moleküller statik, moleküler dinamik, elastik olmayan elektron tünellemesi, elektrogöç, dipol uyarılması, rezonant tünelleme.
Acknowledgement
I would like to express my deepest gratitude to my supervisor Prof. Salim Çiraci not only for his invaluable guidence, efforts and encouragement but also for his academic personality as he is a model of a scientist for me.
I would like to thank Prof. §. Erkoç for his collaboration for lateral motion of Xe on the Ni(llO) surface and for his support for molecular dynamics simulation technique.
I would like to thank Prof. W. A. Harrison for his invaluable discussions and remarks.
Lastly, I would like to thank A. K. Tiirkoglu and my other friends for their moral support.
Contents
Abstract i
Özet iii
Acknowledgement v
Contents vi
List of Figures vii
List of Tables viii
1 IN T R O D U C T IO N 1
LI ATOMIC-SCALE MODIFICATIONS AND MANIPULATIONS . 2
1.1.1 Positioning single atoms by S T M ... 4
1.1.2 Atom Switch 6 1.2 Forces in S T M ...: ... 9
1..3 Physisorption and C hem isorption... 11
1.3.1 P h ysisorption ... 11
1.3.2 Chemisorption... 13
2 C O N T R O L L E D LATER AL M O T IO N OF X e 16 2.1 Xe Motion on the Ni(llO) Su rface... 17
2.1.1 Interaction Potential and Atomic M o d e l ... 17
2.1.2 Molecular S ta tic s ... 19
2.1.3 Controlled Lateral Translation: D y n a m ic s ... 22
2.2 Xe Motion on the P t ( l l l ) S urface... 28
2.2.1 Interaction Potential and Atomic Model 28 2.2.2 Potential Energy S u r fa c e s ... 30
2.2.3 Controlled Lateral Translation: D y n a m ic s ... 31
3 C O N T R O L L E D P E R P E N D IC U L A R M O T IO N OF X e 37 3.1 POTENTIAL ENERGY OF X e ... 40
3.2 Xe TRANSFER WITH BIAS V O LTA G E ... 43
3.2.1 Effective charge on the Xe a t o m ... 43
3.2.2 Transfer Rates for the Asymmetric P oten tial... 47
3.3 Other M e ch a n is m s ... 51
3.3.1 E lectrom ig ra tion ... 51
3.3.2 Inelastic Electron T u n n elin g... 53
4 C O N C L U S IO N 61
List of Figures
1.1 The process for sliding an atom across a s u r fa c e ... 5
1.2 A linear chain of seven xenon atom s... 6
1.3 A two-terminal switch ... 7
1.4 The time dependence of the current during operation of the switch. 8 1.5 The transfer rate of a xenon a t o m ... ... 9
2.1 Schematic representation of the model 20 2.2 Potential energy su rfaces... 21
2.3 Variation of minimum energy U and height /i of X e ... 22
2.4 Lateral translation of Xe along the [100] d ir e c t io n ... 24
2.5 Lateral translation of Xe along [110] direction and [112] direction 25 2.6 Forces on the Xe atom for hi = 5 . 0 A ... 26
2i7 Lateral translation of Xe in the case of relaxed electrod es.... 27
2.8 Potential energy su rfaces... 32
2.9 Contours of the potential energy surfaces... 33
2.10 Lateral translation of Xe on the P t ( l l l ) 's u r f a c e ... 34
2.11 The force due to sample on the Xe a t o m ... 35
3.1 Potential energy curves and energy b a r r ie r ... 41
3.2 The transfer rate' for the tunneling of the Xe a t o m ... 43
3.3 Charge on the Xe a to m ... 46
3.4 Potential energy curves for different bias v o l t a g e s ... 48
3.5 The transfer rates due to tunneling and thermal probabilities as a function of applied v o lt a g e ... 50
3.6 The total dipole moment /i of Xe on P t ( l l l ) surface... 57
3.7 The transfer rates 60
List of Tables
2.1 Energy parameters for two body Lennard-Jones p oten tia l... 18
2.2 Energetics of Xe on the Ni(llO) su rface... 21
2.3 Parameters for On-Top potential ... 30
Chapter 1
IN TR O D U C TIO N
The article^ titled Surface Studies by Scanning Tunneling Microscopy ” by Binnig, Rohrer, Gerber and Weibel opened a new era in surface physics in 1982. There was a description of a new device, Scanning Tunneling Microscope (STM ), which was capable of real space imaging of surfaces with atomic resolution. It attracted great interest immediately and it spread out to the world in a short time. Nowadays, there are a large number of STM’s in operation, in many fields of research, not only in surface physics but in chemistry and biology as well. After the invention of STM, many local probe methods were introduced. For example, Binnig, Quate and Gerber invented a new device, Atomic Force Microscope (AFM ), which measured the force generated between the tip and the sample surface.^
STM is simply based on electron tunneling. A sharp tip is placed very close to the surface, to form a tunnel junction. This junction is very sensitive to the width of the tunnel barrier. The surface is scanned by the tip and hence by the tunneling current concentrated at the apex of the tip. This is the topography of the surface. The images correspond to local density of states at the Fermi level. Tersoff and Hamann developed a theory of STM.^ They used Bardeen’s transfer Hamiltonian formalism'* to derive an expression for the current.
27re
where f { E ) is the Fermi-Dirac distribution function. is the tunneling matrix element between the states of the metal tip and of the sample surface:
JcBir.Vrl,,
- CVVv)
(1.2)
Ef, and E^ are the energies of the states in the absence of the tunneling and U is the sample bias voltage. This expression is simplified to read
Chapter 1. INTRODUCTION
2
I < x Y ^ \ M r o ) \ H { E , - E j ) (1.3) The right hand side is the surface local density of states (LDOS) at the Fermi level Ep at the position fo of the point tip p(Ep,fo). The tunneling current is not directly related to the position of atomic nuclei but related to the local density of states at the Fermi level. Tersoff-Harnann theory is valid for the tunneling between s-type states in the absence of significant tip- sample interaction effects. Another important application of STM is the surface spectroscopy where information on electronic surface states are derived from tunneling current vs. sample-bias voltage characteristics.
1.1
ATOM IC-SCALE M ODIFICATIONS
A N D M ANIPULATIONS
The STM has three main ingredients: atomically sharp tip, intense electric field and tunneling electrons. In addition to its main operation of surface imaging, it can deposit, remove and arrange surface atoms, affect the direction of magnetization, dissociate molecules, attach molecules to the substrates, detach molecules from substrates, induce phase transitions, enhance reactions, move atoms along the substrate and transfer atoms between the tip and substrate in a controlled way.^ The experiments are performed at the close proximity of the tip in air, in ultra-high vacuum and also at a solid liquid interface. They provide valuable information about atomic and electronic structure, inter-atomic, intermolecular interactions, field effects and many other microscopic phenomena.
Chapter 1. INTRODUCTION
Surface modification on the atomic scale was first demonstrated by Becker et al.® They produced atomic scale hillocks on germanium surface by applying 4 volts bias on the tip. The Ge atoms on the tip were transferred to the sample so a field induced transfer of atomic species across the gap from the tip to the sample was realized. STM lithography was first done by Rigger et al.^ and McCord et al.® Rigger .scratched silicon surface with the tip touching to the surface. The pattern was a series of parallel lines in the h}’drocarbon films covering the surface. Lyo and Avouris removed and redeposited individual Si atoms from S i ( l l l ) surface reducing the tip-sample distance.^ Foster and Frommer described how to organize organic molecules on graphite surface*®’*^ and studied the manipulation of individual molecules. They removed a molecule of phthalate by pulsing the tip with a 3.5 V threshold voltage. The STM was also used in the liquid environments such that GaAs surface was etched^^ in a NaOH, EDTA solution and gold lines on p-type GaAs in a buffered solution of KAu{CN)^ produced.
An interesting usage of STM is for phase transitions . There is heating in the local scale by the electron beam from the STM tip where this heating is a function of thermal conductivity and the mean free path of electrons. In the crystalline materials the temperature rise is only a fraction of a degree but in amorphous materials heating by the tunneling electrons rise the temperature to higher values. Staufer et al.^‘‘ examined the metallic glasses and formed a small pool of liquid under the tip. The}' increased the voltage to 2 volts and exceeded the melting temperature. Hydrogenated amorphous silicon is a material with low thermal conductivity and short mean free path. Jahanmir et al.^® created lines by raising the temperature above the transition temperature and changed the film of amorphous silicon to crystalline state.
The storage of digital information is based on the polarization of magnetiza tion in small magnetic domains. The STM with a magnetized tip could write on magnetic hard disks by changing local magnetization.’ ®’’ ^
Surface modification in the form of the creation of hillocks and craters was relatively clarified by Mamin, Guethner and Rugar with their work for atomic- emission from a gold tip to a gold substrate.’ ® Gold atoms were emitted from the
tip in a controlled and reproducible way . They measured the threshold voltage for field-evaporation in close tip-sample separation and obtained O.IV/A which is comparatively small with respect to IV/A which is for the field to evaporate atoms from a tip in free space as in Field-Ion Microscope (FIM).'^ They proposed that the barrier height for field-evaporation was reduced by overlap of the atomic potentials when a metal surface was brought close to the tip.
Recently, Eigler and his collaborators performed two very important experiments, namely: i) Precise repositioning of an atom on metal surfaces.^® ii) Controlled and reversible motion of an atom realizing atomic scale switch. These experiments are very important because these were the first for controlling individual atoms like a child’s play with a toy. This can take science and technology to a point that atomic scale devices can be produced or all the accumulated knowledge at a great library can be written in a few cm^ area.The subject matter of this thesis is the theoretical investigation of these two experiments.
Chapter 1. INTRODUCTION
4
1.1.1
Positioning single atoms by STM
In the first experiment, Eigler and Scweizer^° drag an atom over the surface from one location to another location without lifting the atom off the surface by carefully tuning the magnitude and direction of the tip force. The experiments were performed using an STM in an ultra-high-vacuum system and at 4K. After dosing the Ni(llO) surface with Xe, they took images as each Xe atom appears as a l.bA-high bump on the surface at random locations.The Xe 6s resonance, although lying close to the vacuum level, is the origin of the Fermi-level local state density which renders Xe visible in the STM.^^
In figure 1.1, the steps for the controlled lateral motion of Xe are shown. (1) The atom is located and the tip is placed directly above it by operating the STM in the imaging mode. (2) The tip is lowered to a position where the atom-tip interaction is sufficient for the motion of the atom. This was achieved by changing the required tunneling current to a higher value in the range 1 — 6 x 10“ ®/4. (3,4)
Chapter 1. INTRODUCTION
N , . , , .
"
5
2 \ f / / 4
SURFACE
F ig u r e 1.1: The process for sliding an atom across a surface
(1) The atom is located and the tip is placed directly above it. (2) The tip is lowered to a position where the atom-tip interaction is sufficient for the motion of the atom. (3,4) The tip is moved to a desired location, dragging the atom with it. (5) The tip is withdrawn to a position where the atom-tip interaction is negligible. The atom is left bound to the surface at the desired location.
The tip is moved to a desired location at a speed 4A per second, dragging the Xe with it. (5) Finally, the tip is withdrawn to a position where the atom- tip interaction is negligible. The Xe is left bound to the surface at the desired location.
The STM tip was produced from tungsten wire. The true chemical identity and the structure of the outermost atoms of the tip are not known yet. Thex'e was a threshold height below which the tip must be located to be able to move xenon atoms parallel to the rows of nickel atoms (the [110] direction of Ni(llO) surface), and a lower threshold height to move perpendicular to the rows of nickel atoms (the [100] direction of Ni(llO) surface) for any given tip and bias voltage. The magnitude and sign of the applied voltage had no significant effect on the threshold tip height. In figure 1.2 a linear multimer is shown which was produced by this process.
The Nickel (110) surface had an unreconstructed rectangular unit cell and the exact xenon periodicity of the xenon spacing was from the crystalline structure
Chapter 1. INTRODUCTION
1 1
F ig u re 1.2: A linear chain of seven xenon atoms
A linear chain of seven xenon atoms bound to the Nickel (110) surface is shown. From reference 23.
of the underlying nickel surface. The xenon-xenon spacing along the row was uniform with 5.0 ± 0.2A. This indicated that the xenon-nickel interaction dominates over the .xenon-.xenon interaction.
1.1.2
A to m Switch
The second important experiment is the creation of a bistable switch by Eigler, Lutz and Rudge. The switch derives its function from the motion of a single atom. This is an atomic-scale electronic device as called ''atom switch". As the conduction electron wave functions decay exponentially in the tunnel barrier, the conductance of the S T M ’s tunnel junction depends exponentially on the spacing between the electrodes. Slight rearrangements of the atoms in the current carrying region of the tunnel junction would lead to measurable changes in the conductance. The reversible motion of an atom between the surface and the tip of an STM becomes operation o f a two terminal switch as in figure 1.3.
The switch was constructed using an STM in an ultra-high-vacuum system at 4 / i . They slide the Xe atom like in the first process to a kink site along a
Chapter 1. INTRODUCTION
^ N
SURFACE
F igure 1.3: A two-terminal switch
The atom is reversibly transferred by applying a voltage pulse and the conductance of the tunnel junction changes according to the location of the atom.
monatomic step as it would enhance the probability that the Xe atom would bind to the same site whenever it is transferred to the surface. Then the feedback loop was turned off and the tip left at a fi.xed position above and oA to the side of the Xe atom. The height of the tip was then adjusted to have a tunnel junction resistance of l.oMCl with the tip biased at —0.02 volts with respect to the sample. During the operation of the switch, the STM was completely static. In figure 1.4 the time variation of the current during operation is displayed. It began with the Xe on the surface (A in figure 1.4) and the tip biased at —0.02 volts resulting in a 1.3 X 10“ ®/! current. A 4-0.8 volt pulse is applied to the tip for 64 msec.Then
the tip bias changed to —0.02 volts. (B is the voltage pulse in figure 1.4). The high conductance state of the switch was established by the pulse which have a resistance of 220KQ,. A —0.8 volt pulse was applied to toggle the switch back to its initial position for 64 msec, after which the bias was returned to —0.02 volts. (D is the voltage pulse in figure 1.4) The repetitions in figure 1.4 demonstrate the reproducibility of the switch toggling.
Eigler et al. took images during the operation of the switch and showed that Xe was on the surface at the low conductance state. At high conductance state, the Xe atom disapeared and the resolution of the atomic structure of the
Chapter 1. INTRODUCTION
F ig u re 1.4: The time dependence of the current during operation o f the switch. In the low-conductance state (A ), the tip biased at -0.02 volts and the Xe bound to the surface. A -bO.8 volt pulse is applied (B) to the tip for a duration of 64 msec after which the bias was turned to —0.02 volts. Thus, the Xe is transferred to the tip and the high-conductance state is established (C). A reverse -0 .8 volt pulse is applied for 64 msec.(D) to reestablish the low- conductance state. From ref. 23
nickel surface was enhanced which shows that the tip structure and its electronic state were changed owing to the presence of the Xe atom on the tip. When they toggled the switch back to low conductance state, Xe again appeared on the surface showing the reversible motion. They found that the motion o f the Xe atom was always towards the positively biased electrode (same direction with the tunneling electrons). Depending on the location of xenon on the surface, (i.e. kink site, terrace) the measured conductance ratios cr,/<Tt varied from near unity to 7.
They measured a delay between the onset o f the voltage pulse and the moment when the conductance changed due to the motion o f the atom. Repeated measurements for a fixed tip-sample showed a simple reindomness for the delay. The probability for the Xe atom remaining on the surface for a time t prior to transferring to the tip was fitted to the expression P{t) = exp(—t/T) where the
Chapter 1. INTROD UCTION
F ig u re 1.5: The transfer rate of a xenon atom
The transfer rate of a xenon atom from the Nickel(llO) surface to the STM tip as a function of the current during the applied voltage pulse. From reference 23
characteristic time for the process r was in good agreement with the mean delay. In figure 1.5 the transfer rate (the inverse o f the mean delay) as a function o f the current is shown. It is interpreted as a power law dependence upon the current as In order to better understand the controlled motion of atoms, brief information about forces in STM, physisorption and chemisorption o f atoms on metal surfaces is given in next sections.
1.2
Forces in ST M
The forces in STM due to the tip-sample interaction are crucial. They can derive atomic-scale modifications and manipulations. The sign and character of the tip force vary according to the value o f the tip-sample separation r. At large c, it is attractive and Van der Waals force originating from the correlations between electronic fluctuations of the electrodes. This force is weak and uncorrugated
Chapter 1. INTRODUCTION
10
when the individual atoms are considered but may be large for the whole tip as it has a long range character. At small separations, the short-range force dominate the long-range VdW force. The short-range force have quantum-chemical origin and decay exponentially in the weak attractive region because of exponentially decaying wave-functions in the barrier.
For a better understanding the origin of the forces, Ciraci et al. calculated the interaction energy Ei{z) between two rigid Al(OOl) slabs from self-consistent- field (SCF) calculations within the local density approximation^'* finding that Ei{z) was strong but short ranged because the total energy of the tip-sample for a given separation was determined by charge-density overlap with only small deviations due to adhesive bond formation. Then they noted that for z > Zg, (ze is the separation between the top-most layers of the two slabs where Ei{z) is minimum.) Ei(z) could be approximated by an exponential function. Rose et al. proposed a universal scaling relation in terms of the Rydberg function, E* = —(1 + a*)exp(—a*) for the interaction energy versus distance dependence of metallic and covalently bound systems, including bulk crystals, parallel surfaces, adatoms diatomic molecules. In this expression, E* = Ei/Ef,., a* = {z — ^e)/A, and A was taken proportional to the Thomas-Fermi screening length Xth or a fitting parameter either.
The short-range force on an individual atom j of the tip can be calculated from Fsj{r) = — V ,£'i(r). The perpendicular component Es^x{z) becomes increasingly attractive with decreasing separation, passes through a minimum, then decreases and becomes increasingly repulsive in the case of metals. There are weaker but significant lateral forces, smaller by one order of magnitude than the perpendicular forces as the vector contributions from all neighboring sample atoms tend to add up in F j,i but cancel out in
The tip and sample atoms at small separation (|r| < lOA) may have short range forces but the rest of the atoms further away have attraction due to VdW interaction. The interaction law —Cnr“ ” describes the VdW interaction energy at a distance r between the two atoms (n = 6)^® , between an atom and polarizable flat surface (n = 3)^® , or between two such surfaces {n = 2).^^^ The laws in the
Chapter 1. INTRODUCTION
11
last two cases hold for the distances which are sufficiently large. In this case, details of the atomic structure are not important and a continuum description based on integration can be applied. Cn depends on the materials of the tip and sample and can differ significantly as the polarizability of a metallic tip and sample is larger than the sum of the atomic polarizabilities.^'' A generalized Lifshitz approach^■■■^·■'‘ can be applied to metal electrodes. It is expected to be valid at separations where the wave-function overlap and the exchange effects become negligible and remaining electron correlation effects require a non-local description. The forces in STM will be discussed in the next chapters in detail.
1.3
Physisorption and Chemisorption
1.3.1
Physisorption
If there is an attraction between a surface and an foreign atom or a molecule, it is called adsorption. It has the same basic forces that are known from the quantum of chemical bonding but now, one partner is a macroscopic medium with infinite number of electrons. Physisorption is the weakest form of adsorption where the contribution of the chemical bonding is marginal since the atom is hardly perturbed for adhesion. The origin of this bonding is the van der Waals interaction . The attraction here is due to the interaction of the polarizable solid with dipolar quantum mechanical fluctuations of the atomic charge distribution or in a simple way, the atomic electrons are attracted to their images in the solid.
A simple oscillator model of a physisorbed atom consisting of a positive ion and a valence electron is sufficient to understand the van der Waals interaction here.^° The atom is located outside the surface at a distance ^ and r is the projection of the electron’s orbital motion along the normal to the surface. The total electrostatic energy is
r u ) = i e
+ +
Chapter 1. INTRODUCTION 12
Expanding equation 1.4 in powers of r /2, m = - 0
1 e^r2„2 3
--- 7’ +
8 ^3 16 2“ (1.5)
The first (leading) term in equation 1.2 is proportional to the square of the oscillator and lowers the frequency of the atomic oscillator by an amount inversely proportional to the cube of the atom-surface separation. Usually one has:
(
1
.
6
)
The constant of proportionality Cy depends on the ability of the adsorbate and the substrate to polarize one another. The second term in equation 1.2 becomes important when the atoms is brought near to the surface. The ground state wave function ¡po changes in first order to Pq in the perturbation theory and, (‘^ol^V^o) ^ 0 even though = 0· The substrate induces a permanent dipole moment which increases as the atom approaches to the surface. There is a first-order correction to the interaction energy^^ and this correction defines the reference plane (the image plane) from which the van der Waals interaction should be measured.U (.) = - . Cv
(1.7)
¡z - zyj
The electrons in the low density spill-out tail of the surface charge distribution begin to feel the presence of a nearby closed shell atom at short distances. Then the potential energy of the Bloch electrons is lowered by interaction with the atomic nuclear potential and the kinetic energy of these electrons is raised as their wavefunctions are orthogonalized to the atomic valence electron wave functions. At sufficiently short distances, repulsion wins. The total interaction energy is given in reference 30 as
Cy V(z) = Kn{r^
-z - -zy\ (
1
.8
) K is a constant and is the ground state charge density of the surface. n{r^ decays exponentially into the vacuum so that physisorption potential hasChapter 1. INTRODUCTION
13
a shallow minimum a few angstroms from the surface. At small separations, the first term of this equation can not give the repulsion correctly. This repulsion term must be an increasing function of separation due to core-core overlap and infinite at zero separation, but n (f) is constant in the metal.
Although physisorption is described in terms of the van der Waals mechanism, Lang^^ demonstrated that the density functional formalism with local-density approximation for exchange-correlation described a variety of experimental measurements in such systems successfully. In this formalism with local- density approximation, the electron and its exchange-correlation hole are always attached. It differs from VdVV mechanism in the degree of attachment. Lang proposed that, for equilibrium rare-gas-metal distances, the most important part of the valence-shell electron orbit (nearest to the metal) lies sufficiently within the surface electron geis so it is the most correct to consider the electron to be attached to the hole. An electron in the valence shell prefers to be on the metal side of the adatom rather then the vacuum side. In the VdW regime also, an electron prefers to be at the metal side to be closer to its own image. Thus a permanent dipole moment occurs in both cases, but the local-density approximation lacks the nonlocality included in the image interaction. Lang’s calculations and charge density contour plots for Ar on r, = 3 substrate (|7rrf = p~^) and Xe on = 2 substrate show dipole moments in a direction, to decrease the substrate work function as experimentally predicted. The contour plots also show a resemblance to covalent bonding.
1.3.2
Chemisorption
Chemisorption is the chemical binding of an atom or a molecule to a solid surface. The binding energy is in the range of ~ 1 — 2 eV and is higher than the binding energy encountered in physisorption. Adsorbates usually include alkali metals, alkaline earths, and other metals, hydrogen, nitrogen, small inorganic molecules (CO, NO) and organics. The main adsorbents are the transition and noble metals and their compound, and diamond like semiconductors. Considering the single
Chapter 1. INTRODUCTION
14
atom chemisorption, there are three classes of theories.^^ The first class include simplified LCAO (linear combination of atomic orbitals) and Anderson model theories. The second class comprises first-principles self-consistent calculations. The third class consists of simplified theories based on electron correlation. The first class is dealt with throughout this subsection.
The tight-binding formulation of the chemisorption problem could contain an approximately orthonormal basis set consisting of the atomic orbitals |?, a) belonging to the substrate atoms "i" and suitable atomic orbitals |a,^) of the adsorbate atom ” a” . The Anderson Hamiltonian^^ approach is used for the chemisorption p r o b le m .T h e Anderson Hamiltonian is:
HA = e l Z ^a<7 ^ ^ “1“ ^ ^ “1“ UTl, (T k,<7 ky(T
aa'^a — a (1.9) and Ca(7 are the Fermion creation operators for the electrons of spin a in orbitals |a) and \k) respectively. |A:) is the solid eigenstate and k is not a Bloch wavevector but an arbitrary notation. Ua^ and njto^ are the number operators. The last term represents the Coulomb repulsion. This repulsion acts only between the electrons with opposite spin in |a). In the Hatree-Fock approximation, equation 1.9 is replaced by a one-electron Fock Hamiltonian
H — (-a^^aa T ^ ^k^k<j T ^ ^ -f· h.Cj
k k
Eigenvectors \tp) and eigenvalues are introduced H\ip) = t^\^) and |n) are expanded in terms of |a) and \k).
W) = +
k
The density of states localized in the adatom orbital is />.(«) = e»)
( 1.10)
( 1.11)
( 1.12)
Chapter 1. INTRODUCTION
15
which can be formulated as^
with
and
p,{e) = tr ‘ A /((e - e. - A)^ + A ’
A(£) = , r ^ | l / t p 5 ( £ - e 0 k A(e) = p (1.14) (1.15) (1.16) k P is the Cauchy Principle Value.
The function pa{f) is reminiscent of a Lorentzian function and when the energy dependence of A and A is neglected, it becomes exactly a Lorentzian function with a single peak of width ~ 2A, centered at the energy e = A. This limiting case of the Anderson model is called aa virtual state by Newns and Muscat.^^ In this case, the adatom energy level is shifted by A, subject to a lifetime broadening A , but still remains its identity.
In the next chapter, we study the controlled lateral motion of Xe on the N i(llO ) and P t ( l l l ) surfaces by using molecular statics and dynamics methods. In chapter 3 we study the controlled and reversible transfer atoms between the metal surface and tip by the transfer of Xe between two flat P t ( l l l ) surfaces. We consider various mechanisms contributing to the transfer of Xe. Finally, in chapter 4 we summarize our conclusions.
Chapter 2
CONTROLLED LATERAL
M O T IO N OF Xe
Eigler and Schweizer demonstrated that individual atoms which are physisorbed on metal surfaces can be controlled and relocated by using a Scanning Tunneling Microscope. They transfered Xe atoms physisorbed on Ni(llO) surface to desired positions by a W ( l l l ) tip. Their experiment showed that manipulation of surfaces, clusters and molecules by controlling atoms one by oire is not a dream any more. However, there are still many things we do not know about controlled motion of atoms. The effect of tip induced modifications, the role of structural and material parameters are crucial and require further investigation. This chapter presents the theoretical study for the lateral translation of Xe on metal surfaces. In the first section, controlled lateral motion of Xe atom on Ni(llO) is studied using molecular statics and dynamics methods. The interaction between atoms are represented by a Lennard-Jones type two-body empirical potential. The objective here is not performing the simulation of Eigler’s experiment but having a further understanding of the phenomena. In the second section controlled lateral motion of Xe on P t ( l l l ) is studied. The interaction between Xe and the P t ( l l l ) surface is represented by a more elaborate empirical potential.
Chapter 2. CONTROLLED LATERAL MOTION OF Xe
17
2.1
Xe Motion on the N i(llO ) Surface
2.1.1
Interaction Potential and Atomic Model
The interaction between the adatom and the metal surface has three components at very low temperatures. These are (i) chemical interaction due to charge rearrangement; (ii) the repulsive interaction due to the Pauli E.xclusion Principle; (Hi) the weak Van der Waals interaction. For noble gas atoms like Ar or Xe, the charge rearrangement is small so the chemical interaction is weak. The repulsion interaction becomes significant when the atom is closer to the surface then the equilibrium distance do- The interaction energy is in the range of 150 — 400 meV. Ciraci et al. calculated the binding energy of the Xe adsorbed on the Al(lOO) surface and had ~ 130 meV by the self -consistent psuedopotential calculation method.^® This binding energy includes repulsive and chemical interaction with the exchange correlation energy obtained in the local density approximation. While the experimental binding energy^® is approximately 200 meV, the LDA binding energy is well comparable to the Van der Walls binding energy. It is hence concluded that the charge rearrangement in many physical phenomena has to be considered.
In condensed matter systems we usually have many degrees of freedom, fo r interactions in many-body systems, it is useful for one to integrate out a number of degrees of freedom to obtain effective interactions which are still at microscopic scale and show the basic physics. These effective interactions are usually obtained by a low-order expansion in powers of one or more bare interactions.^^ For the total configurational energy of a condensed matter system, the simplest type of description is
1 ^ 1 ^ ^
(
2
.
1
)
^ S '" s i « " «1. « * ) +2
! ^ i,J,kwhere Ec is the configurational energy of the solid and 14 are the interatomic potential functions of n''“ degree.
The interaction between the Xe atom and the metal surface is represented by empirical two-body interaction potential to perform molecular statics and
Chapter 2. CONTROLLED LATERAL MOTION OF Xe
18
Interaction e(eV) Го(А) Сь С Xe-Ni 0.218 3.27 0.15658 X e-W 0.339 3.62 0.14829 Ni-Ni 2.07 2.56 0.128034 VV-W 5.00 2.82 0.112344 N i-W 0.38584 2.69 1.000000T a b le 2.1: Energy parameters for two body Lennard-Jones potential
dynamics calculations. This two-body interaction potential between an electrode atom i (i = t tip; i = s substrate) and the adatom a is Lennard-Jones type.
12 y \ 61
^ I Ir - R,\ I
t/.a(|r - / ? , ! ) = 6 Rl\ (2.2) For the controlled lateral translation of the adatom, the total potential energy
IS
U{r, . . . , R l , . . . f m ) = C ' £ t/,a(|r - Д I) + C J 2 f^l) +
I rn
Cb E - ^^-1) + E - fm\) + Cb'^UstilRl - fn\) (2.3)
l>m n>m l^n
R\ and Tm are the position vectors of metal surface and tip respectively. The constants C and Сь are the scaling factors to take into account the many-body effects for surface [Via) and bulk (i/,·,) pair potentials. The interaction energy is equal to the experimentally measured heat of adsorption of the adatom. The heat of adsorption of Xe atom and its height on various surfaces have been determined experimentally.^®’^® The pair potential parameters t and of Via are determined by fitting the calculated heat of adsorption and the optimum height of Xe on the corresponding surface . The pair potential parameters for Ni-Ni, W -W and X e-X e are available in the literature.'*®’'*’ The parameters used in the calculations are given in table 2.1.
A better interpretation of the interaction between Xe and the electrodes may include additional term beyond the central force term. Short-range (chemical)
Chapter 2. CONTROLLED LATERAL MOTION OF Xe
19
interaction can be better presented by an exponential term. Especially, the effective potentials having minimum energy on top side include non-central terms. The potential described by equation 2..3 has been used in the calculation because of limited number of experimental data available to fit the parameters therein. For the calculations with the rigid tip and sample, the positions of electrode atoms R¡ and Tm are kept fixed in their ideal bulk positions and the terms Ugs and Uu in equation 2.3 are omitted. The substrate is represented by 12716 Ni atoms in 34 layers. Each layer contains 374 atoms (2 2 x 17). The tip is constructed by 2027 W atoms in pyramidal geometry generated from W ( l l l ) surface containing 22 layers. In the calculations with relaxed electrodes, we used relatively smaller electrodes comprising number of atoms treated with the periodic boundary condition. The substrate has 3750 Ni atoms in 10 layers each containing 375 atoms (25 x 15). In figure 2.1 the model is shown schematicaly. The first five layer of the tip and the first two layer of the sample is shown in the upper scheme with the xenon as a dark filled circle. In the lower scheme xenon on the sample at the minimum energy position is shown with the lattice vectors and the corresponding directions.
( [lío]
is chosen as the x direction and [1 0 0] is chosen as the y direction.)2.1.2
Molecular Statics
Having decided the effective pair potential, we next analyze the energy variation of the Xe atom on the bare sample surface due to its location, and we search surface for the energy topography. This analysis is performed by calculating the potential energy surface. All the atoms of the sample are kept fixed at their ideal positions and the surface is turned into a 2D grid. U{f) is minimized by varying the height of the xenon atom at each grid point (x^y) on the surface. Figure 2.2(a) is the calculated potential energy surface and it indicates that Xe is physisorbed at the hollow (H) site of the ideal Ni(llO) surface. The energy barrier Q i across the long bridge site (L) is lower than that Qs across the short bridge site. The energetics obtained are outlined in 2.2. Binding site of the Xe atom is still controversial. The present and earlier calculations calculations agree
Chapter 2. CONTROLLED LATERAL MOTION OF Xe 20
a = 2.49 A
b = 3.52 A x-(110|
F igu re 2.1: Schematic representation of the model
In the upper scheme, the first five layer of the tip and the first two layer of the sample is shown with the xenon as a dark filled circle. In the lower scheme xenon on the sample at the minimum energy position is shown with the lattice vectors and the corresponding directions.
on the H-site“*^ but the top site has also been proposed.'*^’'*'* In figure 2.2(b) the energy of the Xe atom on the bare W ( l l l ) tip is shown. The energy is highest when Xe lies above the a,pex atom but become lowest at the three hollow site between the apex and the second layer atoms. The binding site is the hollow site corresponding to the center of the triangle between the apex and second layer atoms. In figure 2.2(c) the total potential energy of Xe on the Ni(llO) surface
o
with a W ( l l l ) tip lying 5.0A above the surface is shown. The apex of the tip is above the hollow site of the surface so the variation of the Xe energy on the bare surface reflects itself as having two peaks. A single peak occurs when the tip apex is above the top site of the surface.
Chapter 2. CONTROLLED LATERAL MOTION OF X e 21
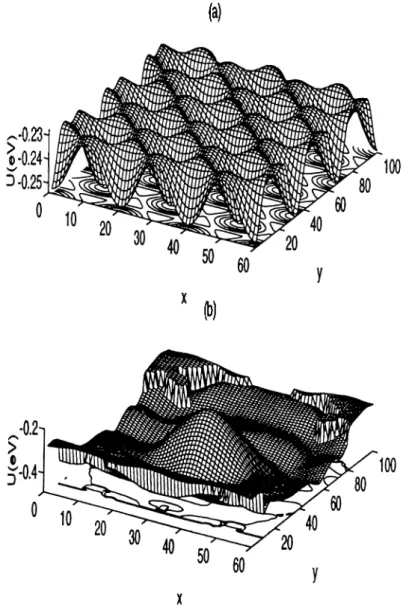
F ig u re 2.2: Potential energy surfaces
(a) The potential energy of Xe on the Ni(llO) surface (b) Same for Xe on the W ( l l l ) tip (c) The total potential energy of Xe on the Ni(llO) surface with a W ( l l l ) tip lying 5.0^ above the surface. The plot covers (3 x 3) cell of the Ni(llO) surface.
Binding Energy Eb (meV) Barrier Energy Q (meV)
H-site 280 T-site 151 L-site 234 S-site 178 1 0 2 46 H-^T-^H 129
T able 2.2: Energetics of Xe on the N i(llO ) surface
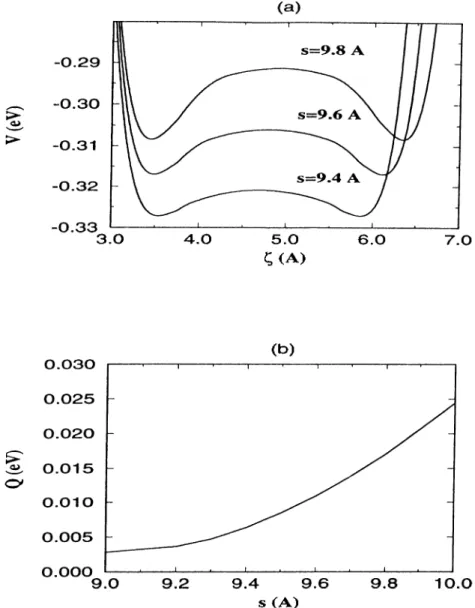
The magnitude and the position of the energy minimum vary with the changes of the tip position. In figure 2.3, the variation of the minimum potential energy D and corresponding height h of Xe for different positions of the tip is shown. The height of the tip apex is kept fixed 5.0A and 5.4A above the N i(llO ) surface and Xe position is varied on the [100] line bisecting the unit cell at each scheme. The calculations are repeated for different tip positions on the [100] line. The minima of the potential energy curves are the possible position of the Xe atom as it is pulled or pushed by the W ( l l l ) tip. Changes in magnitude and position of this minima can be seen, and these changes may give the picture of how Xe is changing its position. The height h versus the coordinate k o f the Xe atom indicates that, in some cases, the potential energy is lowered if Xe is attached to the tip.
Chapter 2. CONTROLLED LATERAL MOTION OF Xe 22
F igu re 2.3: Variation of minimum energy U and height h of Xe
Variation of minimum energy U and height h of Xe for different position of the tip on the Ni(llO) surface. The tip moves 5.A above the Ni(llO) atomic plane on the [100] line bisecting the unit cell. The position of the tip in each panel is marked by a dot.
2.1.3
Controlled Lateral Translation: Dynamics
Understanding the dynamical behavior o f the Xe needs further analysis than calculating the potential energy surfaces and searching the minima. Does the Xe atom always go to the nearest local minima or have a more complex behavior due to its kinetic energy ? , To answer this question for the carriage of Xe on the N i(llO ) surface, the method of molecular dynamics computer simulation is applied. Computer simulation is a test o f theories by performing experiments not in the real manner but in computer media. Molecular Dynamics (M D) is the term used to describe the solution of the classical equations of motion (Newton’s equations ) for a set of molecules.“*®
In MD simulations, the time increments must be small in order to capture adiabaticity. For the lateral translation of X e the time steps are 8t = 1.0 x 10“ *^ —
Chapter 2. CONTROLLED LATERAL MOTION OF Xe
23
1.0 X The tip is moved with a constant speed Vt = 5.28 x in [100] {y) direction and Vt - 3.74 x 10^°A/s in [110] (a;) direction. Apparently, this speed is much larger then the speed in the experiment (4 A /s) but it is affordable only with the available computer capacity. Nevertheless, Vt is much smaller than the sound velocity in the metals so phonon propagation is much faster. Initially the Xe is placed at the hollow site on the surface; the tip initially behind the Xe atom is moved along a line passing on the Xe atom at a constant height. Figure
2.4(a) represents the results related to the motion along the [1 0 0] direction (or y direction). The Xe atom is practically not affected by the tip for heights hf > 5.6A above the Ni(llO) atomic plane. (The height of Xe at equilibrium is 2.3Á ) On the other hand, the Xe atom is attached to the tip at ht = 5.4 — 5.5Á. This is specified as the contamination of the tip by Xe. For ht < 5 AÁ, Xe moves behind the tip and experiences periodic jumps across the long bridge. This corresponds to the pulling mode of the lateral translation. It is interesting to note that for ht < 4.SÁ the Xe atom is attracted so much that the atom first jumps backwards then follows the tip. The contamination and pulling mode of lateral translation are clearly shown in figure 2.4(b) which shows the real space trajectory of Xe in y — z plane, (k — C respectively)
Lateral translation of Xe induced by the motion of the tip along the [110] direction is also studied. The motion occurs in a line across the short bridge. Two different modes are found in the motion along this direction. Pulling and pushing modes depend on the tip height. As it can be seen in figure 2.5(a); the Xe atom is pulled by the tip at 5.8 > ht > 5AÁ and pushed at ht < 5.3A. The coordinate of the Xe atom along x direction is denoted by Eigler obtained a threshold height for the motion parallel to the rows of the atoms on the N i(llO ) surface ([1 1 0] direction) and a lower threshold height for the motion perpendicular to the rows of the atoms ([1 0 0] direction). Here the threshold height for the [1 1 0] direction is
5.8A
and for the [1 0 0] direction is 5.4A which are consistent with the experiment. If the tip moves along the body-diagonal of the surface unit cell (or [1 1 2] direction) the Xe atom performs zig-zag motion as seen in figure 2.5(b). The jump along the [1 0 0] direction is followed by the jump along the [1Í0] directionChapter 2. CONTROLLED LATERAL MOTION OF X e
24
ic(A)
F igu re 2.4: Lateral translation o f Xe along the [100] direction
(a)..Lateral translation of the Xe atom induced by the moving tip along the [100] direction with different tip heights above the Ni(llO) surface, y and « are the coordinates of the tip and Xe along the [100] direction, respectively, (b) The variation o f height C of the Xe atom during latercd translation along the [100] direction.
thus zig-zags of /c(^) are quite sharp. However, for small height
{ht
= 5.A) the
zig-zags are not sharp owing to the increcised tip-adatom interaction.
25
(b)
F ig u re 2.5: Lateral translation of Xe along [110] direction and [112] direction (a). Lateral translation of the Xe atom induced by the moving tip along the [110] direction with different tip heights above the N¡(110) surface, (b) Lateral translation of Xe along the [112] direction
height ht = 5.A. First two panels show the variation o f Xe ac, C coordinates with
tip’s y coordinate. Third panel shows the forces due to tip and sample on Xe in y direction. Forth panel shows the forces on Xe in 2: direction; and fifth one is the panel which shows the total force on Xe along y direction. Last panel is the
Chapter 2. CONTROLLED LATERAL MOTION OF Xe 26
10.0
< 5·' 0. 3.0 ^ 2.5 <^
2.0
0.2
< 0.0 > LL·“ -0.2 < > 11 0.5 0.0 -0.5 0.05 ^ 0.00 >2. Li^ -0.05 > CD -0.20 -0.25 -0.30 -5.0 0.0 5.010.0
y(A)
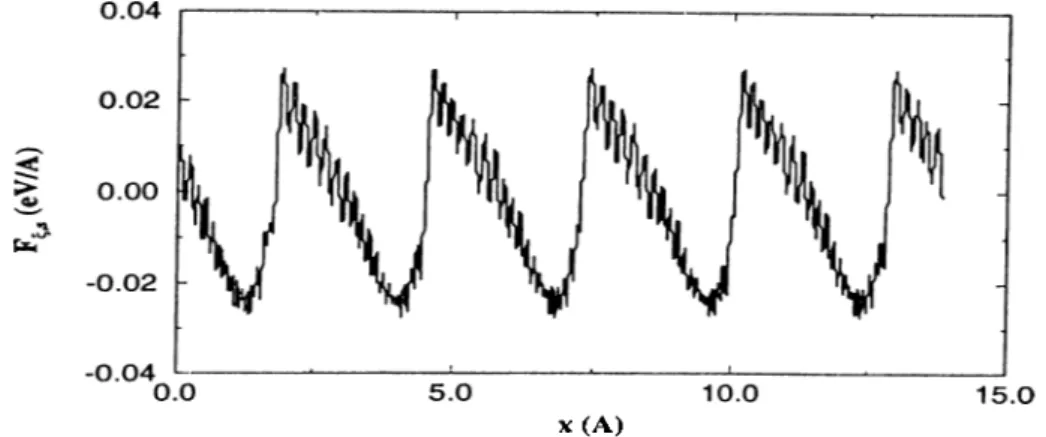
F ig u re 2.6: Forces on the Xe atom for lit = 5.A
Variation of lateral coordinate k and height C of Xe, components of forces on the Xe atom exerted by the sample and the tip, variation of potential with the y-coordinate of the tip moving at constant height ht = 5.A
plot for the potential. For all panels, horizontal axis shows the tip coordinate in y direction. The tip force is first attractive then follows the sequence repulsive- repulsive-attractive. The sample force is always in the reverse direction of the tip force.
Chapter 2. CONTROLLED LATERAL MOTION OF Xe
27
F ig u re 2.7: Lateral translation o f Xe in the case of relaxed electrodes Displacement of k o f Xe versus displacement of y of the tip along the [100] direction bisecting the surface unit cell. Circles and stars corresponds to the rigid and relaxed electrodes, respectively.
The relaxation o f electrodes becomes important for small ht where the force Ft,s on Xe is exerted by a small number o f atoms of the sample and of the close proximity of the tip. In this case, the values of Ql and Qs are modified. The relaxation is considered by including all the terms in equation 2.3 and by allowing all the atoms at the close proximity o f the tip to move under the action of the force by the rest o f the system. In our calculation, first two layers o f the sample (2 X 375 = 750) atoms and first five layers of the tip (35) atoms are allowed to move together with Xe. The parameters of the empirical potential ior t — t and s — s interactions are obtained from the experimental data, whereas the parameters related with t — s interaction are determined by averaging those of bulk Ni and W. As the tip and the sample atoms start to move around their equilibrium positions, the fluctuations on the value of the force acting on Xe are changed. These changes may cause important differences on the translation of Xe with rigid electrodes. Figure 2.8 shows the important effect of the electrode relaxation . At the end o f each step displacing the tip by 0.88A, the molecular dynamics calculation are carried out taking initial conditions as the resulting
Chapter 2. CONTROLLED LATERAL MOTION OF Xe 28
conditions of the previous step. While the Xe atom is only pulled by the rigid tip at ht = 5.0A, in the case of relaxed electrodes, the motion proceeds in the pushing mode. Another important effect of relaxation is that in certain conditions the X c atom starts to escape sideways. The sideways motion was absent in the case of rigid electrodes since the resultant lateral force perpendicular to the direction of motion has vanished.
2.2
Xe Motion on the P t ( l l l ) Surface
2.2.1
Interaction Potential and Atomic Model
As in the previous case, the interaction energy between Xe and the P t ( l l l ) surface is composed from: 1) Short-range attractive interaction due to the chemical bond between Xe and the P t ( l l l ) surface. (This interaction includes electrostatic, exchange and correlation energies.) 2) Short-range repulsive energy 3) Long- range Van der Waals energy. For closed-shell atoms, such as Ar and Xe, the charge rearrangement upon physisorption on metal surface was thought to be negligible. Reviewing the experimental information available from work function measurements and electron spectroscopies concerning the adsorption of rare gases on metal surfaces, Ishi and Viswanathan concluded that chemical bonding effects play a significant role in Xe adsorption.'*^ Barker and Rettner determined an empirical potential energy function for the interaction of xenon with the P t ( l l l ) surface“*^ This function describes a wide range of dynamical and equilibrium experimental data including scattering measurements, with detailed angular distributions and energy transfer data. They also used thermal desorption rates and trapping probabilities, as well as thermodynamic properties of monolayer phases. The potential also agrees with an experimental value for the frequency of vibration normal to the surface, and has the correct asymptotic behaviour at large distances from the surface. {V = —cz/z^^ with an experimental estimation of C3) The equilibrium position for a single Xe atom lies directly above the surface platinum atom of a height of 3.35A.
Chapter 2. CONTROLLED LATERAL MOTION OF X e
29
Barker and Rettner represent the interaction between a single Xe atom and the solid by a sum of nonspherical pairwise additive potentials, together with an additional term V which depends only on the normal distance 2“" of the xenon atom from the local surface and describes the interaction with the delocalized conduction electrons. They modeled the nonspherical pair potential by a spherical part centered on the Pt atom, a function of the distance Rgi between the Xe atom and the ¿th Pt atom, and a part centered a distance h above the Pt atom, a function of Rg·, where (2.4) (2.5)
(2.6)
(2.7) (2
.8
) (2.9)(
2
.
10
)
G{R) = exp[-{R i/ R - i f ] , R < Ri (2.11) They found an optimized on-top potential (potential with minima over the on-top site) which gave a very good description of the whole body of data. The parameters for this potential are given at table 2..3.R'g, = {xg - Xif + ivg - Vif
+{zg - Zi
-h f
The total energy of the xenon on P t ( l l l ) surface is given by
V = Y.[u(R,i)
+
v(%,)] + V(z‘/ )
i
The spherical function u{R) has the form
u{R) = A2exp{—a2R) They define a function F by
F{C, y ,E -,z )= ECexpi ~Tz)/[E + C e z p ( - j z ) ¡ V and V are given in terms of this function.
v(R') = F{A, a, IF; R') - c&G{R!)IR!^ V{z) = F {A u a ,,W p ,z )
where the damping function is defined by
G{R) = 1, R > R i and
Chapter 2. CONTROLLED LATERAL MOTION OE Xe
30
Wi 3.196 X 10'· eV 4.25 A - 1 1.0 eV «2 5.926 X 10® eV 9.00 A- 1 0 .2 2 A- 2 CeRi
82.72 ev A^ 1.83 A 6.8247 A T a b le 2.3: Parameters for On-Top potentialThe interaction potential between xenon and the atoms of the W tip is taken from earlier calculation and is expressed in terms of a pair potential of Lennard Jones type. The parameters e and Tq are the same with the parameters in
subsection 2.1.1 . The sample is represented by 14112 Pt atoms in 42 layers. Each layer contains 336 atoms (21 x 16). The atomic structure of the tip is the same as the tip generated from W ( l l l ) surface in the previous section. It is constructed by 2024 W atoms in pyramidal geometry containing 22 layers. There is a single atom at the apex of the tip and second layer has three atoms.
2.2.2
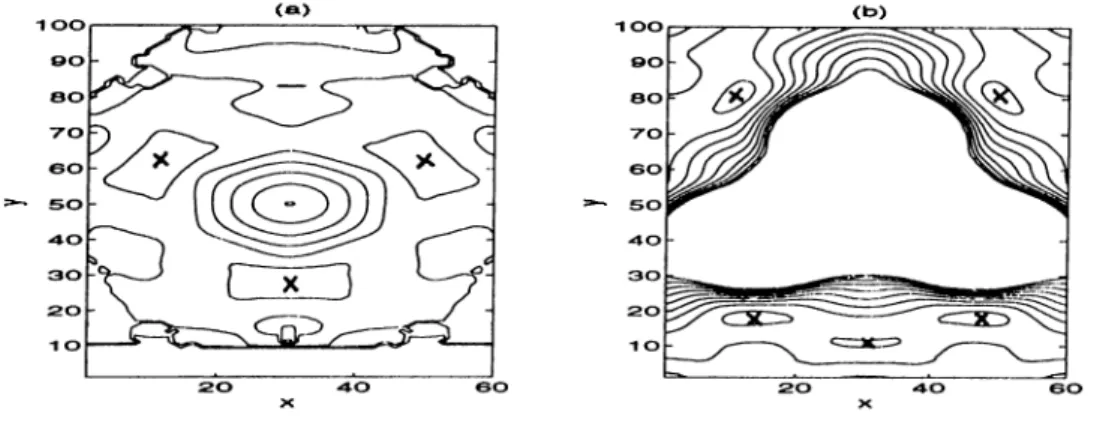
Potential Energy Surfaces
In order to analyze the motion on Xe, we first obtain the potential energy surface which is the surface topography for the energy of the Xe atom. Like Xe on the Ni(llO) surface in the previous section, a 2D grid of the P t ( l l l ) surface is formed. U{r) is minimized at each grid point (<f,« on the surface by varying the height C of the Xe atom. Figure 2.9(a) shows the potential energy surface for Xe on bare P t ( l l l ) surface. The lowest value of potential energy is —0.2-540 eV and occured at the top sites. Thus, the calculated equilibrium position of xenon atoms physisorbed on the P t ( l l l ) surface is located on top of the platinum atoms. The energetics of Xe on the P t ( l l l ) surface are given in table 2.4. The equilibrium site for rare gas atoms physisorbed on metal surfaces were usually predicted as the hollow site; the top found in this case seems to be at variance with earlier findings. The d-band electrons in transition metals is pointed out to give rise to a different adsorption site.'*^ Miiller has performed a local density functional calculation of the interaction energy of Xe with a rigid Pt cluster representing