Edge Labeling in the Graph Layout Toolkit
U˘gur Do˘grus¨oz1,2, Konstantinos G. Kakoulis1,3, Brendan Madden1, andIoannis G. Tollis3
1 Tom Sawyer Software, 804 Hearst Avenue Berkeley, CA 94710
{ugur,kostas,bmadden}@tomsawyer.com
2 Dept. of Computer Engineering and Information Science Bilkent University, Ankara 06533, Turkey
3 Dept. of Computer Science, University of Texas at Dallas Richardson, TX 75083-0688
{kostant,tollis}@utdallas.edu
Abstract. The Graph Layout Toolkit is a family of portable graph
draw-ing and layout libraries designed for integration into graphical user inter-face application programs. When visualizing graphs, it becomes essential to communicate the meaning of each graphical feature via text labels. We present the interface and the basic engine of the Graph Layout Toolkit that produce a high quality automated placement of labels for edges of a graph.
1
Introduction
Graph layout is the automatic positioning of the nodes and edges of a graph in order to produce an aesthetically pleasing drawing that is easy to compre-hend. Graph drawings can be used to display complex information that can be modeled as objects and connections between the objects. In many diagramming applications, it is essential that a drawing be labeled. Labels assist in conveying information or clarifying the meaning of complex structures. The problem of positioning labels corresponding to graphical objects of drawings is called
auto-matic label placement. This is very important for visualization tools in numerous
areas such as project management, software development, database design, and network management. We present our approach to the above problem as imple-mented in the Graph Layout Toolkit.
Many graph layout and editing systems have been developed in the past. Please refer to [1] for an overview of such systems. One essential aspect that has not been addressed in any previous system, is the capability to support the automatic placement of labels related to the edges of a drawing.
The Graph Layout Toolkit (GLT) [5,6] is a family of graph layout libraries that facilitate easy integration with graphical user interface programs for the
?Research supported in part by NIST, Advanced Technology Program grant number
70NANB5H1162. A patent for these and related results is pending.
S.H. Whitesides (Ed.): GD’98, LNCS 1547, pp. 356–363, 1998. c
development of applications that require diagramming visual interfaces. Graph layout comes in different styles, each having particular features and benefits suited for different industries and applications. The GLT offers four different layout libraries: Circular , Hierarchical , Orthogonal , and Symmetric.
Just as graph layout is a time consuming and monotonous task, so is the positioning of labels. The automatic placement of edge labels falls into the class of NP-Hard problems [2]. Recent advances offer efficient solutions to the problem. Each library in the GLT is equipped with fast algorithms for the automatic placement of edge labels which are based on [3]. In this paper we present some of the challenges of incorporating a labeling interface into a graph layout system, and the way we chose to resolve these in the framework of the Graph Layout Toolkit.
2
Objectives
The labeling of edges is aimed at communicating edge attributes in the most convenient way. This is only possible when labels are positioned in the most appropriate places.
Good label placement aids in conveying the information that labels represent and enhances the aesthetics of the drawing. It is difficult to quantify all the char-acteristics of a good label placement since they reflect human visual perception, intuition, tradition and/or experience. However, one can follow some basic rules:
Elimination of ambiguity: A label which is associated with exactly one
edge, must not overlap any other edge or any node. Otherwise it is not clear which object the label describes.
Clarity: Relationships between labels and edges should be easily identified
without cluttering the drawing. Thus, labels are positioned close to, but not overlapping edges if possible.
Flexibility: Placement constraints on the labels should be allowed. For
in-stance, in some applications it is required that a label is associated with one of the endpoints, or the middle, of an edge.
It is important to emphasize here that the user must be able to customize the rules of label placement quality to meet specific needs. For example, the user must be able to specify that the preferred position for an edge label is closer to the source or target node of the associated edge. Building a tool that supports automatic labeling presents two main challenges:
– Devise efficient algorithms that produce high quality label placement
com-pared with manual placement.
– Build a labeling interface that is flexible enough to accommodate the specific
requests for good placement for a variety of applications.
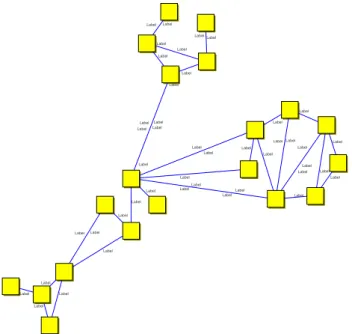
The next section details the framework and the interface built to integrate the la-beling algorithm into the GLT. After that, the lala-beling algorithms are described. Figure 1 shows an example of GLT’s edge labeling facility.
Label Label Label Label Label Label Label Label Label Label Label Label Label Label Label Label Label Label
Label Label Label
Label Label Label Label Label Label Label Label Label Label Label Label Label Label Label Label Label Label Label Label Label Label Label
Fig. 1. Sample drawing with edge labels produced by the GLT.
3
Interface
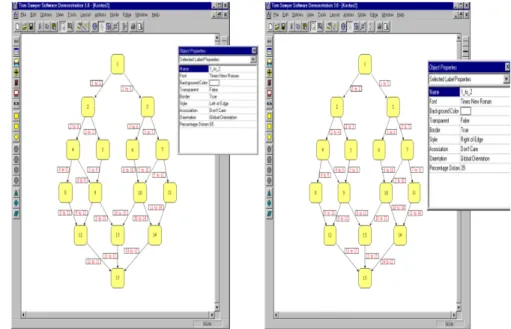
Each edge label is represented by a rectangle in the GLT. A label’s position, where its reference point should be placed, is determined by a percentage distance from the source of its owner edge and an offset from this point on the edge. These two values are kept constant over changes of the interactive routing of the edge unless the user explicitly changes either of these values (see Figure 2). When a label is repositioned interactively (e.g., dragged with the mouse) these two values are recomputed based on the point on the owner edge that is closest to the label’s new position.
The automatic label placement can be performed either during layout or independently, on the current drawing of a graph. In the latter case, the posi-tions of other graph objects are preserved while labels are repositioned by the algorithm.
GLT’s tailoring options for labeling are quite flexible and allow the users to customize the system to their specific needs. A user can specify the preferred position to place a label with respect to the associated edge by specifying a distinct style, association, and orientation as defined below:
Style: The style of a label specifies whether the label should be placed above
or below, for horizontal edges, or to the left or right, for non-horizontal edges. Figure 3 shows examples.
Source Target label A label B label C Source Target label A label B label C
Fig. 2. Notice how the relative positions of labels with respect to edges are
preserved as the routing of an edge changes since the percentage distance from source and offset values of the labels are fixed.
Association: The association of a label specifies whether the label should
be placed towards the top, center, or bottom of its owner edge. In other words, it associates the label with the source, center, or target of the edge, respectively. See Figure 4 for an example.
Orientation: The style and association of a label might have different
mean-ings depending upon the orientation chosen. One can use either a global ori-entation of the drawing (based on they-coordinates of the endpoints of the edge), or an edge orientation (based on the direction of each edge).
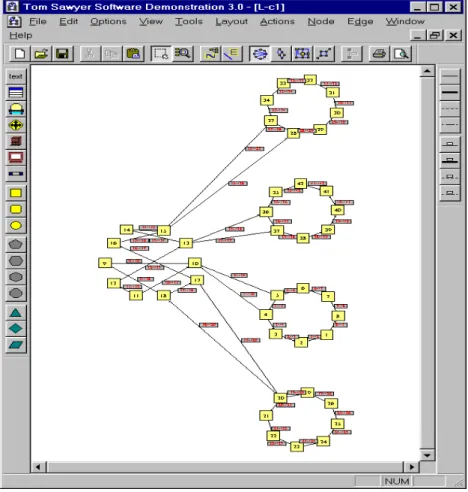
In addition, there are a number of global tailoring options that can be used to fine tune the algorithm. When drawings are very dense or there is a large number of oversized labels, the default label assignment produced by the labeling system might not be satisfactory. In these instances, the user can fine tune the algorithm either by requiring the labeling algorithm to spend more time in the post-processing step as discussed later, or by relaxing the labeling quality constraints by allowing overlaps. For the former case, a label positioning quality parameter ranging from 1 to 10 sets the intensity of the algorithm, which is mostly related to the post-processing step. A higher integer value results in more accurate positioning of labels under certain circumstances but it takes longer to execute. For the latter case, the allowed overlap percentage parameter determines if the labels are allowed to overlap with one another and with other graph objects. When set to 10 percent, for example, each label’s dimensions are treated as if they were 10 percent smaller, which increases the overall success of the algorithm at a cost of up to 10 percent overlap. Figure 5 illustrates this tailoring option with an example.
Fig. 3. Label style can be set such that the label is placed to the left (left) or
right (right) of its owner edge.
4
Algorithms
The algorithms used in the labeling engine of the Graph Layout Toolkit are based on the techniques presented in [3]. First, a number of potential label solutions for each edge is carefully selected. Then, an assignment of labels to available label solutions is performed by solving a variant of the matching problem. Specifically, first, the label positions are grouped such that each label position, that is part of a group, overlaps any other label position that belongs to the same group. This results in mutually disjoint sets of label positions. Next, edges are matched to label positions by allowing at most one label position from each group to be part of a label assignment. Lastly, a post-processing step is performed if necessary. Labels are assigned to edges by locally shifting already assigned labels followed by a limited number of backtracking operations.
The algorithm tries to place labels to respect the tailoring options (preferred position). If it does not succeed, then it tries to find a place that is as close to the preferred position as possible (acceptable position). In the final label assignment produced by the algorithm, each label will not overlap other labels or nodes or edges other than its associated edge.
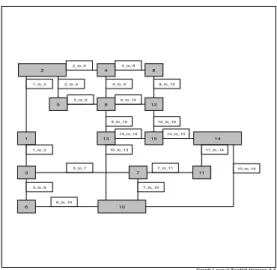
The labeling techniques presented in [3], however, are not suitable for orthog-onal drawings because such drawings have many horizontal edges. To overcome this deficiency the labeling techniques have been extended to broaden the initial set of label positions for horizontal edges. Figure 6 shows an example.
TL TR CL CR BL2 BR2 BL BR TA BB
Fig. 4. An illustration detailing how label association affects its placement.
Fig. 5. A circular drawing where labels are allowed to overlap other graph objects
Graph Layout Toolkit Version 2.4Tom Sawyer Software 2 4 8 5 9 12 1 13 15 14 3 7 11 6 10 2_to_4 4_to_8
1_to_2 2_to_5 4_to_9 8_to_12
5_to_9 9_to_12
9_to_13 12_to_15
13_to_15 14_to_15
1_to_3 10_to_13 11_to_14
3_to_7 7_to_11 10_to_14
3_to_6 7_to_10
6_to_10
Fig. 6. An orthogonal drawing with edge labels which contains many horizontal
edge segments.
The algorithms have further been extended to support placement of more than one label per edge. Multiple labels per edge are needed not only when edges are very long and repetition is necessary, but also when more than one attribute per edge must be displayed (see Figure 7 as an example). An iterative approach has been applied to solve the problem of assigning multiple labels to each edge of a drawing. At each iteration, one label is assigned to each edge of the drawing. Each successive round respects the previously placed labels and reduces the solution space accordingly. For more details of the algorithms, refer to [4].
5
Conclusion
The Graph Layout Toolkit provides generic algorithms for automatic placement of edge labels. The interface to these algorithms comes with per label and per graph tailoring options that not only provide input to the algorithms about spe-cific constraints on the placement of labels, but also to adjust several parameters that let the user fine tune these algorithms.
One natural extension to the Graph Layout Toolkit’s labeling support is integration of algorithms that can handle not only edge labels but also node and even graph labels. Another one of the future research goals on labeling is to design efficient interactive and incremental labeling algorithms for dynamically changing graphs.
Fig. 7. A U.S. map with airline routes where labels are used to convey fare and
distance information.
References
1. G. Di Battista, P. Eades, R. Tamassia, and I. G. Tollis. Algorithms for drawing graphs: an annotated bibliography. Comput. Geom. Theory Appl., 4:235–282, 1994. 2. K. G. Kakoulis and I. G. Tollis. On the Edge Label Placement Problem. In S. North, editor, Graph Drawing (Proc. GD ’96), volume 1190 of Lecture Notes in Computer Science, pages 241–256. Springer-Verlag, 1997.
3. K. G. Kakoulis and I. G. Tollis. An Algorithm for Labeling Edges of Hierarchical Drawings. In G. Di Battista, editor, Graph Drawing (Proc. GD ’97), volume 1353 of Lecture Notes in Computer Science, pages 169–180. Springer-Verlag, 1998. 4. K. G. Kakoulis and I. G. Tollis. On the Multiple Label Placement Problem. To
appear in the Proc. of the 10th Canadian Conference on Computational Geometry, August 1998.
5. Tom Sawyer Software. Graph Layout Toolkit Reference Manual. Berkeley, CA, 1992-1998.
6. Tom Sawyer Software. Graph Layout Toolkit User’s Guide. Berkeley, CA, 1992-1998.