DETERMINANTS OF ENTRY DECISION TO MILITARY HIGH SCHOOLS: A CASE STUDY OF
RECRUITMENT POLICIES
A Thesis Submitted to
THE DEPARTMENT OF MANAGEMENT AND
GRADUATE SCHOOL OF BUSINESS ADMINISTRATION OF
BILKENT UNIVERSITY
In Partial Fulfillment of the Requirements for the Degree of
MASTER OF BUSINESS ADMINISTRATION
BY APAN, HAMIT AUGUST, 2003
I certify that I have read this thesis and that in my opinion it is fully adequate in scope and in quality, as a thesis for the degree of Master of Business Administration.
Prof. Ümit Berkman
I certify that I have read this thesis and that in my opinion it is fully adequate in scope and in quality, as a thesis for the degree of Master of Business Administration.
Assoc. Prof. Doğan Nadi Leblebici
I certify that I have read this thesis and that in my opinion it is fully adequate in scope and in quality, as a thesis for the degree of Master of Business Administration.
Asst. Prof. Levent Akdeniz
Approved for the Graduate School of Business Administration
ACKNOWLEDGMENTS
I would like to thank to Prof. Umit BERKMAN for his invaluable contributions in preparation of this thesis. Also I am grateful to Assoc. Prof. Dogan Nadi LEBLEBICI and Asst. Prof. Levent AKDENIZ for their advices. Finally, I would like to express my special thanks to my family for their support and patience.
ABSTRACT
DETERMINANTS OF ENTRY DECISION TO MILITARY HIGH SCHOOLS: A CASE STUDY OF RECRUITMENT POLICIES
BY
Hamit APAN
MBA THESIS
BILKENT UNIVERSITY - ANKARA
AUGUST, 2003
Supervisor: Prof. Ümit BERKMAN
Towards 21st century, recruitment and selection have become one of the most
important topics in Human Resource Management literature. For that matter, the recruitment of officers in the year 2003 and beyond constitutes one of the main challenges for the Turkish Army (TUAR) as well. Since military high schools are army’s main sources of officers, they have become the main focus of this study. In this study, it is aimed to figure out the likely factors that might have an effect on individuals' minds when deciding on entering a Military High School.
Key words: Recruitment, selection, and propensity
ÖZET
ASKERİ OKULLARDA OKUMAYA KARAR VERME SÜRECİNİN BİLEŞKELERİ
Hamit APAN
İŞLETME YÜKSEK LİSANS TEZİ
BİLKENT ÜNİVERSİTESİ - ANKARA
AĞUSTOS, 2003
Tez Yöneticisi: Prof. Dr. Ümit BERKMAN
21 nci yüzyıla girerken, personel seçimi ve işe alma konuları İnsan Kaynakları Yönetimi alanındaki en önemli konuların başında gelmektedir. Bu anlamda, subay alım işlemleri 2003 yılı ve ötesinde Türk Kara Kuvvetleri için de asıl incelenmesi gereken konulardan olmuştur. Türk Kara Kuvvetlerinin subay teminindeki ana kaynağı askeri liseler olduğu içindir ki, bu çalışmanın konusu olarak bu okullar seçilmiştir. Bu çalışmada, askeri liselere girme kararı aşamasında bireyleri etkileyebilecek muhtemel faktörlerin ortaya çıkarılması amaçlanmıştır.
Anahtar kelimeler: İş başvurusu, seçim, ve eğilim
TABLE OF CONTENTS
ABSTRACT ...i
ÖZET ...ii
TABLE OF CONTENTS ... iii
LIST OF TABLES ...vi
LIST OF FIGURES ...vii
GLOSSARY... viii
INTRODUCTION...1
1.1 SOURCES OF OFFICERS IN THE TURKISH ARMY...1
1.1.1 Current Condition in the Turkish Army ...3
1.2 DECIDING THE DATA COLLECTION TECHNIQUE...3
1.3 DETERMINING SAMPLE SIZE AND IDENTITY...5
1.4 METHOD...6
1.4.1 Instrument ...7
1.4.2 Procedure...8
LITERATURE REVIEW ...9
2.1 RECRUITMENT: ITS IMPORTANCE AND ROLE...9
2.2 DEFINITIONS...10
2.3 WHY IS RECRUITMENT IMPORTANT?...11
2.3.1 Fundamentals of Successful Recruiting ...11
2.3.2 Critical Decisions in Recruitment and Selection...12
WHAT ATTRACTED THE STUDENTS MOST?...16
3.1 DEMOGRAPHIC VARIABLES...16
3.2 HOW WERE THE STUDENTS AWARE OF MILITARY SCHOOLS AND SOLDIERING AS A PROFESSION?...18
3.3 DETERMINANTS OF THE ENTRY DECISION TO MILITARY HIGH SCHOOLS...22
3.3.1 Financial Terms...23
3.3.2 Prestige / Esteem towards army...24
3.3.3 Military Services / benefits ...26
3.3.4 A guaranteed job...31
3.3.5 On-post / on-school facilities...33
3.3.6 Other aspects of a military profession ...37
STUDENTS’ OPINION TOWARDS MILITARY SCHOOLS...42
4.1 IS IT A GOOD SCHOOL TO BELONG TO? ...42
4.2 STUDENTS’ HAPPINESS FOR BEING IN A MILITARY HIGH SCHOOL...45
4.3 STUDENTS’ PRIDE FOR BEING IN A MILITARY HIGH SCHOOL...47
4.4 STUDENTS’ SATISFACTION FOR BEING IN A MILITARY HIGH SCHOOL48 WHO INFLUENCED THE STUDENTS MOST? ...51
5.1 OTHER MILITARY HIGH SCHOOL STUDENTS...52
5.2 PRIMARY SCHOOL TEACHERS / INSTRUCTORS...54
5.3 PARENTS / RELATIVES...56
WHAT MAKES INDIVIDUALS HESITATE ABOUT MILITARY LIFE?...58
6.1 MILITARY DISCIPLINE...58
6.2 OBLIGATORY ROTATION SYSTEM...61
6.3 ENEMY THREATS...62
6.4 15-YEAR COMPULSORY SERVICE...63
CROSS TABLES...66
7.1 CROSS-TABLES RELATED TO “FAMILY INCOME LEVEL”...66
7.2 CROSS-TABLES RELATED TO “HAVING A SOLDIER AMONG FAMILY MEMBERS”...69
CONCLUSION...73
APPENDIX A: SAMPLE QUESTIONNAIRE...77
APPENDIX B: FREQUENCY TABLES AND BAR-GRAPGHS OF TOTAL STUDENTS ...81
APPENDIX C: FREQUENCY TABLES AND BAR-GRAPGHS OF SENIOR CADETS ...98
APPENDIX D: FREQUENCY TABLES AND BAR-GRAPGHS OF FIRST-YEAR CADETS ...115
BIBLIOGRAPHY ...132
-LIST OF TABLES
Table 1: What is Your Average Family Income Level?... 17
Table 2: Are there any other professional soldiers in your family/relatives?... 18
Table 3: I have heard about this school from my family/relatives... 19
Table 4: I have heard about this school from my school mates... 20
Table 5: I have heard about this school from my teachers/instructors.... 20
Table 6: I have heard about this school via magazines/newspapers... 21
Table 7: I have heard about this school via television... 22
Table 8: Descriptive Statistics for Questions 1 and 2... 23
Table 9: Descriptive Statistics for Questions 3, 4 and 5... 26
Table 10: Descriptive Statistics for Questions 6, 7 and 8... 32
Table 11: Descriptive Statistics for Questions 9 and 10... 37
Table 12: Descriptive Statistics for Questions 1 and 2... 43
Table 13: Descriptive Statistics for Questions 3 and 4... .47
Table 14: Descriptive Statistics for Questions 1 and 2... 59
Table 15: Descriptive Statistics for Questions 3 and 4... 62
Table 16: Cross-table between “Average family income level” and “Physical means provided”... 67
Table 17: Cross-table between “Average family income level” and “Salary of a 2nd Lt” ... 68
Table 18: Cross-table between “Having a soldier family member” and “Outdoor recreation services”... 69
Table 19: Cross-table between “Having a soldier family member” and “Military housing services”... 71
Table 20: Cross-table between “Having a soldier family member” and “Military housing services”... 72
LIST OF FIGURES
Regions the students live in... 16
The salary of a 2nd Lt... 24
The prestige and image of military life... 25
Entertainment / recreation services... 28
On-post or outdoor housing services... 29
Health care issues... 31
Not looking for a job... 33
Stationery / clothing... 35
Sport centers and other facilities... 36
Challenging aspects of military life... 39
Career development opportunities... 40
I talk up the military school to my friends as a good school to belong to ... 44
I am glad that I decided to join a military high school... 46
I am proud to tell others that I attend a military high school... 48
I am satisfied with studying in a military high school... 49
Conversation with military high school students... 53
Conversation with teachers / instructors... 54
Conversation with parents... 57
Military discipline in military high schools... 60
Obligatory rotation system... 62
Enemy threat... 63
15-year compulsory service... 64
GLOSSARY
TUAR: (Turkish Army), Türk Kara Kuvvetleri, Türk Ordusu
Cadet: Askeri Öğrenci
Freshman: Hazırlık Sınıfı Öğrencisi
Senior: 3ncü sınıf öğrencisi
Military High School: Askeri Lise
NCO: (Non-commissioned Officer) Astsubay
BOQ: (Bachelor Officers’ Quarter) Misafirhane
C h a p t e r 1
INTRODUCTION
This thesis is a study on military high school students with a view to identify the determinants of their decisions to enter the military high schools.
The recruitment of officers in the year 2003 and beyond constitutes one of the main challenges for the Turkish Army (TUAR). Military recruitment in Turkey is likely to be radically transformed over the next few years. This transformation is basically driven by the need to seek economies in non-core military functions.
1.1 Sources of Officers in the Turkish Army
The Turkish army, like the armies of many other countries, has a number of sources to select the applicants who will serve as army officers for a long period of time, if not for the rest of their lives. Primary school students that have the chance to continue their education in military high schools; high school graduates who may attend army academy to have a university education; university graduates who may directly join the army as an officer with lieutenant rank; reserve officers who may select staying in the army after their twelve-month-mandatory service can be listed as examples of these sources.
TUAR is currently examining a number of possible options to increase the efficiency and maintain the effectiveness of the recruitment process. Although
army is trying to develop some new ways to fill its open “management-level” positions by recruiting contractual officers for limited time periods, still military high schools are the main source for these openings. About 80% of army officers come from a military high school origin; that is, after their 8-year primary education, they attend to one of three military high schools. After spending four years for high school education there (including one year English preparatory class) they move to Turkish Army Academy located in Ankara for another 4 years. Remaining 20% is distributed among the other sources.
Since military high schools are army’s main sources of officers, they have become the main focus of this study. In the process of becoming army professionals, they are influenced by a variety of factors such as demographics, personal traits/abilities and expectations, and conditions of the labor markets. Identifying these factors and determining their relative effect on entry decision will help army refocus its recruiting efforts more effectively. In addition, the general attitude towards the army needs to be assessed. The more positive the outcome of the comparison for the military job, the higher the tendency and probability that people apply for military schools. In sum, in this study the main question that is to be searched is: “what are the determinants of entry decision to military high schools?”
Recruiting is very important for any organization, and for that matter for the military. (Dessler, G. 2000: pp. 84) It is noted that little effort had been expended on identifying the determinants of entry decision to military high
schools, so for a better recruitment practice. There are a few studies done on this subject.
1.1.1 Current Condition in the Turkish Army
The number of people applying to military high schools is decreasing year by year. Since the pool of applicants is getting smaller and, the chance of having high-qualified applicants is also decreasing eventually. This leads, of course, accepting less qualified people to military high schools, in other word to the army. By doing this study, I hope to determine relatively stronger and weaker points that derives people’s interest to the army; and try to improve army’s recruiting efforts on these points. This improvement can be both as focusing on the strong points and revising the weak ones.
1.2 Deciding the Data Collection Technique
The data collection technique that will be used in this study will be the direct administration of a survey. It is commonly discussed that there are four basic ways to collect survey information: (1) mail, (2) telephone, (3) interview, and (4) direct administration1.
One of the most frequently used surveys is the mailed survey. It is one of the most widely used techniques in the social sciences. However it has some disadvantages: (1) the responses may not be honest or may be biased; (2) the return rate is generally quite low. Because of these limitations and disadvantages, I decided not to use this technique.
1 For further discussion on this topic, see Foddy, W. (1993) Constructing Questions for Interviews and Questionnaires
Telephone surveys cannot be used in our case, because they are only appropriate when simple and superficial information is needed and only a few questions are to be asked.
Interviews are those that are conducted in person, with one respondent at a time. The major advantage of the interview over the other survey procedures is that the interviewer can obtain insight into why the respondent answered the way he or she did. Some disadvantages of using interviews are that they require an excessive amount of time and expense. When using the interview approach, it is crucial that the interviewer be well-trained. This training is both time-consuming and expensive, but it is essential if one is to have data that are reliable and valid. To ensure reliability of the data, the researcher must train the interviewers to ask the questions in as much the same way as possible to make sure that each question is presented to the respondents with the same frame of reference. Additional expense is incurred when the researcher feels that it is necessary to check the liability of the data. This can be done by having more than one person interview the same respondent. The data are then compared to see if the responses re consistent.
For all the considerations mentioned above, I have preferred to use directly administered survey technique. Such a situation would be administering a survey to students in a classroom, or at a meeting of the group to which the results are to be generalized. Poor return rate is generally not a problem with directly administered surveys.
1.3 Determining sample size and identity
After having decided which technique to use in data gathering process, next step was to decide which school is to be taken as a sample population. I decided to conduct a questionnaire to military high school students in order to form a basis to this study, because these schools are the main sources of officers in the Turkish Army (TUAR). The TUAR has three military high schools in its inventory. These schools are: Kuleli Military High School located in Istanbul, Maltepe Military High School located in Izmir, and Isiklar Military High School located in Bursa. Each year, approximately 450, 450 and 300 students are graduating from these schools respectively.
It would be too expensive and time consuming to conduct the survey in all of these three schools. On the other hand it is not really necessary to do so. Because, students are allocated to each school with a central selection and allocation system, regardless of their family, financial or regional differences. They don’t have the chance to make a choice about which school they want to join or which one they don’t, i.e. a student in Maltepe Military High School did not choose to join this particular high school but he chose to join anyone of the three military high schools. In that sense, all students in any of these schools can be regarded as identical to each other in terms of forming a sample group.
Determining the size of a sample needs the analysis of multiple factors. These factors are: n (Size of sample population), N (Size of whole population of consideration), d (alpha score of confidence level), t (z-score for the associated alpha score) and finally PQ (0.25 for maximum sample size). All of
these factors should be taken into consideration while deciding on the appropriate sample size. Following formula is used to calculate the size of the sample (n) for this study2.
t² (PQ) / d² 1 + (1/N) t² (PQ) / d²
Here N is taken as 4800 (total number of students in three military high schools); α is chosen as 0.05 (for 95% confidence level) and t is found as 1.96 for α = 0.05. When the necessary computations were made, the sample size was found as 356 students minimum. As the number of students in each school is being considered, Isiklar Military High School is smaller than the other two schools. So I decided not to take the students of this school as a sample group in my study. When two other important issues, transportation time and cost, are taken into consideration; the best alternative for me was Kuleli Military High School. Because of these and due to limitations of time and resources I conducted my survey questionnaire in this school.
1.4 Method
In this section I will give brief information about how the survey was conducted. I will start with describing the sample. Data that is used in this study was gathered through direct administration with a sample of 410 military high school students. The original sample consisted of students from Kuleli Military High School. Among 410 students receiving the questionnaire, 403 (98.3%) returned them. 7 questionnaires were eliminated because they
were unfinished. The analyses were conducted on the remaining 396 respondents. In the final sample, there were 201 freshmen (first year cadets) experiencing their first year in the school and 195 senior students (fourth year cadets) practicing the last year of the school.
1.4.1 Instrument
The survey questionnaire used in this study includes 25 questions trying to measure the respondents’ personal preferences about the army as well as 3 demographic information questions.The questionnaire covered the following subjects: demographics (gender, city, family), how were they aware of military schools, what factors affected them while deciding to attend this school or not, image of financial terms (pay and additional benefits), how did they perceive the health issues, how did they rate their current status and the general image of the army. Then, the respondents were asked as to who influenced them the most (their parents, teachers/instructors, friends etc.). Finally, the questionnaire was finished with considering some factors that may cause respondents hesitate while selecting the military schools and the army for their future career. For most of the items in the questionnaire, respondents were asked to indicate the extent to which the statement was reflecting their opinions (1= Didn’t influenced at all; 5= Strongly influenced or 1 = Strongly disagree; 5 = Strongly agree). Items and scales analyzed in this research are presented at Appendix A.
1.4.2 Procedure
The questionnaires were handed to the respondents in a lecture room and gathered right back after they finished filling the papers. It is generally accepted that the developer of a survey should be concerned about aspects such as length, pertinence, clarity, and types of responses. Evidence suggests that long surveys are less likely to be returned-responding time for a survey should not exceed 20 minutes3. Average time needed to fill this questionnaire
was about 15 minutes.
Analyses were performed by using the SPSS programme.Descriptive statistics (frequencies, crosstabs, and means) were used to describe the data and report on important indicators. Instead of using histograms giving information about the number of responses and frequencies, bar graphs with percentages are preferred to better illustrate the results visually.
3 For further discussion on this topic, see Newman, I. and McNeil, K. (1998) Conducting Survey Research in the Social Sciences
C h a p t e r 2
LITERATURE REVIEW
2.1 Recruitment: Its Importance and Role
The quality of a company’s personnel is frequently the single factor that determines whether the organization is going to be successful, and whether it will reach its basic objectives. (Stanton, E. S., 1977: pp. 1) Finding the right person for the job has always been important and the decision to appoint an individual is one of the most crucial an employer will ever take. This is particularly true in the light of the HRM notion of ‘people as competitive advantage’. There are three themes in the literature focusing on the importance of the selection decision.
First, demographic trends and changes in the labor market have led to a 'less homogenous workforce' which has placed increasing pressure on the notion of fairness in selection. Second, the desire for a multi-skilled, flexible workforce and an increased emphasis on team working has meant that selection decisions are more concerned with behavior and attitudes than with matching individuals to immediate job requirements. And third, the link between corporate strategy and HRM has led to the notion of strategic selection, i.e. a system that links selection to the overall organizational strategy and that aims to match the flow of personnel to emerging business strategies.
2.2 Definitions
It is useful to make a distinction between recruitment and selection. Graham & Bennett (1992: pp. 188) have made the following definitions. Recruitment is the first part of the process of filling a vacancy; it includes the examination of the vacancy, the consideration of sources of suitable candidates, making contact with those candidates and attracting applications from them. On the other hand, selection is the next stage, i.e. assessing the candidates by various means, and making a choice followed by an offer of employment. The recruitment and selection process is concerned with identifying, attracting and choosing suitable people to meet an organization’s human resource requirements. They are integrated activities and ‘where recruitment stops and selection begins is an arguable point’ (Anderson, 1994). Recruitment involves searching for and obtaining qualified job candidates in such numbers that the organization can select the most appropriate person to fill its job needs. (Schuler, R.S., 1995: pp. 217)
The recruitment process can be described as “building a roster of potentially qualified applicants” or “searching for and obtaining potential job candidates in sufficient numbers and quality so that the organization can select the most appropriate people to fill its job needs” (Dowling and Schuler, 1990); whereas selection is more concerned with ‘predicting which candidates will make the most appropriate contribution to the organization -now and in the future’ (Hackett, 1991).
2.3 Why is Recruitment Important?
The general purpose of recruitment is that of providing a pool of potentially qualified job candidates. More specifically, the purposes of recruitment include the following: (Schuler, R.S. 1995: pp. 218)
• Determine the present and future recruitment needs of the organization
• Increase the pool of qualified job applicants with minimum cost • Increase the success rate of the selection process by reducing the
number of obviously under qualified job applicants.
• Reduce the probability that job applicants, once recruited and selected, will leave the organization after only a short period of time • Evaluate the effectiveness of various recruiting techniques and
sources for all types of job applicants
2.3.1 Fundamentals of Successful Recruiting
Erwin S. Stanton lists some fundamentals of a good personnel-recruiting program (Stanton, E. 1977: pp. 48-50):
• A large number of well-qualified job applicants must be attracted • Never compromise on selection standards
• Recruitment should be on a continuous and ongoing basis • Recruiting should be creative, imaginative and innovative
There are especially four methods that can be used for recruitment purposes. Beardwell and Holden listed these methods as following: “1. Internal existing employees, 2. Using existing contacts, 3. External contacts and 4. Advertising
/ media.” (Beardwell and Holden, 1997: pp. 214 - 229) The two methods mostly concerning military are the second and the fourth one. Turkish Army (TUAR) basically uses ‘existing employee contacts’, which is a sub-item of ‘external contacts’ method, as one of recruiting methods, especially for attracting students to Military High Schools. In this method, existing employees inform and encourage family members, relatives and other friends to get in touch with Military High Schools, so that they can be potential applicant for the future. The other method that is used by the Turkish Army is ‘advertising and media’. Advertisements in daily newspaper, over national and local radio / TV stations, in trade journals, and the magazines usually attract applicants in great numbers but of highly variable quality. (Soyles and Strauss, 1981: pp. 174) Some other media vehicles used are conferences, cassettes, videos, brochures and finally open days (allowing potential recruits and sometimes their families and friends access to the place, working conditions, facilities and so forth.
2.3.2 Critical Decisions in Recruitment and Selection
The objective of any HR Management system is to address three (often-competing) requirements4:
• Producing the right person in the right job to meet the mission
• Addressing members’ expectations for a suitable career and standard of living
• Complying with social norms and legislative / regulatory standards
In exchange, the organization is offering:
• Challenging, meaningful, intrinsically rewarding jobs
• Employability opportunities and a fair, equitable standard of living, and
• Employment within social norms and legislative/regulatory standards In a military setting, these are melded together through effective leadership, realistic / tough training and appropriate rewards / discipline system.
In the light of these objectives and offerings, recruitment and selection can be summarized as four critical decisions (Beardwell and Holden, 1997: pp. 211):
• What / who do we want?
• Where do we find the people we want? • How do we attract them?
• How can we identify them?
Let us elaborate on these points. Which comes first -the job or the person? The usual response to the 'What do we want?' question is to start by defining the requirements of the job in a job description and then use this information to identify the necessary personal characteristics in a person specification. This method has been described as 'job first -person later' or 'task-oriented' (Beardwell and Holden, 1997). However, several problems are associated with this approach. The first is that the writing of the job description is time-consuming, especially if a system for job analysis is not already in place. There is a need to gain information from a variety of parties (e.g. boss, current
jobholder and colleagues) as to the nature, actual duties and responsibilities involved. And it is not a one- off exercise; regular updating of the job description is necessary, especially in fast-changing environments.
The second and perhaps the greater, problem lies with the lack of attention paid to the changing requirements of the jobholder and whether the list of duties and responsibilities is too constraining, especially where team working is introduced. This concentration on 'the job' and its place in a bureaucratic structure may be detrimental to the development of the skills and aptitudes needed for the long-term benefit of the organization.
Problems also exist with the compilation of the person specification, not least because techniques for translating information about jobs or organizations into person specifications remain mysterious and well defined. A common assumption is that the existence of such a document can avoid unfair discrimination during the selection process. However, pre-determined criteria can contribute to effective recruitment and selection only if careful consideration has been given to the necessity and fairness of all the requirements. Preconceived or entrenched attitudes, prejudices and assumptions can lead, consciously or unconsciously, to requirements which may not be job related at all but aimed at meeting the assumed needs of customers, colleagues and the established culture of the organization.
A potentially more flexible alternative is to replace the more traditional approach with a 'person-oriented' approach (Iles and Salaman, 1995) which focuses on the generic qualities and behavior required by the organization rather than those determined by a specific job. These 'behavioral dimensions
affecting job performance' can be defined as competencies (Armstrong, 1992).
This competency-based approach is frequently seen as being compatible with HRM initiatives such as flexibility, teamwork and multi-skilling; for example, Armstrong (1992) suggests that organizational requirements will include commitment and the ability to work effectively in a team. However, there is also a rather threatening side to this development: the increased focus on behavioral and attitudinal characteristics may imply the expectation that a workforce could gradually be constructed which would be more receptive to the broad span of HR philosophy than is the case with existing manpower stocks.
In practice, a combination of the task-oriented and people-oriented approaches may be adopted in order to recruit people who not only can do the job but will fit well into the organization.
C h a p t e r 3
WHAT ATTRACTED THE STUDENTS MOST?
3.1 Demographic Variables
In this section 3 questions were asked to the respondents: the city they live in, their average income and if there are other soldiers in their family. By doing so, it is aimed to investigate whether the dispersion of the students, according to geographical regions and income level, is homogenous or not.
Regions the students live in
Blacksea South-east Anatolia East Anatolia Central Anatolia Marmara Aegean Medite rranean Pe rc en t 50 40 30 20 10 0 10 4 7 41 22 8 8
When the above graph is examined, it can be seen that the majority of the students come from Central Anatolia region with 41%. This region is followed by Marmara region with 22%. Blacksea region comes after, followed
by Aegean, Mediterranean, East Anatolia, and South-east Anatolia regions. In terms of income level, it can not be said that students are scattered homogenously. The income level is divided into 4 categories. The categories of income level and the distribution of students among these categories can be seen in Table 1.
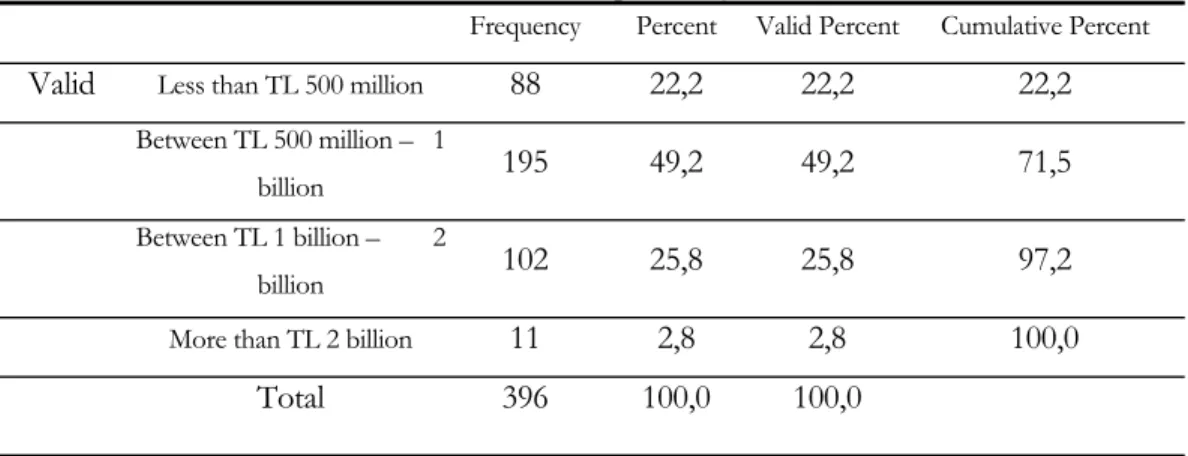
Table 1: What is Your Average Family Income Level?
Frequency Percent Valid Percent Cumulative Percent
Valid Less than TL 500 million 88 22,2 22,2 22,2
Between TL 500 million – 1
billion 195 49,2 49,2 71,5
Between TL 1 billion – 2
billion 102 25,8 25,8 97,2
More than TL 2 billion 11 2,8 2,8 100,0
Total 396 100,0 100,0
As it can be seen from the table above, the majority of students are coming from families with middle to low income level. 71.5% have an income of less than TL 1 billion. The majority falls in the second category (Earning between TL 500 million – 1 billion) with 49.2%. When looked at the statistics of the each group separately, there is no apparent difference between the allocations of two groups in terms of income level. The cumulative percentage of the first two items is 66.2% and 76.9% for the first year cadets (the freshmen) and the senior students respectively. Only 3.5% of the first year cadets and 2.1% of senior cadets (the average is 2.8% for total sample) are coming from families earning more than TL 2 billion monthly5. These findings show that,
the portion of the Turkey’s population who sends their children to Military schools remained the same during years in terms of income level.
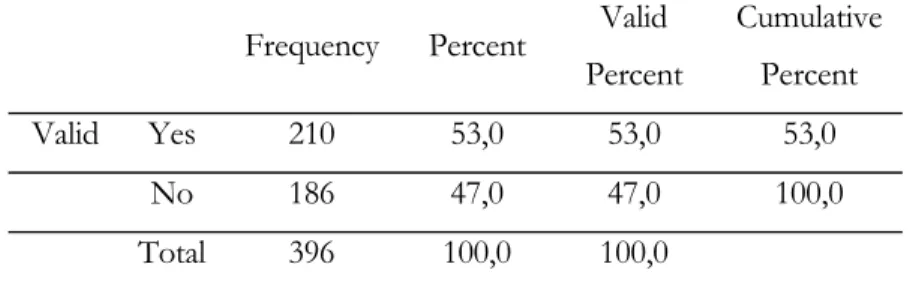
When asked if there are any other professional soldiers in their family and relatives, 53% of the all respondents said yes (See Table 2). The percentages for each group are 60.2% and 45.2% for freshmen and seniors respectively. A raise of 15% is experienced between the two groups6. This increase can be
explained by the changing conditions of military personnel, or decreasing terrorism in our country during the next few years.
Table 2: Are there any other professional soldiers in your family/relatives?
Frequency Percent Valid
Percent Cumulative Percent Valid Yes 210 53,0 53,0 53,0 No 186 47,0 47,0 100,0 Total 396 100,0 100,0
3.2 How Were the Students Aware of Military Schools and Soldiering as a Profession?
The recruitment stage is the first phase of a process in which both applicant and organization send out signals, check if expectations have been met, and make decisions on whether to go to the next stage (the selection stage). The kinds of recruitment literature sent out by organizations do seem to influence applicants’ intentions to apply, but informal sources of job information such as ‘word of mouth’ and referrals are generally seen as more specific and
accurate sources of information than formal advertisement. (Storey, 1995: pp. 211)
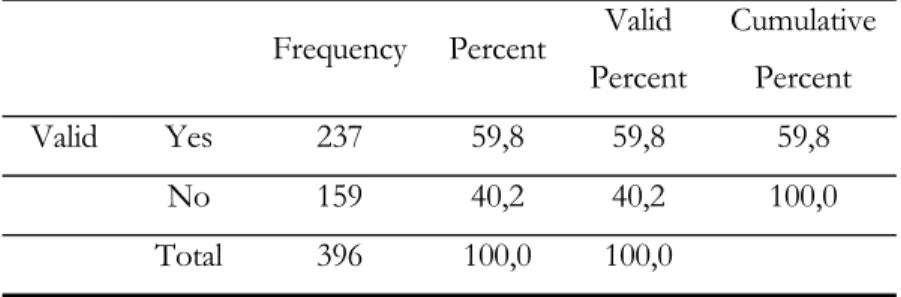
In the following paragraphs, it is explained through which medium (formal and / or informal) mentioned above were the respondents aware of the Military Schools and/or deciding to be an officer for their future lives. Here, the respondents were given six choices to select and only for this question, they were allowed to select more than one choice. This is why the total of the percentages in this section sums up more than 100%. Nearly 60% (237 students) of all respondents heard something about the Military Schools from their families/relatives. (See Table 3) The percentage for the freshmen and seniors are 71.1% and 48.2% respectively. A difference of 22.9% is seen between the two groups. This difference is consistent with the 15% difference between the two groups in the previous question.
Table 3: I have heard about this school from my family/relatives
Frequency Percent Valid
Percent Cumulative Percent Valid Yes 237 59,8 59,8 59,8 No 159 40,2 40,2 100,0 Total 396 100,0 100,0
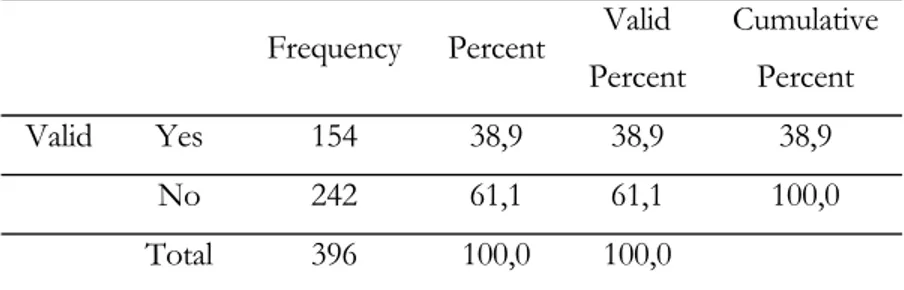
The second choice for this question is that if they have heard about this school from their school mates. 38.9% of all respondent said “yes, we have heard about these schools from our previous school mates”, and 40.2% said
“no”. (See Table 4) The ratios for both groups separately don’t differ from each other very much7. Similarly, 31.3% of all respondents said that they have
heard about Military schools from their teachers/instructors. (See Table 5) When looked at each group separately, there is again a big difference between the two groups here. 42.3% of first year cadets said yes whereas only 20% of last year students gave an affirmative answer. These results indicate that, teachers/instructors are not so effective in giving information about military schools to their students, and also the ratio varies a lot from one year to another (The difference is 22.3% here). This can be because of either they are unwilling to lead the students towards these schools or they themselves have little knowledge about Military Schools and/or military life etc.
Table 4: I have heard about this school from my school mates
Frequency Percent Valid
Percent Cumulative Percent Valid Yes 154 38,9 38,9 38,9 No 242 61,1 61,1 100,0 Total 396 100,0 100,0
Table 5: I have heard about this school from my teachers/instructors
Frequency Percent Valid
Percent Cumulative Percent Valid Yes 124 31,3 31,3 31,3 No 272 68,7 68,7 100,0 Total 396 100,0 100,0
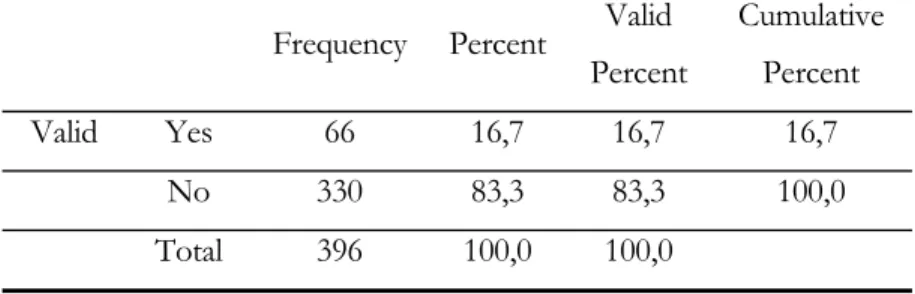
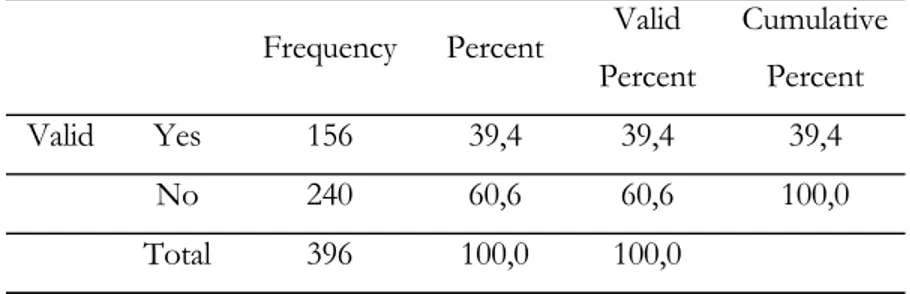
The fourth choice given to respondents for this question is that whether they have heard about the Military Schools via print media, i.e. newspapers, magazines, billboards etc. 16.7% of total sample checked the “yes” box for this choice and the remaining 83.3% checked as “no”. 19.4% of freshmen and 13.8% of senior cadets are informed about these schools and military life as a profession via print media. (See Table 6) This vehicle is the least scored one among others. Fifth choice was about television. Respondents are asked if they were aware of the Military schools via television or not. 39.4% of all gave positive answers while 60.6% gave negatives. The difference between the two groups is only 1.2%. (See Table 7) (The percentages were 38.8% for first year students and 40% for last year students8. It can be stated that television is the
most consistent one among all choices reflected here. It is also the second highest scored choice among the six choices mentioned in this study.
Table 6: I have heard about this school via magazines/newspapers
Frequency Percent Valid
Percent Cumulative Percent Valid Yes 66 16,7 16,7 16,7 No 330 83,3 83,3 100,0 Total 396 100,0 100,0
Table 7: I have heard about this school via television
Frequency Percent Valid
Percent Cumulative Percent Valid Yes 156 39,4 39,4 39,4 No 240 60,6 60,6 100,0 Total 396 100,0 100,0
Given these results concerning the media vehicles, it can be stated that advertising is not being used as affective as it should be.
The sixth and the last choice for this question was “The others” choice. In this choice the respondents were asked to write any possible choice they may have experienced different from the five choices given above. Only 8.6% of all respondents gave answer to this question. Since the proportion is relatively small and the choices are scattered in a wide spread area, details will not be provided.
3.3 Determinants of the Entry Decision to Military High Schools
Decision or indecision on what school to attend is common among primary school graduates and their parents. What is the attraction to the military high schools for a primary school students and graduates? Is it the pay? The benefits? Each student has his own reasons along with personal and professional goals. In this part of the questionnaire it is aimed to reveal the reasons why those students choose to attend a military collage and have a military life for their future career.
In this section students were asked 10 questions about how they evaluate some factors, which may possibly have affected their minds while deciding on
entering Military Schools9. They were given a scale ranging from 1 to 5. The
scale was as follows: 1 = Not affected at all, 2 = Somewhat Affected, 3 = No Opinion, 4 = Quite Affected, 5 = Totally Affected. They were asked to mark the best answer the extent to which it reflects their ideas.
3.3.1 Financial Terms
The first question was about the salary of a Second Lieutenant (2nd Lt.) who is
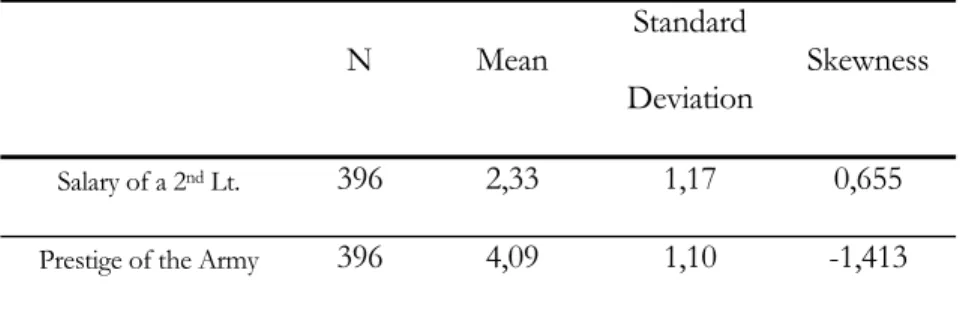
just graduated from Turkish Army Academy. Students were asked if this payment influenced them, while they were making their mind up. The mean of the answers to this question is 2.33 with a standard deviation of 1.17. It has a skewness of 0.655, i.e. it is not sharply but moderately skewed to one side of the scale, and the answers are not condensed in one point. (See Table 8)
Table 8: Descriptive Statistics for Questions 1 and 2
N Mean Standard
Deviation Skewness
Salary of a 2nd Lt. 396 2,33 1,17 0,655
Prestige of the Army 396 4,09 1,10 -1,413
26.8% of all respondents said that it didn’t affect them at all and 39.9% said that it is somewhat influenced their minds. 21.7% said either 4 or 5 to this question. 11.6% had no opinion about this subject. The students who gave 1 or 2 to this question can be considered as the ones who are not extremely affected by the salary they will get after graduation. Their cumulative percentage sums up to 66.7, showing that the majority of the students fall to
this part. These findings can be better seen with the following graph. As nearly 67% of all respondents’ answers suggest, financial terms do not appear to be a major instrument in generating tendency toward military high schools, and towards the Turkish Army as well.
The Salary of a 2nd Lt.
Totally affected Quite affected
No o pinion Somewhat affected
Not affecte d at all
Pe rcen t 50 40 30 20 10 0 4 17 12 40 27
3.3.2 Prestige / Esteem towards army
In the second question, the subject is the general image of the military life and prestige of soldiering as a profession. Companies that have established themselves positively in the public eye are natural magnets for good people (Half, R. 1993: pp. 17). So, the image of the soldiers’ job is, I believe, an important predictor of intention to work for the army as a soldier. Therefore it is important to know what these young people think about the general image of this job and how these expectancies are related to their behavior10.
The students were asked if the high esteem towards the military personnel in
society has affected their decision. The answers to this question exhibit the highest mean of 4.09 and the lowest standard deviation of 1.10 among the ten questions in this section (See Table 8), showing that the majority of the respondents agreed around the same point11. The skewness for this question
is also the highest one among the same ten questions with a score of -1.14312.
This high score and minus sign before it indicate a strong skewness towards the right hand side of the scale. When individual percentages are examined, it is seen that 83.8% of all respondents said they either “quite affected” or “totally affected” (41.4% graded as 4, and 42.4% graded as 5). (See the graph below)
The prestige and image of military life
Totally affected Quite affected
No o pinion Somewhat affected
Not affecte d at all
Pe rcen t 50 40 30 20 10 0 42 41 3 8 5
When each group is examined separately, 92% of the beginners graded the question either 4 or 5, whereas 75.3% of the senior cadets scored the question with the same grades. The 16.7% difference between the two groups can be
explained in this way: At the very early stages of their military school life, as well as before entering these schools, all students had positive feelings about the prestige and the regard of this profession. But when the years pass by in this community, some of them have changed their minds. They don’t find this job as prestigious as they thought it was before; or because of the difficulties they encountered during their military life, they regret with their initial decision so that they don’t find this job as attractive as they did before.
3.3.3 Military Services / benefits
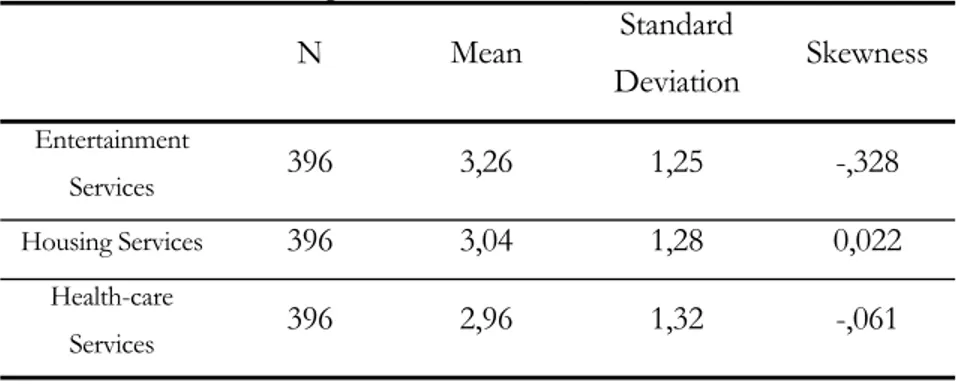
The third, fourth and fifth questions are about the on-post and/or outdoor services that will be offered to military personnel, after either they begin their professional lives in the army or being retired after active-duty periods, like entertainment and recreation services, housing services health care services etc. All three questions demonstrated more or less the same figure in terms of percentages. It can be concluded that these services have approximately the same influence over people who intend to attend military schools and live a military life in the future.
Table 9: Descriptive Statistics for Questions 3, 4 and 5
N Mean Standard Deviation Skewness Entertainment Services 396 3,26 1,25 -,328 Housing Services 396 3,04 1,28 0,022 Health-care Services 396 2,96 1,32 -,061
Instead of giving a general picture of the individuals’ attitude towards the services mentioned above, detailed information about each of them has been provided in the consecutive paragraphs.
The Army and other military services offer some recreation activities to its members and their family. Some of these activities are seasonal activities like summer and winter camps, and some keeps on all through the whole year like officers clubs. The third question, “To what extent were you influenced by the outdoor military recreation services offered by the military clubs, summer camps etc.”, is asked to see the affect of these activities over people considering selecting to be an officer as their future career. The respondents were asked to answer this question again by using the same scale. The mean of answers to this question is 3.26 with a standard deviation of 1.25 and a skewness of 0.328. (See Table 9) The high standard deviation tells us that the answers are not concentrated at a specific point, i.e. respondents don’t agree on one point for this subject. The skewness number (0.328) shows that there is not a visible side that the answers are skewed towards. The highest percentage belongs to “quite affected” choice, which is 42.4%, and the “somewhat affected” choice has the second highest percentage with 27.5%. When looked at the cumulative percentages 56.5% of the all respondents fall to the right half of the scale, i.e. more than half of the students perceived the recreation activities as an important determinant for their decision making process. 7.1% said that they have no opinion about this subject, and just 8.8% said it didn’t affect them at all. These findings are visually represented by the following graph.
Entertainment Recreation Services
Totally affected Quite affected
No o pinion Somewhat affected
Not affecte d at all
Pe rcen t 50 40 30 20 10 0 14 42 7 28 9
The groups are also examined separately, but no clear evidence of differentiation between them could have been found.
The army offers housing services in almost every city and district, ranging from lodgings for the active-duty members to BOQs (Bachelor officers’ quarters) for active-duty members as well as retired personnel and their family. The fourth question of the questionnaire was about these accommodation services: “To what extent, the military housing services influenced your decision to enter these schools?” A similar figure with the previous question can be observed for this question. The mean for answers are 3.04 with a standard deviation of 1.28. (See Table 9) The high deviation score here again implies that the respondents’ answers are scattered among different choices rather than being concentrated on a single choice. The skewness score for the question is 0.22, which shows that the answers are not
concentrated in the direction of one end of the scale, but they are scattered between two or more choices similarly.
When glanced at the percentages of fourth question, in the light of the graph below, we see that the biggest share goes to the second choice, which is “somewhat affected”, with 34.1%. The “quite affected” choice has 31.6% of votes from all respondents. 44.7% of all choices fall to the left hand side of the scale, i.e. to 1st and the 2nd choices, and 45.2% falls to the other half of the
scale. 10.1% stated “no opinion” to this question. The groups are examined separately. But, again, no evidence of differentiation was found between them.
On-post or Outdoor Housing Services
Totally affected Quite affected
No o pinion Somewhat affected
Not affecte d at all
Pe rcen t 40 30 20 10 0 14 32 10 34 11
The fifth question was about the health care services the respondents will be offered during all their military lives. The military personnel are offered a variety of health care and dental care services during both in their active-duty period and retirement period. In this question respondents were asked to state
to what extent do the following statement reflects their opinions: “The health care issues offered by the military, influenced me while deciding on entering this school”. The mean and the standard deviation of answers to this question is 2.96 and 1.32 respectively. (See Table 9)These numbers shows us that the majority of answers are scattered just around the center choice. Again we see from the high deviation score that there is not a concentration of answers for this question. The skewness is 0.61, showing that the answers are scattered smoothly between two or more choices. When looked at the individual percentages, 32.1% of all respondents said that they are quite affected by the health care issues. 26% said that they are somewhat affected with these issues. 16.9% said that they are not influenced at all, and 12.1% said that are totally affected. 12.9% of all respondents marked “no opinion” choice for this question. This question has the highest percentage on the “not affected at all” choice, among the three questions mentioned before. This shows that health care issues are the weakest ones, among other services provided, that can be used to influence people. (See graph below)
But an interesting item lies behind this total figure. When the two groups are examined independently we see that the senior cadets scored the highest for the first choice of this question (25.6% of them said “not affected at all”), whereas only 8.5% of the first year cadets marked the same answer.
Health Care Issues
Totally affected Quite affected
No o pinion Somewhat affected
Not affecte d at all
Pe rcen t 40 30 20 10 0 12 32 13 26 17
The high percentage of the senior cadets boosted the overall percentage for the first choice of this question. The 17.1% difference between the two groups can be put in plain words as this: at the beginning, all nominees take health care service as an important issue to some extent, as well as other services mentioned in above paragraphs, but as the years pass by they got used to this service because this is the only one they are offered during their military studentship period. So they lost the feeling of importance they used to have for health care at the beginning, i.e. since they have it right now, they don’t take is as less important an issue than housing services, or recreation services.
3.3.4 A guaranteed job
It is commonly believed that the first and most probably the biggest problem for a young graduate of any university in our country, is the problem of finding a good job that offers a satisfactory salary at the beginning, with some
other means. People try to choose the most promising department of the universities, which somehow guarantees a good job for their future. The Military solves this problem by employing their students in a job immediately after their graduation.
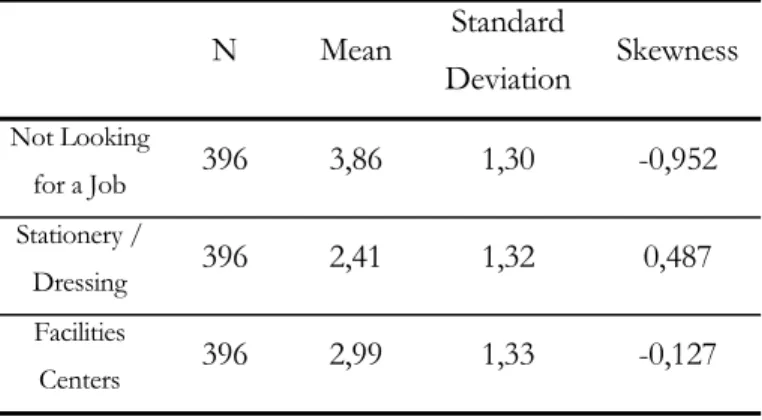
Table 10: Descriptive Statistics for Questions 6, 7 and 8
N Mean Standard Deviation Skewness Not Looking for a Job 396 3,86 1,30 -0,952 Stationery / Dressing 396 2,41 1,32 0,487 Facilities Centers 396 2,99 1,33 -0,127
The sixth question of this section of the questionnaire addresses this problem solving of the Military by asking the respondents “To what extent they are affected by not having a problem of looking for a job after graduation?” the mean of answers to this question is 3.86, which is the second highest mean in this section. (See Table 10) The standard deviation, which is 1.30, is relatively high but this does not make any predicament since the mean is high also. The skewness is -0.952 showing that the answers are slightly skewed towards the right side of the scale.
When looked at the percentages, 41.7% of all the respondents said that they are “totally affected” with it. This number is again the second highest percentage for “totally affected” choice after the second question of this section - which was about the high esteem towards the military personnel in our society. 32.3% said that the case of not having this problem “quietly
influenced” their minds while deciding on selecting this school to attend. 14.9% gave “somewhat affected” as an answer, and just 7.3% said “not affected at all”.
Not Looking for a Job
Totally affected Quite affected
No o pinion Somewhat affected
Not affecte d at all
Pe rcen t 50 40 30 20 10 0 42 32 4 15 7
When gazed at the cumulative percentages, the picture becomes more apparent. 74% of all responses fall in “quite affected” and “totally affected” category. Just 22.2% said they are either somewhat affected or not affected at all. (See graph above) The individual percentages of the groups are more or less the same except for “totally affected” choice. 34.4% of senior cadets marked this answer, where 48.8% of the first year cadets marked the same.
3.3.5 On-post / on-school facilities
When drawn closer to the next two questions, we came across the on-school facilities, sports centers, tangible and intangible services offered to military students in military schools. It can be inferred from the results of these two questions that, these services don’t have a strong effect on people in deciding
to attend military schools, like the housing services, health care services etc. don’t have. The answers to both questions are scattered towards either side of the scale, showing that respondents don’t have certain opinions concentrated on one single point about these two subjects. The detailed information about the questions is presented in the following two paragraphs.
The Army offers free stationery (including books, some amount of paper and pen/pencil etc.) as well as free clothes (including underwear, nightdress and everything else) to the military students throughout their whole education period. Besides, the students are paid a certain amount of allowance for their other different needs. The seventh question is about these physical means offered to military students, like stationery, free uniforms for on-post and outdoor dressing, a certain amount of allowance per month etc. the respondents were asked to mark the choice which reflects their mode best for the following question: “To what extent did you influenced by the tangible resources that will be provided to you during your military school life?” The mean for this question is 2.41 and the standard deviation is 1.32. (See Table 10) These descriptive statistics inform us that the answers are scattered a lot around the mid-point. The skewness is 0.487, again showing that the answers are slightly skewed towards the left hand side of the scale. 33.8% of the respondents said that they are not influenced by this free stationary, dressing etc. at all. 25.5% said they are somewhat affected. 19.4% declared that these offerings quietly affected them. Only 7.3% marked the fifth choice saying that they are totally affected by them, whereas 13.9% stated no opinion. These findings can better be seen on the following graph.
Stationery / Clothing
Totally affected Quite affected
No o pinion Somewhat affected
Not affecte d at all
Pe rcen t 40 30 20 10 0 7 19 14 26 34
Again, the high percentage of the “not affected at all” choice results from the 47.7% share given to this choice by senior cadets. Only 20.4% of the freshmen scored 1 for this question. Another interesting result of this question is that, 17.9% of the freshmen stated they have no opinion about this subject (which is the highest score given to this choice among all questions in this section). In the light of this piece of information, the 27.3% difference for the 1st choice between the two groups reveals us the following:
at the beginning the nominees didn’t know much about these offerings so that 66.2% of them scored this question 1 (Not affected at all), 2 (Somewhat affected) or 3 (No opinion). But the senior cadets, after having experienced the offerings listed above for four years, most of them didn’t reply the question with “no opinion” choice. After again getting used to these offerings throughout all the years, they didn’t take them as important as they
thought anymore. So, they preferred to say “somewhat affected” or “not affected at all” as an answer.
Next question, the eighth one, is about the sports centers and other facilities offered in Military schools. In almost all of the military schools there are number of different facilities centers like, swimming pools, football fields, tennis clubs, libraries, language-learning labs and many others. Students were asked to what extent they are influenced by these facility centers while making their mind up about these schools. The mean for this question is 2.99, and the standard deviation is 1.22. (See Table 10) These numbers tells us that the answers are scattered around the mid-point, but slightly towards the right hand side of the scale. The small skewness number with a minus sign (-0.127) also supports these findings, confirming that the answers are very slightly skewed to right hand side, i.e. not skewed at all. The bar graph presented below will help us visually notice these findings better.
Sports Centers and Other Facilities
Totally affected Quite affected
No o pinion Somewhat affected
Not affecte d at all
Pe rcen t 40 30 20 10 0 11 36 10 26 17
Apart from the findings of the previous question, just 10.1% of all respondents said that they have no opinion about this subject. Another difference is that the majority of the votes fall to fourth category (“quite affected” choice) with 35.9%. And the second biggest share goes to “somewhat affected” choice with 25.5%, as the mean and standard deviation numbers also suggested, whereas 11.4% said they are “totally affected” with these facilities. Again the same figure with some previous questions can be noticed when the two groups are observed separately. The 59.7% of first year cadets scored this question with either 4 or 5, where only 34.4% senior cadets marked the same answers. The answers of senior cadets shifted towards the first and the second choices with 27.2% and 26.2% respectively, where only about 32% of freshmen spotted totally.
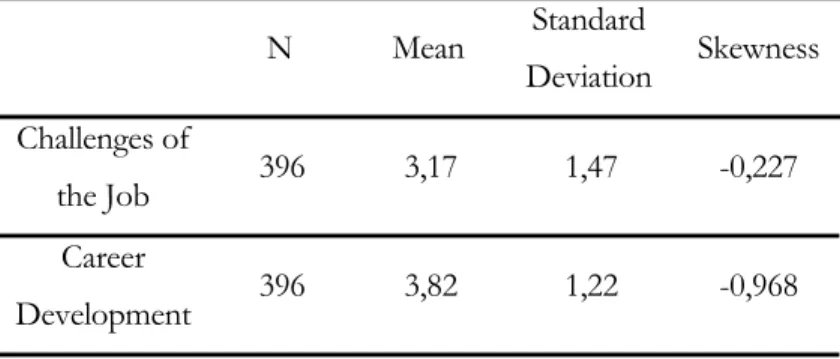
3.3.6 Other aspects of a military profession
Finally the ninth and the tenth question of this section try to assess the people’s attitudes toward some challenging parts of the military life and the opportunity of career development that people would have if they select to enter military schools. The answers to the first question were rather smooth, while answers to the second one were more concentrated at a point.
Table 11: Descriptive Statistics for Questions 9 and 10
N Mean Standard Deviation Skewness Challenges of the Job 396 3,17 1,47 -0,227 Career Development 396 3,82 1,22 -0,968
The ninth question asked to students was as follows: “To what extent were you influenced by some challenging points specific to military life, like using a gun, working in field etc.” The mean of answers to the question was 3.17 with a standard deviation of 1.47. The mean gives us an idea about the center of the distribution of answers, which is: the respondents gave answers between the middle choice and mid-to-right side of the scale. The high standard deviation says that answers are scattered evenly among choices. Very little skewness of the answers (-0.227) also shows that the answers are scattered smoothly, rather than shifting toward one side. (See Table 11) 27.8% of all respondents said that they are quite affected with these features of the military, and 23.5% said “totally affected” for the same question. On the other hand 19.4% marked the first choice (“not affected at all”), and 10.9% declared “no opinion”. Remaining 18.4% are “somewhat affected” with the features mentioned above. As it can be better seen from the graph below, it is very difficult to make any interpretation about this subject.
Challenging Aspects of Military Life
Totally affected Quite affected
No o pinion Somewhat affected
Not affecte d at all
Pe rcen t 30 20 10 0 23 28 11 18 19
When looked at the cumulative percentages of each group, the freshmen scored either 1 or 2 with the percentage of 28.4, and the senior cadets reached 47.7% for the same choices of the same question. On the other hand only 40.5% of senior cadets were either “quite affected” or “totally affected”, whereas 61.7% of freshmen felt the same way. These numbers explicitly shows the negative manner of senior cadets against the hardness of military life.
Finally the tenth question asked to respondents in this section measures the students’ attitudes towards the opportunity of career development that people would have in this profession. This question has a greater mean (3.22) and a smaller standard deviation (1.22) than the answers to the previous question (See Table 11). These numbers show that people have positive feelings regarding career development opportunity more than they have for challenging job characteristics. Also the skewness number is greater (-0.968)
for this question. This tells us that, the answers are more shifted towards right side of the scale. Totally 72% of all respondents gave either 4 or 5 to this question. The majority of votes go to “quite affected” choice with 37.4%. Then “totally affected” choice comes with 34.6%. 9.8% of all said that they are “somewhat affected”, while only 7.3% said they are “not affected at all”. The high cumulative percentage toward the right side of the scale declares that students take career development issue as an important one, and this issue was on their minds while deciding on whether to select military schools or others to attend. (See the Graph below)
Career Development Opportunities
Totally affected Quite affected
No o pinion Somewhat affected
Not affecte d at all
Pe rcen t 40 30 20 10 0 35 37 11 10 7
When two groups are examined individually, 78% of the freshmen cadets scored 4 or 5, whereas about 75% of senior cadets did it the same way. The percentages, which are so close to each other, tells us that at the beginning of their military careers, all students have some plans regarding their future, and when the years pass by these plans do not fade away. People still keep those
plans for their future careers, and they think military offers them the opportunity to achieve those plans.
C h a p t e r 4
STUDENTS’ OPINION TOWARDS MILITARY SCHOOLS
Once people choose to join a group, even it is a formal work assembly or an informal friend group; they immediately begin to evaluate this group in terms of relationships, their role in the group etc. And finally they come to a conclusion about whether they are satisfied with what they do, where they are and how they are treated. The satisfaction level they have, the pride they feel toward the community they belong and the degree to which they are happy with their situation in there, have a vast effect on their both present and future performance.
In this chapter, the statistical results of the responses to four questions, related to the students’ opinions towards military high schools are examined. In the third part of the questionnaire, students were asked to state both positive and negative feelings they may have towards their school. As in the previous chapter, the answers of total sample were basically interpreted for each question, and the results of each group (the freshmen and the senior cadets) are given separately where needed.
4.1 Is it a good school to belong to?
The first sentence of this section was as follows: “I mention the Military High School to my friends as a good school to belong to”. The respondents were asked to what extent this question reflects their ideas. They were given a little
different scale than they use while answering the previous questions in the first two sections of the questionnaire. This was again a five point scale with different comments: 1 = Strongly disagree, 2 = Disagree, 3 = No Opinion, 4 = Agree, 5 = Strongly Agree.
Table 12: Descriptive Statistics for Questions 1 and 2
N Mean Standard
Deviation Skewness
Salary of a 2nd Lt. 396 3,65 1,30 -0,823
Prestige of the Army 396 3,91 1,26 -1,071
The mean of total answers to this question is 3.35 with a standard deviation of 1.30. These numbers tell us that the answers are around the middle to right point, but still some answers fall into the other half of the scale. The skewness is -0.823 (See Table 12) that shows us that the answers are more likely to shift towards the right side of the scale. These findings can be better understood with the graph represented below.
As the graph exposes, the majority of the votes falls to the fourth choice with a percentage of 35.9. The fifth choice follows it wit 30.3%. 11.4% of all respondents said they strongly disagree with the statement, followed by the 8.3% saying they disagree. 14.1% of all respondents declared no opinion about this subject.
I talk up the Military School to my friends as a goo d school to b elong Strongly Agree Agree No O pinion Disagree Strongly d isagree Pe rcen t 40 30 20 10 0 30 36 14 8 11
When looked at the cumulative percentages 66.2% of all respondents say either “agree” or “strongly agree” with the stated expression. The percentage may seem quite high. When looked at the percentages of each group separately, it can easily be seen that this percentage may even be higher if the senior cadets’ votes were not counted. Because, nearly 50% of senior cadets’ votes fall to “agree” side of the scale (the fourth and the fifth choices as answers), but nearly 24% of them fall into the other side (the first and the second choices) of the scale. When the opinions of first year cadets (freshmen) are examined, it is seen that the cumulative percentages are quite different: nearly 73% for the “agree” side of the scale and only 5.5% for “disagree” side. It can be concluded from these results that, senior cadets have more negative feelings towards the school they belong, either because they saw more minuses through the years they spent there, or they spent harder times that the freshmen would face in future. Another explanation can
be made by the nature of the human itself. Since people never remember the good things they lived, but never forget the terrible times they have experienced, while the days go by, the senior cadets have more and more pessimistic memories toward the school they belong.
4.2 Students’ happiness for being in a Military High School
The second statement of the third part was: “I am glad that I decided to join a Military High School”. Again the respondents used the same scale to declare their opinions regarding to this statement. The mean of the answers to this question is 3.91 and standard deviation is 1.26 (See Table 12). The slightly greater mean, and almost the same standard deviation, show that people have more or less the same feeling about this subject with what they had for the previous one. This is an expected result because when you feel happy with the situation you live in a place, you most probably say others this is a good place to belong to. Again the high skewness score with a minus sign (-1.071) symbolizes the shift toward the right hand side of the scale. When come to the individual percentages of each choice of the scale, it is seen that the mass of the choices go to number four (“strongly agree”) with 42.7%. The following choice is number four (“agree”) with the percentage of 29.3. 8.6% of all respondents marked the first choice, whereas 6.3% marked the second. Remaining 16.4% spotted the “no opinion” choice for this question.
I am glad that I decided to join a Military High School Strongly Agree Agree No O pinion Disagree Strongly d isagree Pe rcen t 50 40 30 20 10 0 43 29 13 6 9
Totally 72% of all votes fall into the right side of the scale and 14.9% falls to the other side. The above graphbetter represents these findings visually. The percentages of the groups are observed separately once more. A similar figure with the previous question was observed. 17.5% of senior cadets marked either “disagree” or “strongly disagree” choices for the regarding expression where only 4.5% of freshmen spotted the same. A bigger difference was monitored when looked at the other side of the scale. A great majority of the freshmen (91.5%) marked either “agree” or “strongly agree” choices, but only 51.8% of senior cadets marked the same choices. Here, the votes of the senior cadets pull down the total percentages of the fourth and fifth answer choices similar to the first one; but since the difference is bigger and the question is more decisive, this 40% difference needs further consideration I believe.