J Cosmet Dermatol. 2020;19:1239–1245. wileyonlinelibrary.com/journal/jocd © 2019 Wiley Periodicals, Inc.
|
12391 | INTRODUCTION
Alopecia areata (AA) is an autoimmune and inflammatory disease that causes nonscarring hair loss, typically presenting with round or oval patches on the scalp or body. It may be seen at any age, but it often starts in childhood and symptoms occur in the first 20 years in 60% of patients. Male and females are equally affected, and the prevalence is almost the same in all ethnic groups. The etiopatho‐ genesis of AA is not yet fully understood, but genetic susceptibility,
immunological factors, melanocyte abnormalities, keratinocyte de‐ generation, neurological factors, infections, and emotional stress triggers are all considered potential contributors.1 Numerous studies
confirm that AA is an autoimmune disease, where hair loss is de‐ stroyed by cytotoxic T lymphocytes directed against the hair folli‐ cle.2,3 Certain circulating inflammatory cytokines and markers are
increased in patients with alopecia areata. The inflammatory cyto‐ kines are IL‐17A, IL‐17F, IL‐21, IL‐22, IL‐6, and TNF‐α. These cyto‐ kines are reported to be elevated in patients with AA, suggesting
Received: 19 September 2018
|
Revised: 13 February 2019|
Accepted: 12 August 2019 DOI: 10.1111/jocd.13131O R I G I N A L C O N T R I B U T I O N
Evaluation of complete blood cell and inflammatory parameters
in patients with alopecia areata: Their association with disease
severity
Zeynep Gizem Kaya İslamoğlu MD
1| Abdullah Demirbaş MD
21Department of Dermatology, Faculty of Medicine, Selcuk University, Konya, Turkey 2Konya Numune Hospital, Department of Dermatology, Konya, Turkey
Correspondence
Zeynep Gizem Kaya İslamoğlu, Department of Dermatology, Faculty of Medicine, Selcuk University, Konya, Turkey.
Email: [email protected]
Abstract
Background: Alopecia areata (AA) is a chronic inflammatory disease characterized by
non‐cicatricial hair loss. The cause of the disease is still unknown. It can appear at any age and occurs in 0.2% of the general population. Red cell distribution width (RDW), mean platelet volume (MPV), plateletcrit (PCT), the ratio of neutrophils to lympho‐ cytes (NLR), and the ratio of platelets to lymphocytes (PLR) have all been reported as inflammatory markers in recent studies. However, these parameters have not been investigated in AA patients.
Aim: We investigated the haematological and inflammatory parameters of AA and
considered their association with disease severity.
Patients/Methods: One hundred and five patients with AA and 108 healthy controls
were enrolled in the study. RDW, MPV, PCT, NLR, PLR, erythrocyte sedimentation rate (ESR), and C‐reactive protein (CRP) were studied retrospectively. Disease sever‐ ity was evaluated by using the Severity of Alopecia Tool (SALT) score.
Results: There were no statistically significant differences between RDW, MPV, PCT,
NLR, and PLR levels in AA patients and in healthy controls. Only the CRP values were significantly higher in the AA group.
Conclusion: Complete blood count (CBC) parameters are low‐cost tests that can be
used to define inflammation levels in inflammatory diseases. Our study shows that CRP can be used as a marker in diagnosing AA.
K E Y W O R D S
alopecia areata, c‐reactive protein, inflammation, mean platelet volume, red blood cell distribution
that they play an important role in the pathogenesis of the disease. All these alterations are expressed through inflammation of the hair follicle and may result in hair loss.4
Complete blood count (CBC) parameters have been introduced as diagnostic biomarkers for many diseases associated with the inflammatory process: Red cell distribution width (RDW) demon‐ strates the size variability of circulating erythrocytes and is cal‐ culated by dividing the standard deviation of red blood cell (RBC) volume by mean corpuscular volume (MCV) and is used to identify the causes of anemia.5 Mean platelet volume (MPV) has been iden‐
tified as a platelet activation marker and plays an important role in inflammatory reactions.6 Plateletcrit (PCT) is a novel biomarker in in‐
flammatory and vascular diseases such as Crohn's disease, coronary artery disease, deep vein thrombosis, and sepsis.7 It is calculated by
the formula platelet count (PLT) × MPV/107. The resulting PCT pro‐ vides more comprehensive information about the total platelet mass and is more sensitive than other platelet parameters.8 Among the
other parameters, the ratio of neutrophils to lymphocytes (NLR) and the ratio of platelets to lymphocytes (PLR) are simple markers of sys‐ temic inflammatory response.9 The erythrocyte sedimentation rate
(ESR) and the c‐reactive protein (CRP) concentration are the param‐ eters most frequently used to show the intensity of inflammation in inflammatory diseases.10 Recently, these markers have been studied,
individually or together, in relation to various dermatologic diseases such as psoriasis, rheumatologic diseases of dermatology, cutaneous vasculitis, atopic eczema, pityriasis rosea, Behçet's disease, recur‐ rent aphthous stomatitis, and pemphigus vulgaris.6,11‐13 There are
no studies in the literature that investigate the relationship between alopecia areata and these inflammatory markers, and to the best of our knowledge, this is the first study to examine the association be‐ tween these markers and disease severity.
In this study, we aimed to evaluate the relationship between RDW, MPV, NLR, PLR, PCT, CRP, and ESR levels in alopecia areata patients compared to healthy controls and to identify their associa‐ tion with disease severity.
2 | MATERIALS AND METHODS
This study was initiated after approval by the research and ethics committee, numbered: 2018/02. The study group included patients with alopecia areata of the scalp and healthy controls who had never experienced AA. This was a retrospective study conducted between June and December 2017. The demographic characteristics and laboratory information for both the sample and the controls were recovered from the database of the health center. The demographic data included age, sex, disease duration (months), type of AA (patch, alopecia totalis [AT] or alopecia universalis [AU]) and alopecia areata severity. This was evaluated by using the Severity of Alopecia Tool (SALT) score (S0: no hair loss; S1: <25%; S2: 25%‐49%; S3: 50%‐74%; S4: 75%‐99%; and S5: 100% scalp hair loss).14
Laboratory data included white blood cell count (WBC; K/µL), platelet count (PLT, K/µL), RDW, PCT, MPV (K/µL), neutrophil count
(NE; K/µL), lymphocyte count (LY; K/µL), neutrophil‐to‐lymphocyte ratio (NLR), platelet‐to‐lymphocyte ratio (PLR), erythrocyte sedi‐ mentation rate (ESR; m/h), and c‐reactive protein (CRP; mg/dL).
Patients with dermatological disease other than AA, or who had active infection, malnutrition, anemia, immunodeficiency, chronic inflammatory skin disease, rheumatologic disease, haematological disease, cardiac disease or who used medication were excluded from the study. On the other hand, healthy control group comprised sub‐ jects taken from database who had no AA or other active infection, no systemic or dermatological inflammatory disease and no history of medication use.
The data obtained for the study were analyzed by using SPSS (Statistical Package for Social Sciences) for Windows 22.0. Number, percentage, mean and standard deviation were used as descriptive statistical methods for the evaluation of the data. The t test was used to compare the quantitative continuous data between the two
TA B L E 1 Distribution of gender in groups
Gender
Group
Alopecia areata Healthy control
n % n %
Male 72 68.6 49 45.4
Female 33 31.4 59 54.6
Total 105 100.0 108 100.0
TA B L E 2 Demographic features of disease
Alopecia areata Frequency (n) Percentage (%)
Type of AA (patch)
+ 98 93.3
− 7 6.7
Total 105 100.0
Type of AA (alopecia totalis)
+ 4 3.8
− 101 96.2
Total 105 100.0
Type of AA (alopecia universalis)
+ 3 2.9 − 102 97.1 Total 105 100.0 SALT score S1 87 82.9 S2 6 5.7 S3 5 4.8 S4 1 1.0 S5 6 5.7 Total 105 100.0
Disease duration (month)
independent groups. The Pearson correlation analysis was applied to the continuous variables of the study. The findings were evaluated at a 95% confidence interval and at a 5% significance level.
3 | RESULTS
One hundred and five AA patients and 108 healthy con‐ trols evaluated in this study. The median age for the patients’ group was 24.97 ± 10.91 years and for the control group, it was
27.45 ± 10.80 years. There was no statistically significant differ‐ ence between the groups according to age. The gender distribu‐ tion of the groups is shown in Table 1. The most common type of AA was patch AA (93.3%), the second common type was AT (3.8%), and the least common, AU (2.9%). The disease duration was 16.029 ± 37.219 months. The distribution of the type of AA, the disease duration, and the SALT score of the patients are shown in Table 2. The WBC was significantly increased in the AA patients (x̄ = 8.459) relative to the healthy controls (x̄ = 7.323) (t (211) = 3.363;
P = .001 < .05). However, the PLT, PCT, and MPV values did not show
Group N Ort Ss t p Age AA patient 105 24.971 10.913 −1.668 .097 Healthy control 108 27.454 10.801 WBC (K/µL) AA patient 105 8.459 3.124 3.363 .001 Healthy control 108 7.323 1.582 PLT (K/µL) AA patient 105 269.476 52.780 0.654 .514 Healthy control 108 264.685 54.164 RDW (%) AA patient 105 13.406 0.850 −1.555 .119 Healthy control 108 13.643 1.316 NE (K/µL) AA patient 105 5.065 2.894 2.246 .028 Healthy control 108 4.373 1.358 LY (K/µL) AA patient 105 2.529 0.754 3.072 .003 Healthy control 108 2.246 0.577 NLR AA patient 105 2.177 1.464 0.321 .749 Healthy control 108 2.121 1.073 PLR AA patient 105 114.461 36.027 −1.954 .052 Healthy control 108 129.369 69.636 PCT (%) AA patient 105 0.221 0.039 0.331 .741 Healthy control 108 0.219 0.042 MPV (K/µL) AA patient 105 8.273 0.893 −0.457 .648 Healthy control 108 8.328 0.872 ESR (m/h) AA patient 105 5.676 5.154 −4.559 .000 Healthy control 108 9.213 6.113 CRP (mg/dL) AA patient 105 0.749 1.332 3.496 .001 Healthy control 108 0.297 0.185
Bold values indicate p < 0.05.
TA B L E 3 Average of laboratory
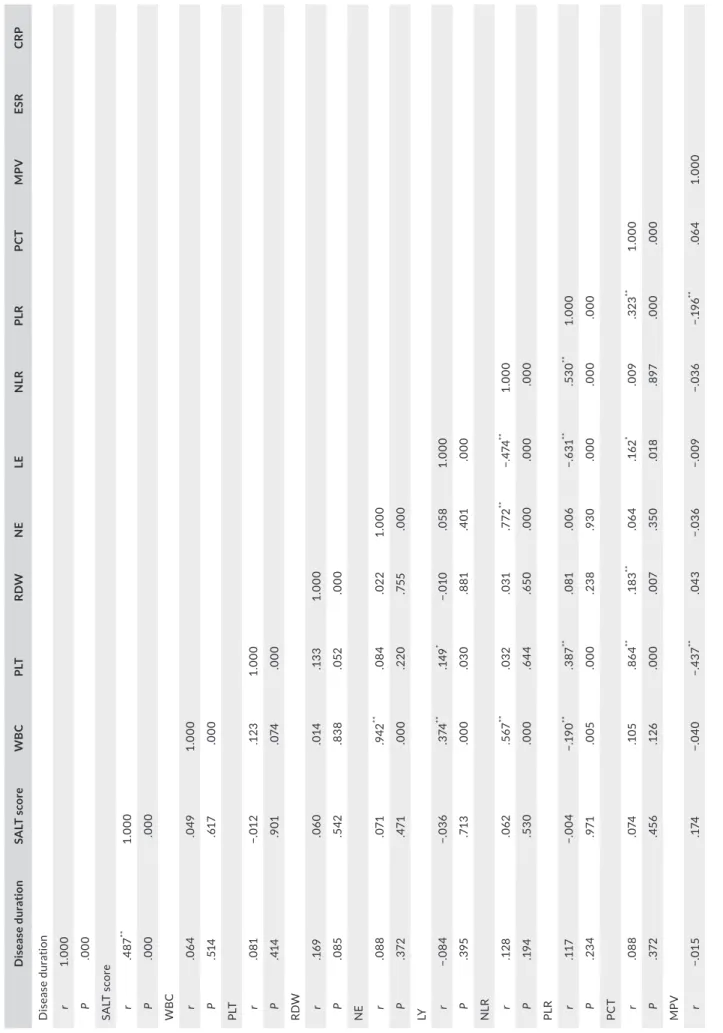
T A B LE 4 Th e c or re la tio n a na ly si s b et w ee n d is ea se d ur at io n, S A LT s co re , a nd p ar am et er s i n A A g ro up D is ea se d ur ati on SA LT s co re WB C PL T RD W N E LE N LR PL R PC T M PV ESR CR P D ise ase d ur at io n r 1. 000 P .000 SA LT s co re r .4 87 ** 1. 000 P .000 .000 W B C r .0 64 .0 49 1. 000 P .51 4 .61 7 .000 PLT r .0 81 −. 01 2 .1 23 1. 000 P .41 4 .9 01 .0 74 .000 RD W r .1 69 .0 60 .0 14 .1 33 1. 000 P .0 85 .5 42 .83 8 .0 52 .000 N E r .0 88 .0 71 .942 ** .0 84 .02 2 1. 000 P .3 72 .47 1 .000 .2 20 .75 5 .000 LY r −. 08 4 −. 03 6 .3 74 ** .14 9 * −. 01 0 .0 58 1. 000 P .3 95 .71 3 .000 .0 30 .8 81 .4 01 .000 N LR r .1 28 .0 62 .5 67 ** .0 32 .0 31 .7 72 ** −. 474 ** 1. 000 P .1 94 .53 0 .000 .6 44 .65 0 .000 .000 .000 PL R r .11 7 −. 00 4 −. 19 0 ** .3 87 ** .0 81 .0 06 −. 63 1 ** .53 0 ** 1. 000 P .23 4 .9 71 .0 05 .000 .23 8 .9 30 .000 .000 .000 PC T r .0 88 .0 74 .1 05 .86 4 ** .1 83 ** .0 64 .1 62 * .0 09 .323 ** 1. 000 P .3 72 .4 56 .1 26 .000 .0 07 .3 50 .0 18 .8 97 .000 .000 MP V r −. 01 5 .1 74 −. 04 0 −. 43 7 ** .0 43 −. 03 6 −. 00 9 −. 03 6 −. 19 6 ** .0 64 1. 000 (Co nt in ue s)
any significant difference between the two groups (t (211 = 0.654;
P = .514 > .05), (t (211) = 0.331; P = .741 > .05), (t (211) = −0.457; P = .648 > .05). Furthermore, we did not detect any significance in
the RDW, NLR, and PLR values (t (211) = −1.555; P = .119 > .05), (t (211) = 0.321; P = .749 > .05), (t (211) = −1.954; P = .052 > .05). We did find that CRP levels were elevated in the AA patients (x̄ = 0.749) relative to the controls (x̄ = 0.297) (t (211) = 3.496; P = .001 < .05). However, ESR was significantly higher in the control group than in the AA group (x̄ = 9.213) (t (211) = −4.559; P = .000 > .05). The labo‐ ratory findings are summarized in Table 3.
There was a significant, positive relationship between the SALT score and disease duration(r = .487; P = .000 < .05). But the rela‐ tionships between the SALT score and the other variables were not statistically significant (P > .05) (Table 4).
4 | DISCUSSION
In this study, we showed that CBC parameters are not significantly higher in patients with AA as compared with healthy controls. However, we did find that the CRP levels of AA patients were signifi‐ cantly raised relative to those of healthy subjects. To the best of our knowledge, this is the first study to show the relationship between the haematological and inflammatory parameters of AA and disease severity.
Alopecia areata is nonscarring hair loss with an uncertain course and a wide spectrum of manifestations.1 Many theories have been
developed about the etiology of AA since its description by Sauvages in 1760.15 The autoimmunity hypothesis won popularity in the
1960sv.16 A genetic predisposition has also been suggested for AA,
similar to other autoimmune diseases.1 Different immune cell lines
including plasmacytoid dendritic cells, natural killer cells and T cells, together with key molecules such as IFNγ, IL‐15, MICA, and NKG2D, have been identified as contributing to the autoimmune process.1
Complete blood count parameters can be calculated easily in routine and low‐cost laboratory tests and provide very import‐ ant markers of systemic inflammation.5 RDW and MPV levels, in
particular, have been examined in recent studies. Proinflammatory cytokines are thought to be accountable for stimulating changes in the erythroid progenitor cells, the erythropoietin, and the RBCs in inflammatory disorders. IL‐1, IL‐6, IL‐10, and TNF‐α are the main cytokines, and systemic increases in these inflammatory markers are suggested to be the reason for elevated RDW levels.16 In a
study conducted by Pancar et al,12 the researchers found lower
levels of RDW but no significant differences in MPV levels in pityri‐ asis rosea. In another study, with cutaneous vasculitis, they found that RDW did not significantly differ between the two groups, but that NLR, CRP, ESR, and WBC were significantly higher in patients with vasculitis than in healthy controls. From this result, the re‐ searchers suggest that blood NLR may be used to predict vasculitis with systemic involvement.17 In tests, with psoriasis, RDW values
showed an increase relative to those of healthy controls.18,19 It was
recently shown that, in a large cohort of unselected outpatients,
D is ea se d ur ati on SA LT s co re WB C PL T RD W N E LE N LR PL R PC T M PV ESR CR P P .8 76 .0 76 .56 0 .000 .53 6 .59 7 .8 97 .6 03 .0 04 .3 52 .000 ESR r .14 6 −. 08 1 −.0 66 .23 8 ** .32 5 ** −. 03 5 −. 08 5 −. 01 3 .1 23 .26 4 ** −. 00 1 1. 000 P .1 38 .41 4 .3 37 .000 .000 .61 2 .2 17 .8 48 .07 3 .000 .9 83 .000 CR P r .0 68 −. 07 1 .1 39 * .0 07 .0 19 .1 62 * −. 07 0 .1 94 ** .0 28 −. 07 2 −. 13 3 .2 29 ** 1. 000 P .49 2 .47 5 .0 43 .9 24 .7 86 .0 18 .3 06 .0 04 .6 86 .29 9 .0 52 .0 01 .000 *< .05 . **< .0 1. T A B LE 4 (Co nti nue d)
RDW is strongly associated with CRP and ESR.20 Vaya et al13 indi‐
cated that there were higher RDW and CRP levels with Behçet's disease than in a group of controls. Studies on MPV have mainly concentrated on psoriasis.6,21
Few dermatological studies have examined NLR and PLR in pa‐ tients with psoriasis. Two of these studies reported a significant in‐ crease in NLR among patients relative to the control subjects.6,22
Other studies have investigated the use of NLR and PLR with diabe‐ tes mellitus, acute coronary syndrome, ulcerative colitis, end‐stage renal disease, tuberculosis, rheumatoid arthritis, cirrhosis, and famil‐ ial mediterranean fever.23,24 In our study, we did not find a signifi‐
cant difference between the NLR and PLR levels of AA patients and healthy control group.
In addition to the others mentioned, PCT has been recognized as a systemic inflammatory response marker. There is no study that considers the relationship between PCT and dermatological diseases. In one study of an inflammatory disease, PCT was signifi‐ cantly elevated in patients with Crohn's disease as compared with to the healthy controls.7 CRP was included in this study as another
marker of systemic inflammation. The CRP levels of the AA patients were significantly higher than those of the control group. Beygi et al25 have reported elevated CRP levels with psoriasis.
There were some limitations to our study. First, this was a ret‐ rospective study and some of the patients’ characteristics, such as their smoking history and dietary habits, were inadequate for evaluating their co‐effects on the PLT indices and other factors. Second, the number of patients and controls was relatively small. Multicenter, prospective studies with a larger sample size should be conducted in future.
In conclusion, we found elevated levels only of CRP in the AA patients. The other haematological parameters were the same as those of the healthy controls, and there was no a correlation be‐ tween the SALT score and the markers. Our results could provide valuable insights into the use of haematological markers for future clinical research into AA.
ACKNOWLEDGMENTS None. CONFLIC T OF INTEREST None. PRESENTATION AT A MEETING None. ORCID
Zeynep Gizem Kaya İslamoğlu https://orcid. org/0000‐0002‐8141‐3186
REFERENCES
1. Darwin E, Hirt PA, Fertig R, Doliner B, Delcanto G, Jimenez JJ. Alopecia areata: review of epidemiology, clinical features, pathogen‐ esis, and new treatment options. Int J Trichology. 2018;10(2):51‐60. 2. Islam N, Leung PS, Huntley AC, et al. The autoimmune basis
of alopecia areata: a comprehensive review. Autoimmun Rev. 2015;14(2):81‐89.
3. Gilhar A, Schrum AG, Etzioni A, et al. Alopecia areata: animal mod‐ els illuminate autoimmune pathogenesis and novel immunothera‐ peutic strategies. Autoimmun Rev. 2016;15(7):726‐735.
4. Atwa MA, Youssef N, Bayoumy NM. T‐helper 17 cytokines (in‐ terleukins 17, 21, 22, and 6, and tumor necrosis factor‐alpha) in patients with alopecia areata: association with clinical type and se‐ verity. Int J Dermatol. 2016;55:666‐672.
5. Hoffmann JJ, Nabbe KC, Van den Broek NM. Effect of age and gender on reference intervals of red blood cell distribution width (RDW) and mean red cell volume (MCV). Clin Chem Lab Med. 2015;53(12):2015‐2019.
6. Asahina A, Kubo N, Umezawa Y, Honda H, Yanaba K, Nakagawa H. Neutrophil‐lymphocyte ratio, platelet‐lymphocyte ratio and mean platelet volume in Japanese patients with psoriasis and psoriatic arthritis: Response to therapy with biologics. J Dermatol. 2017;44(10):1112‐1121.
7. Tang J, Gao X, Zhi M, et al. Plateletcrit: a sensitive biomarker for evaluating disease activity in Crohn's disease with low hs‐CRP. J Dig
Dis. 2015;16(3):118‐124.
8. Akpinar I, Sayin MR, Gursoy YC, et al. Plateletcrit. Herz. 2014;39(1):142‐148.
9. Leithead JA, Rajoriya N, Gunson BK, Ferguson JW. Neutrophil‐to‐ lymphocyte ratio predicts mortality in patients listed for liver trans‐ plantation. Liver Int. 2015;35:502‐509.
10. Işık M, Şahin H, Hüseyin E. New platelet indices as inflammatory parameters for patients with rheumatoid arthritis. Eur J Rheumatol. 2014;4:144‐146.
11. Kridin K, Shihade W, Zelber‐Sagi S. Mean platelet volume in pem‐ phigus vulgaris. Angiology. 2018;69(4):303‐307.
12. Pancar GS, Eyupoglu O. Red cell distribution width and mean platelet volume in patients with pityriasis rosea. J Clin Med Res. 2016;8(6):445‐448.
13. Vayá A, Rivera L, Todolí J, Hernandez JL, Laiz B, Ricart JM. Haematological, biochemical and inflammatory parameters in inac‐ tive Behçet's disease. Its association with red blood cell distribution width. Clin Hemorheol Microcirc. 2014;56(4):319‐324.
14. Olsen EA. Investigative guidelines for alopecia areata. Dermatol
Ther. 2011;24:311‐319.
15. Ikeda T. Produced alopecia areata based on the focal infection the‐ ory and mental motive theory. Dermatology. 1967;134:1‐11. 16. McElwee K, Tobin D, Bystryn JC, et al. Alopecia areata: an autoim‐
mune disease? Exp Dermatol. 1999;8:371‐379.
17. Emiroglu N, Cengiz FP, Bahalı AG, Ozkaya DB, Su O, Onsun N. Red blood cell distribution width and neutrophil‐to‐lympho‐ cyte ratio in patients with cutaneous vasculitis. Ann Clin Lab Sci. 2017;47(2):162‐165.
18. Doğan S, Atakan N. Red blood cell distribution width is a reliable marker of inflammation in plaque psoriasis. Acta Dermatovenerol
Croat. 2017;25(1):26‐31.
19. Kim DS, Shin D, Jee H, et al. Red blood cell distribution width is increased in patients with psoriasis vulgaris: a retrospective study on 261 patients. J Dermatol. 2015;42(6):567‐571.
20. Lippi G, Targher G, Montagnana M, Salvagno GL, Zoppini G, Guidi GC. Relation between red blood cell distribution width and inflam‐ matory biomarkers in a large cohort of unselected outpatients. Arch
21. Kılıç S, Reşorlu H, Işik S, et al. Association between mean platelet volume and disease severity in patients with psoriasis and psoriatic arthritis. Postepy Dermatol Alergol. 2017;34(2):126‐130.
22. Ataseven A, Bilgin AU, Kurtipek GS. The importance of neutro‐ phil lymphocyte ratio in patients with psoriasis. Mater Sociomed. 2014;26:231‐233.
23. Huang W, Huang J, Liu Q, et al. Neutrophil‐lymphocyte ratio is a reliable predictive marker for early‐stage diabetic nephropathy. Clin
Endocrinol. 2014;82:229‐233.
24. Fu H, Qin B, Hu Z, et al. Neutrophil‐ and platelet‐to‐lymphocyte ratios are correlated with disease activity in rheumatoid arthritis.
Clin Lab. 2015;61:269‐273.
25. Beygi S, Lajevardi V, Abedini R. C‐reactive in psoriasis: a review of the literature. J Eur Acad Dermatol Venereol. 2014;28:700‐711.
How to cite this article: İslamoğlu ZGK, Demirbaş A.
Evaluation of complete blood cell and inflammatory
parameters in patients with alopecia areata: Their association with disease severity. J Cosmet Dermatol. 2020;19:1239– 1245.