A CAS£ STUDY : .V.EASUai.^JG SERVIx QUAL’TY C.- A HOTEL USLM3
SERVCUAL y.ETHGD
V ..3 .A . THESIS
e v.Ih e gCl :<а я а в а з а AX:<ARA, Jc-i:££y t £ E 3
A CASE STUDY: MEASURING SERVICE
QUALITY OF A HOTEL USING
SERVQUAL METHOD
A T H E S IS
S u b m itte d T o th e F acu lty o f M an ag em en t a n d th e G ra d u a te S ch o o l of B usiness A d m in is tra tio n
o f B d k e n t U n iv e rsity
in P a rtia l F u lfillm e n t o f th e R eq u irem en ts F o r th e D egree o f
M aster o f B usiness A d m in istra tio n
B y
E m in eg ü l K arab ab a Ja n u ary , 1996
I К е о Ь
HF
5 ΐΗ 5 .$ ·
' IC г ?
I certify th a t I h av e read th is th e sis a n d it is fu lly ad eq u ate, in scope a n d in q u ality , as a th esis fo r th e d eg ree o f M a ste r o f B usiness A d m in istra tio n .
A ssist. P ro f. H . M u ra t M ercan
I certify th a t I h av e read th is th e sis a n d it is fuUy ad eq u ate, in scope a n d in q u ality , as a th esis fo r th e d eg ree o f M a ste r o f B usiness A d m in istra tio n .
I c ertify th a t I h av e read th is th esis a n d it is fu lly ad eq u ate, in scope a n d in q u ality , as a thesis fo r th e d eg ree o f M a ste r o f B usiness Ad m in istra tio n .
A ssoc. P ro f. E rd a l E rel
A p p ro v e d fo r th e G rad u ate S c h o o l o f B u sin ess A d m in istra tio n .
ABSTRACT
A CASE STUDY: M EASURING SERVICE QUALITY OF A HOTEL U SIN G SERVQUAL METHOD
Eminegiil KARABABA M .B.A. Thesis
Supervisor: A ssist. Prof. Dr. H. M urat MERCAN
In this study, service quality o f B ilkent Hotel is m easured. The study starts with the literature survey on the quality and the service quality. The different definitions o f service quality is given and file m ost popular and appreciated one w hich is "satisfying the custom er expectations" is chosen for the analysis.
The differences betw een the service quality and m anufacturing quahty is exam ined and the i difficulty in m easuring service quality is mentioned in this thesis. Then the different m odels on m easuring service quality was searched.
The m odel used is nam ed as SERVQUAL. It is a comprehensive m odel and it not only diagnosed the situation o f the company but offers solutions to the problems. These problem s identified by the mefiiod and obtained by the gap measurements. There are five gaps. These are m easured by some questionnaires which are presented in the appendices.
Keywords: Quality, Service Quality, M easurem ent o f Service Quality, SERVQUAL
ÖZET
SERVQUAL M ETO DUNU KULLANARAK BİR OTELİN HİZMET KALİTESİNİN ÖLÇÜMÜ
Eminegül KARABABA M .B.A. Tezi
Tez Y öneticisi: Yard. Doç. Dr. H. M urat MERCAN
Bu çalışm ada B ilkent O tel'in hizm et kalitesi ölçüldü. Bu çalışma kalite ve hizm et kalitesi ile ilgili kaynak araştum ası üe başladı. D eğişik hizm et kalitesi tam nüan verildi ve en popüler olan tanım: müşterinin beklentilerini karşdam a bu analizde
kullanıldı.
Hizmet kalitesi ve üretim kalitesi arasm daki farklılıklar incelendi ve hizm et kabtesini ölçm enin zorluklarm a değinildi. H izm et kaKtesini ölçmek için bulunan değişik m odeller incelendi.
PBZ' n in m odeli SERVQUAL diye adlandırılıyor. Bu model oldukça etraflı bir m odel ve sadece şirketin durumunu değü, gerekli olan çözüm önerilerimde veriyor. M ethod şirketin problem lerini bir dizi farklılıkları ölçerek belirliyor. Beş değişik farklılık ölçülüyor modelde. Bu farklılıklar methoda özel bir takım
anketlerle ölçülüyor. Bu anketler ekte sunulmuştur.
A nahtar Kelim eler: K alite, Hizmet K alitesi, Hizmet K ahtesinin Ölçülmesi, SERVQUAL
TABLE OF CONTENTS
A BSTR A CT... i
Ö Z E T ... Ü TABLE OF CONTENTS ... üi LIST OF FIG U R ES... v
LIST OF TA B LES... vi
l. INTROD UCTIO N... 1
n . DEFINITION OF QUALITY AND SERVICE Q U A LITY ... 2
2.1. D ifferent M odels for Assessm ent o f Service Q u ality ... 6
2.1.1 The Perception o f Q uahty in a Sociocultural C o n tex t... 9
2T .2. Concept o f Culture and Relation w ith the Service Q u ality ... 10
2.1.3. Techniques for Collecting D a ta ... 14
m . A NEW METHOD - SERV Q U A L... 17
3.1. Gap 1: Customers' Expectations - M anagement's P erceptions... 23
3. 1.1. Antecedents o f Gap 1 ... 24
3.2. Gap 2: M anagement's Perceptions - Service Quahty Specifications G a p ... 25
3.2.1. Antecedents o f Gap 2 ... 26
3.3. Gap 3; Service Q uahty Specifications - Service Dehvery G a p ... 28
3.3.1. Antecedents of Gap 3 ... 28
3.4. Gap 4; service Delivery - External Comimmications G a p ... 30
3.4.1. Antecedents of Gap 4 ... 31
3.5. Gap 5; Customers' Expectations - Perceived Quality Gap... 32
IV. M ETH O D O LO G Y ... 33
4.1. The SERVQUAL Q uestionnaire... 33
4.1.1. Questionnaire for C ustom ers... 33
4.1.2. Questionnaire for E m ployees... 34
V. FINDINGS AND R ESU LTS... 36
5.1. Gap 5 Scores o f the C om pany... ... 36
5.2. Gap 1 Scores o f the C om pany... 38
5.3. Gap 2 Scores o f the C om pany... 40
5.4. Gap 3 Scores o f Bilkent H o te l... 42
5.5. Gap 4 Scores o f Bilkent H o te l... 44
VI. CO N CLU SIO N ... 47
R EFER EN C ES... 49
APPENDIX A ...:... 49
APPENDIX В ... 59
APPENDIX C ... 68
PIQURE 1; i. ГЬ;.· ■' ...12 ^ .. (/■■адііГу &І).: ■ Îb' Ш ' Ή;'" ■
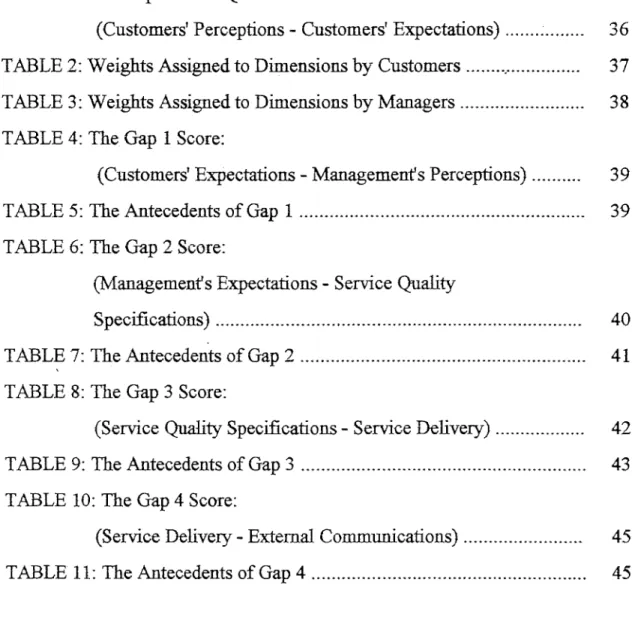
LIST OF TABLES
TABLE 1: The Gap 5 SERVQUAL Score;
(Customers' Perceptions - Customers' E xpectations)... 36 TABLE 2; W eights Assigned to Dim ensions by C ustom ers... 37 TABLE 3: W eights Assigned to Dim ensions by M anagers... 38 TABLE 4: The Gap 1 Score;
(Custom ers' Expectations - M anagem ents P erceptions)... 39 TABLE 5; The Amtecedents o f Gap 1 ... 39 TABLE 6; The Gap 2 Score;
(M anagem ents Expectations - Service Quality
S pecifications)... 40 TABLE 7; The Antecedents o f Gap 2 ... 41 TABLE 8; The Gap 3 Score;
(Service Quality Specifications - Service D elivery)... 42 TABLE 9; The Antecedents o f Gap 3 ... 43 TABLE 10; The Gap 4 Score;
(Service Dehvery - External C om m unications)... 45 TABLE 11; The Antecedents o f Gap 4 ... 45
L INTRODUCTION
In this era o f growing custom er demands for quality o f service, the quality reputation o f an organisation is too precious an asset to leave to chance. Less than satisfactory service within an organization w ill raise operating costs; less than satisfactory service delivered to the custom er w ill hurt revenues. (Scanton and Hagan, 1983).
In Chapter 2 the definition o f quahty and service quahty is given. In addition different methods used in service quality m easurem ent is discussed, such as four field analysis or critical incidents technique.
Third Chapter explains one o f the m ost im portant and comprehensive service quality measurement methods - SERVQUAL. This m ethod is apphed throughout this study in order to measure service quality o f B ilkent Hotel A nkara which is a four star hotel w ith a known reputation.
SERVQUAL defines service quality as ” The extend o f discrepancy betw een customers' expectations or desires and their perceptions". W ith the help o f this definition the gap betw een custom ers' expectations and their perceptions is m easured (Gap 5). The causes o f this gap is also explained by other four gaps. Such as Gap 1 explains the difference betw een customers' expectations and m anagement's perceptions. Gap 2 represents the difference betw een the m anagem enfs perceptions and the service quality specifications. Gap 3 is the service performance gap which shows us how much the quahty specifications
are applied in the com pany. The last gap evaluates the differences between the actual service delivered and the quahty o f the service communicated to the external environm ent In addition this m ethod evaluates the antecedents o f these four gaps and w hat can be done to close diese gaps can also be find.
Although Bilkent H otel is a four star hotel, the m anagers see five star hotels in Ankara as ftieir com petitors. Therefore service quality is an im portant factor for them iu order to survive in this competitive environment. The results o f SERVQUAL w ill be a guideline for them to improve their service quality.
Fourth chapter introduces the SERVQUAL technique and the evaluation o f SERVQUAL siirveys. These surveys were appHed to thirty custom ers o f Bilkent Hotel, aU o f the m anagers in Hotel and tw enty custom er contact personnel. The findings o f this survey is presented in Chapter 5. By the help o f these findmgs it can be concluded that, B ilkent H otel is perform ing w ell but the expectations of the customers are really high. This may be due to the image o f Bilkent name w hich generally corresponds to high quality, expensive and luxury. In addition customers position this company as a five star hotel in their m inds. Therefore their expectations are higher. So, as a last word, w ith a hide effort, the company w ill m eet the expectations o f customers.
II. DEFINITION OF QUALITY A N D SERVICE QUALITY
In the hospitality w orld quality used as a value judgem ent meaning either good or bad. B ut this definition is disastrous as the perception of good or bad changes fi:om person to person and from condition to condition. So, David Garvin identified five m ajor approaches to the definition o f quality (Garvin, 19M)
-The philosophic approach; quality is "innate excellence" which, like beauty, can be understood only through exposure to objects that display its characteristics. -The product based approach; D ifferences in quahty reflect differences in m easurable attributes. This im plies th at m ore or higher o f some attribute is better. -The user based approach; Q uality lies in the eyes o f the beholder. Those goods that best satisfy user needs or w ants are those that consumers regard as having the highest quality.
-The m anufacturing based approach; Q uality is conformance to requirem ents. D eviation from specifications im plies a reduction in quality.
- The value based approach; A quality product is one that provides perform ance at an acceptable price, or conform ance at an acceptable cost.
The m anufacturing quality m odel starts w ith quality o f design where the characteristics o f the product identified by the user. And products designed to m eet the standards which were established for those characteristics. During the production conformance to standards are measured and for the non-standard output products corrective action can be taken. ( King, 1987)
However, service businesses are more difficult to manage, using only a traditional m arketing. In a product business, the product is fairly standardised and sits on the shelf w aiting for the customer to reach for it, pay and leave(Kotler, 1991). In a service business there are more elem ents. Lovelock emphasized differences betw een goods and services (Lovelock, 1991). These differences are;
1. Nature o f the product: A service is not an object or a device Hke a good, but it is a perform ance or an effort. Therefore, m arketing a performance is very different from attem pting to m arket the physical object itseff.
2. Customer involvem ent in the product: Perform ing a service involves assem bling and delivering the output o f a m ix o f physical facilities and mental or physical labour. O ften custom ers are actively involved in helping to create the service product - either by serving themselves (m a fast-food restaurant) or by
co-operating w ith service personnel in setting such as hair saloon, hotels, colleges or hospitals.
3. People as part o f the product: hi high contact services, customers not only come into contact w ith service personnel, they m ay also rub shoulders with other customers. The difference between two service businesses often Hes in the quahty o f employees who dehver the service.
4. Q uality control problem s: M anufactured goods can be checked for conformance w ith quality standards long before they reach the customer. However, when services are consumed as they are produced, final "assembly" m ust take place under real-tim e conditions. As a result, mistakes and shortcomings are harder to cancel. Further variability is introduced by the
presence of service personnel and other customers. These factors make it hard for service organisations to control quality and offer consistent product
5. No inventories for services; Since a serviced is a performance rather than a tangible item that the custom er keeps, it can not be inventoried. The necessary equipm ent, facilities and labour can be held ia readiness to create the service, but tírese simply represent tíre productive capacity, not tíre product itself.
6. Importance o f time factor; M any services are delivered m real time. Customers have to be present to receive service from airhnes, hotels, hospitals and m any other types o f organisations. There are lim its as to how long customers are w illing to be kept w aiting for service to be provided.
7. D ifferent distribution channels; Unlike m anufacturing frm s, which require physical distribution channels for moving goods from factory to customers, service businesses often find them selves responsible for managing customer- contact personnel. They m ay also have to m anage the consumption behaviour o f custom ers who enter tiie service factory to ensure that the operation runs sm oothly. (Sanear, 1993)
The starting point o f any service quahty program is to define and, therefore define and measure service quahty. Service quahty is defined as "giving the custom er what the custom er wants ( a custom er focus)". Another definition o f service quahty made by John Hannock is; a w ay to build enduring relationships w ith customers, w hich m eans that quahty is the means to an end rather than end itself. (Bernhardt, K eher, Schmalense, and Vanecko., 1991).
C ollins Hall Associates defined service quality as; The consistent delivery o f acceptable standards w here acceptable standards are defined as the standards w hich management deems acceptable in the Hght o f the target m arket and w hich represent the product/service to be made available to the customer.
M ichael Nightingale hypothesised m ore o f a consumer perceptive in defining quahty; quahty standards o f services are those which both those responsible for policy making and im plem entation o f such services perceive as the key
dimensions used by custom ers in their evaluation of the services.
M ike Leven who is the Executive Vice President o f American H otels told that; "Service quahty m the hotel industry can be defined as " the perception o f quality" that is in the m ind o f the quest or buyer that m ust be dehvered by the company or unit iuvolved. AS a survival requisite a hotel m ust , in fact , understand the customers' quahty perception and m eet that expectation on a consistent basis to allow for enough repeat business and hence, a profitable undertaking.( Lewis and Booms, 1991).
Professors Berry, Parasuram an, and Ziemthal defines service quahty as customer satisfaction and examiue w hat customers expect, and compare it directly w ith w hat customers perceive they receive, with the difference being defined as satisfaction w ith service quahty. (Bernhardt, et al. 1991)
2A. Different Models for Assessment of Service Quality
M easuring quahty for services is more difficult than for products because services, and the associated m easures, are intangible. Easily m easurable aspects o f service dehvery - such as charges for extra services and num ber o f minutes for
the transaction - may w ell not be the key to service quality as perceived by die custom er. Easily obtainable m arket m easures like m arket share, sales or num ber o f com plaints may not be useful for diagnosing sources o f weaknesses or strengths.
W hen m easuring service quality, it is vital to focus on issues at the right level. Studying reactions to attributes and features m ay be important w hen designing new services or remedying services that are know n to be inadequate, but they are not as im portant in measuring service quality as m easures of benefits or higher order values. For example, ia the case o f John H ancock, the attributes of helpful or especially fiiendly service personnel lead to the benefit o f a customer feeling appreciated by the firm, w hich leads to a greater feeling o f thrust on the part o f the customer. A focus on the benefits or higher order values that customers seek rather than on attributes yields the m ost fundam ental m sights.(Bem hart et al.,
1991).
In the literature on service quality there are lots o f models present to achieve service quality in service sectors. One o f them is by Robert Boothe. He argues that; People working in service industries m ust realise that the desired level o f quality relates to the customers' perceptions, n o t the perceptions o f those who provide the service. A conceptual m odel that em phasises this point is;
Perceived quality = Actual quality - Expected quality
Perceived quality is the customer's feel for the quality o f the service that has been provided. This is a measure o f the customer's satisfaction w ith the quality that is received.
Actual quality is the real level o f quality provided to the custom er. This is quality as seen by the organisation providing the service. Expected quality is the quality that the customer assum es wUl be received when the service is purchased. This expectation often includes both a qualitative and quantitative factor. The custom efs values can be influenced by the service providefs actions. This provides both an opportunity and threat. The challenge from provider's point o f view is threefold:
1. Recognising that custom er expectations can be shaped. This challenge is often overlooked.
2. Identifying the level to w hich expectations can be low ered before potential customers w ill refuse to deal w ith an organisation.
3. Realising that quality can be used as a competitive w eapon but that this w eapon can be backfire. W hile striving to improve the quality, the organisation m ust not promise custom ers more than it can deliver.
W hen the model value is negative; the customer w ill consider changing suppliers, the decision w ill be based on the inferred improvement from negative to a positive value.
In addition the perceived value is greater than or equal to zero suggests that the customer is satisfied and w ould continue to use the current supplier w ithout searching for an alternative. (Boothe, 1990)
Edvardson and G ustavson offered a model for quality assessm ent in service organisations. The concern o f their concept is service quality in term s of developing a m anagem ent oriented m odel for quality assessm ent
A ccording to these researchers; in order to gain an understanding o f w hat service quality is, it is essential to consider die service process not only in die service encounter but also w idiin the company. In this context, the concepts o f internal services and internal custom ers w ould seem extrem ely useM , and high quality in internal service processes is a precondition for high and even external quality is perceived by the customer, often in the long-term interactive customer relationships.
Also they criticise the analyses o f custom er's perception o f service quality as - no consideration is given to the various references the customer m ight have for judging quality in general or in certain more specific categories o f service. The know ledge and theories on consum er perception developed in social psychology have contribution to make the understanding o f how the customer perceives quality. Therefore this body o f knowledge is iocluded in this model for quality assessm ent.
Also in this m odel they require a situation specific approach, in w hich general, or, rather, basic quality determ inants w ould be o f great value in the adempt to understand the situation specific quality factors. And they recommend to take in to account the cost aspects w hen analysing the service quality.
T h e P e rc e p tio n o f Q u a lity in a S o cio cu ltu ral C o n tex t
The authors thought that using theories o f social psychology to describe the situation w ould be more beneficial. It is im portant to widen the firame o f reference determining the custom er's expectations by introducing variables relating him /her to a concrete cultural and sociom aterial structure. Expectations are not form ed in a vacuum but are the direct result o f previous experiences in
sim ilar situations and o f other fram es o f reference w ith w hich all individuals are provided by their social affiliation.
The individuals social environm ent - society and reference groups - determines the value and his or h er experience determ ines his or her perception o f possibilities. The result is that the individual estabhshes a certain level of aspiration in relation to different concrete objects and situation.
A s regards quahty in service production, both in society as a whole and in specific groups w ithin different societies, norms, define good quahty. Therefore, it is vitally important for the individual service producer to offer a service that fiilfils the quality norms the individual customer brings to the service encounter. In a m ore long term perspective num erous opportunities for m utual influence and feedback betw een the various componentsAevels exist.
2,1.2. Concept of Culture and Relation with the Service Quality
Edvardson and Gustavson argues that the quality analysis m ust take into account not only the customer's cultural context but also that in w hich the service organisation operates. Their organisational culture concept is in accord w ith the Schein's. According to Schein culture should be reserved for the deeper level of basic assum ptions and behefs that are shared by mem bers o f an organization, that operate unconsciously and that define m a basic taken for granted fashion an organization's view o f itself and its environm ent
The culture and value structure o f target custom er groups m ust be taken into account when die service com pany develops its m anagerial system. Quality developm ent should be based on a quality oriented organisational culture. QuaHty Culture is a powerful tool in service production, especially when it comes to high
contact face to face services. The important point is that company culture and custom er culture m atch and that the quality culture o f die service company is not rigid but em bodies the ability to adapt to changes in customer culture and values.
The quality o f soft technology, that i s , the sldU training provided for employees, is one w ay to build and develop an organisational quality culture; others are recruitm ent policy and style o f leadership.
Based on the above concepts, m ore concrete restrictions that w ill function as prem ises for the construction o f the analytical model can be established. The follow ing w ould be seem to be valid;
1. An analysis o f quality in a service company m ust be based on a holistic view o f the company and its operational logic.
2. The analysis m ust be m ultidimensional.
3. The m odel m ust be operationalized in the form o f a dialogue w ith representatives o f the company being analysed as each service company is unique.
4. The range and depth o f the analysis ultim ately determines the tools and technique to be used.
The m odel is based on two o f the central dimensions in an organisation. First is the disparity that alw ays exists betw een the organisation and the individuals w ithin the organisation. Second is the basic disparity present in aU social systems betw een idea and action nam ely goal and outcome as mentioned in the model.
The m odel's m ain fields o f analysis are obtained by allowing the two dimensions to intersect at the right angles as shown in F IG U R E 1.
Fonnaí Objective Goa^ B Outcome D Individual Subj»:tive
F IG U R E 1; Four Field A nalysis
Tile four fields o f analysis form ed m ay be described as follows:
1. Formal Goals: In this field die em phasis is on an examination o f die goals form ulated at a form al level w ithin die organisatiorL
2. Subjective Goals: Here the analysis concentrates on reflecting how the various actors w ithin the organisation perceive die organisation's goals.
3. Form al Outcome : The analysis in this field is aimed at gaining insight into die organisation’s activities as revealed by various documents w hich at a form al level indicate the results o f decisions reached, m easures taken and soon.
4. Subjective Outcome: Here the focus is on the relationship betw een the organisation and its customers, that is, on analysing how the latter perceive the quality o f the service offered.
In each, o f the fields, analysis can be based on a set o f central concepts that attem pt to capture the essential nature o f the organisation.. These central concepts are nam ed as auxiliaiy concepte are;
1. M arket segm ent/target group: the specific custom er group for whom the whole service system has been developed.
2. The service concept: The offer made to the customer. This consists o f complex com bination o f values, some more concrete w hile others he on the psychological or em otional plane.
3. The production system: in a service company, this also includes the system for conveying the service to the customer. Components o f this system are; personnel, custom ers, physical environm ent or technology.
4. Image and profiling: the image o f the company held by the individuals and groups involved, and m easures the organisation has taken to alter its image. (Edvardson and Gustavson, 1991) Image is im portant as it is the m ajor factor in shaping the customers' expectations o f a service, and in setting the standards by w hich they w ill evaluate that service. U nfulfilled expectations are a large part of
custom er satisfaction.(iCing, 1987)
5. Culture context: the often tacit assumptions w ithin the organisation that form the envu'omnent in w hich all the decisions controlling the individual's action w ithin the organisation are taken. This apphes to the culfiiral context o f the custom ers as well.
The im portance o f this model is that, it is comprehensive by using the consistency analysis. The m ost significant step here is to discover w heliier any inconsistencies exists w ithin and betw een the fields o f analysis exam ined. In other words, the differences betw een the various pictures one gets o f the service company's activities from an analysis o f the four fields indicate problem areas that, in one w ay or another, m ay have a negative effect on service quality. Therefore this analysis leads to problem identification.
2.1.3. Techniques for Collecting Data
1. Content Analyses: This m ethod is analysing various official documents available such as strategic plans, annual reports, manuals, instructions and etc. This type o f data collection would give an idea about the form al level w ithin the organisation.
2. Available Data: It is the term used for the various em pirical studies o f the organisation and o f ernployees and customers originally carried out for purposes other than the present analysis o f service quality.
3. Survey Techniques: This technique contains interview s, polls and questionnaires. This is the m ost im portant technique to collect inform ation but it should be supported w ith another technique in order to prevent achieving only subjective information.
4. Observational Techniques: This includes the researchers personal observations. It can be either by direct participation or by hidden participation. This type o f analysis is not common in service quality m easures but a recent
technique called critical incidents technique(CIT) has been used for the service quality analysis.(Edvardson and Gustavson, 1991)
C n studies involve in depth interview s w idi customers and focus on specific experiences or encounters in w hich communication w as strained and service quality as difficult to manage. The idea is to generate a complete and detailed story about each consum er-provider interaction. Several individual problem s may be identified w ithin a given story. By producing enough critical incident descriptions, a considerable list o f problem s concerning service encounters and customer-provider interactions can be generated. (Brandt and Reffet, 1991)
5. Experimental Design; This is not another type o f data collection method. This technique uses the other techniques m entioned above. However this technique has the possibility o f using an experim ental construct.
AH the inform ation obtained should be compiled in such a way that the variables in these four fields can be compared. Also the results should be communicated so that everybody in the organisation should participate in the interpretation. And if the results communicated is form ulated as an ongoing feedback process, it w ould be advantageous for achieving long term perm anent changes in service production. (Edvardson and Gustavson, 1991)
There are lots o f methods in service quality measurement but aU o f them has the some idea and this m ethod is one o f the most comprehensive one in the hterature. Unfortunately m ost recent and very popular method has been introduced by Berry, Parasuram an and Zeitham l; SERVQUAL. Their method is also very comprehensive and it has the advantage o f easy quantifying. They not only provide a measurement m ethod but they define the possible problem areas and
recom m end the corrective actions the organisation can take. The next section explains the SERVQUAL m ethod w here Ihe thesis is conducted using this m ethod.
IIL A NEW METHOD - SERVQUAL
Berry, Parasuram an, Zeitfaaml(PBZ) started to make researches on service quality at 1983. They proposed this m odel and through out the years they made some improvements on this m ethod. The subject o f this m odel is based on both research and m anagerial application. The interest o f authors for this research are on three central questions;
1. W hat is service quality?
2. W hat causes service quality problem s?
3. W hat can organisations do to solve these problem s and improve their service?
PBZ studied this model because o f the increasing importance o f service industry in America. Am erica's econom y has become a service economy and organisations compete for some degree on the basis o f service. As the decade o f the 1990's unfolds, more and m ore executives in m anufacturing firms wiU be as keenly interest in service quahty . As m anufacturing executives find it increasm gly (hfificult to establish sustainable, technology based competitive advantages, they wiU direct added attention and resources to value added service as a more true source o f superiority.
The central role for services in A m erican economy is a key factor behind service quality's rising prom inence as an institutional and societal issue. Also a secondary factor behind service quality's rising prom inence is that superior quality is proving to be w inning competitive strategy, some leading firms are obsessed w ith service excellence because service excellence provides them to be
d ifieren t than others. They use service to increase the productivity, to earn custom ers' loyalty, to fan positive w ord o f m outii advertising, to seek some shelter from price competition.
Service excellence is a w in-w in strategy as w ith service excellence, customers, em ployees, m anagem ent stockholders and comm unities win. Therefore coimtry w ins.
PB Z m entioned the role o f leadership in providing excellent service. The m anagem ents ability to commit to service quahty w hich energises and stimulates the organisation in order to improve the perform ance o f service is important. The k ey genuine service leadership at all levels o f an organisation is; leadership tibat offers the direction and inspiration to sustain committed servers. The people in service w ork need,a vision in w hich they can believe an achievement culture that challenges them to be the best they can be, a sense o f team that nurtures and supports them and role models that show them the way. And this is the stuff o f leadership.
PB Z also described the characteristics o f service leaders as follows;
1. Service vision; The service leaders should believe fundamentally that superior service is a winning strategy and it is a m ust to a achieve a competitive advantage. Therefore they should understand that service excellence is a never ending journey not a program.
2. H igh standards: trae service leader must realise that good service may not be good enough to differentiate the organisation from the others. Therefore he should interested in small nuances and details o f service, seehig opportunities in
small actions that com petitors m ight consider trivial. Service leaders should be dynamic in perform ing the service right the first time.
3. "In the field" leadership style: the leaders should be dynamic and lead in the field rather than m anaging fi:om their desks. Personal communication has a significant role in leadership style as this is the best w ay to give shape, substance and credibility to service vision and the best way to learn w hat is going on the field. Also service leaders should try to obtain a clim ate o f team w ork within the organisation.
4. Integrity: They should know the im possibility o f budding a service minded attitude in an organisation whose m anagem ents lacks integrity. Also they should recognise the interconnection betw een the service excellence and employee's
y
pride and understand that employee's pride is shaped in part by their perceptions o f management fairness.
In addition to all tbese above it should be m entioned that in order to obtain profits from im proving service quality, the service im provement should lead to perceived service improvement, quality have to be a profit strategy. Actually improving service in the eyes o f customers is what pays off.
In the short run quality brings increased profits via premium prices. Frank Purdue told that custom ers w ill go out o f their way to buy a superior product, and you can charge them a toll o f the trip. In the long ruiL superior and/or improving relative quality is the more effective way for a business to grow. Quality leads to both m arket expansion and gains in the market. The resulting growing volume means that a superior-quality com petitor gains scale advantages over rivals.
A nother advantage o f quality is that it creates true customers w hich means that custom ers who are glad to select this firm and who w ill use die firm again and sing the firm 's praises to the others(w ord o f mouth).
In order to improve quality investm ent in technology m arketing research, employee training, perform ance m easurem ent rew ard systems and etc. are increased and therefore the costs increase. And the thing that drives the costs down is the m arket share growth. Companies w ith high m arket shares benefit costw ise from scale economies - higher revenues due to high sales volume and premium prices.
PBZ conducted focus group interview s to perform a customer study. They have found how customers view service quality. And th e definition o f service quahty obtained from this study is; the extent o f discrepancy betw een customers' expectations or desires and their perceptions.
The factors influencing the expectations are;
1. W ord o f mouth communication; It is w hat customers hear fiom other custom ers w hich is a potential determ inant o f expectations.
2. Personal needs: This depends on the individual characteristics o f the customer. 3. Past experiences: They demand or expect according to their past experiences. 4. External Communications: This is helpfiil in shaping customers' expectetions by the service providers. Also direct and indirect messages conveyed to custom ers from service firm s are included.
The m ost important conclusion from the focus groups is about the criteria used by customers in judging service quality. The same set o f criteria was essential for all the sectors researched by the focus group interviews. The dhnensions/criteria
o f service quality identified are tangibles, reliability, responsiveness, courtesy, com petence, credibility, security, access, eommumcation and understanding custom ers. These dimensions are not independent o f each other and in some cases they may overlap.(Erim, 1994)
The definitions o f these ten factors are as follow s;
Tangibles; the physical evidence o f the service; physical facilities, appearance o f persom rel; tools or equipm ent used to provide the service; other customers in service facility.
R eliability; consistency o f performance and dependability. The firm honours its prom ises and perform s the service right the first time.
Responsiveness; w illingness to readiness to provide service; tim eliness of service.
Competence; possession o f the required skills and knowledge to perform the service .
A ccess; approachability and ease o f contact.
Courtesy; politeness and respect, consideration for the consumer's property; clean and neat appearance o f public contact personnel.
Communication; keeping customers informed in a language they can understand; listening to customers; educating customers.
Credibility: trustw orthiness, believability; having tiie ciistom er's best interest at heart.
Security: being free from danger, risk or doubt.
Understanding: m aking an effort to understand the custom er's needs; learning the specific requirem ents; providing the individualised attention; recognising the regular customer. (King, 1987)
The various statistical analysis conducted in constructing SERVQUAL, revealed considerable correlation among the item s other than tangibles, responsiveness and reliability. A ll the seven dimensions are consolidated into two dimensions labelled as assurance and empathy. The definition o f assurance is; knowledge and courtesy o f employees and their ability to convey thrust and confidence. And empathy is caring, individualised attention the firm provides its customers.
In the focus group interviews, consistent patterns and common them es emerged from the executive interviews. These comm onalties suggested four key
discrepancies or gaps regarding executive perceptions o f the service quality and the tasks associated w ith serwice dehvery to consumers. Therefore this model is named as gaps model.
PBZ described these gaps as follows
Gap 1: Custom er's expectations - M anagement perceptions gap
Gap 2: M anagem ent's perceptions - Service quality specifications gap Gap 3: Service quahty specifications - Service dehvery gap
Gap 4: Service dehvery - External comm unications gap Gap 5: Custom er's expectations - Perceived service gap
Gap 1: Customers' Expectations ' Management's^Perceptions
Service firm executives m ay not always be com pletely aw are o f w hich characteristics connote high quality to customers. M anagers m ay n o t know about certain service features critical to m eeting customers' desires or even when aware o f such features, they m ay not know w hich levels o f perform ance customers desire along those features.
W hen senior executives w ith the authority and the responsibihty for setting priorities do not fully understand customers' service expectations, they may trigger a chain o f bad decisions and sub optimal resource allocations that result in perceptions o f poor service quality. The upshot is that senior managers' inaccurate understanding o f w hat customers expect and w hat really m atters to them , is likely to result in service dehvery perform ance that is perceived by customers as falling short o f their expectations - Gap 5. Therefore m anagem ent should collect accurate inform ation about customers' expectations - close Gap 1 - to improve the service quality (narrow ing the Gap 5).
The key reasons for the occurrence o f Gap 1 are;
1. Lack o f m arketing research orientation; w hich is evidenced by insufficient m arketing research, inadequate use o f research findings, and lack o f interaction betw een contact personnel and the customers
2. Inadequate upw ard com m unication from contact personnel to m anager
3. Too many levels o f m anagem ent separating contact personnel from top managers
3«1.1. Antecedents of Gap 1
Lack of Marketing Research
a. Problem o f insufficient m arket research; M arketing research is vital for im derstandm g the customers' expectations and perceptions o f the services. If the firm does not collect this inform ation, it wiU have a large Gap 1. So, the firm must have a m arketing research about service quahty issues. For example w hich features are m ost im portant to customers, w hich levels o f features customers expect and the customers' thoughts about the company’s behaviours on the service delivery problems.
b. Problem o f inadequate use o f m arketing research findings: Doing marketing research is not enough since it should be used in a m eaningful way. The misuse o r nonuse o f the data collected can lead to a large gap in understanding customer expectations. The m anagers may be too busy for the current problems and do not read the research reports, or they m ay not know how to interpret the complex d a ta . This results in w idening the gap by not using the available resources.
c. Problem o f lack o f interaction betw een m anagem ent and customers; as the size o f the company increases, the interaction o f m anagers w ith customers decrease and therefore the firsthand inform ation about the customers' ex m anager can take
r
w ould be less. The inform ation fi:om research reports are not enough to see the real situation, h i order to understand the real needs o f customers management should have some form o f customer contact.
3.1«1.2. Inadequate Upward Communication from Contact Personnel to management
A s usually the custom er contact personnel have more inform ation about the custom ers' expectations and the perceptions. Therefore the inform ation possessed by the custom er contact personnel should be conducted to the top management. The top m anagem ent's inform ation resources are customer contact personnel and the non com pany-contact personnel such as retailers or independent insurance companies. W hen these channels are closed, the m anagem ent can not get feedback about the problem s encoimtered in service delivery and the customers' expectations and the change in these expectations.
3A .13« Too Many Levels Between Contact Personnel and Management
A s the num ber o f levels increased betw een the management and the customer contact personnel, the com m unication and understanding betw een them gets lesser. This is due to the positions, as management is the party that sets the standards about the service quality and the customer contact personnel is the party that delivers the service. This causes Gap 1 to widen and can be prevented by lessening the num ber o f levels due to inhibiting the m isinterpretation or lost of inform ation.
33» Gap 2: Management's Perceptions » Service Quality Specifications Gap
U nderstanding customers' expectations has the prior importance for the service quality. Once the m anagers accurately understand the expectations o f the custom ers, they should set some standards for the organisation. M anagement may
not be able to put the system s in place to m atch the customers' expectations. Such factors like resource constraints, short-term profit orientation, m arket conditions, or m anagem ent indifference m ay cause Gap 2 due to the discrepancy betw een the m anagers' perceptions o f ciistom ers' expectations and the actual specifications they establish for service delivery. The major reasons for Gap 2 are as follow s;
1. Inadequate commitment to service quality 2. Lack o f perception o f feasibility
3. Inadequate task standardisation 4. Absence o f goal setting
3*2.1. Antecedents of Gap 2
3.2.1.1. Inadequate Commitment to Service Quality
G enerally firm s concept o f commitment to service quality is committing to quality from the company's own internal, technical perspective. Service quahty for many firm s is m eeting the company's self defined productivity or efficiency standards w hich custom ers do not notice or desire. Some other firms define quality in term s o f advanced technology. However being commit to service quality is som ething m ore then meeting the company's or the competitor's standards. According to the authors managem ent commitment to service quality means providing service that the customer perceives as high quality. W hen m anagers are not committed to the service quality from the customers' point of view, they target resources only to other organisational goals such as sales, profits, m arket shares and etc. They do not establish internal service quahty initiatives and do not see attem pts to improve service quahty lead to better company perform ance.
There m ay be cases in w hich m anagers m ay found that meeting tbe customers' expectations is not feasible and they have nothing to do. However the researches o f PBZ shows that the idea o f perception o f infeasibility is due to the short term, narrow thinking which is far away from thinking creatively and optim istically about customers' needs.
3*2.13. Inadequate Standardisation of Tasks
Standardisation depends on the degree to w hich the tasks perform ed can be standardised. Some o f the executives think that services can not be standardized because customisation is necessary to obtain a high quality service. However this concern leads to indefinite and loose standard setting w ith httle or no m easurem ent or feedback. If services are custom ised for individual customers, specific standards seem more difficult to estabhsh but whatever the degree o f custom isation is, some aspects o f service provisions can be standardised. The standardisation perform ed by either hard or soft technology, reduces Gap 2. The process o f standardisation facihtates goal setting.
3
.2
.I .4
. Absence of Goal SettingThe goals o f the companies should be set according to customers' requirem ents and their expectations. The goals should be specific, accepted by employees and m easured and reviewed w ith appropriate feedback. Also effective goals are
chaUengmg but realistic.
33» Gap 3: Service Quality Spedfications > Service Delivery Gap
The difference betw een service specifications and the actual service delivery is the service perform ance gap (Gap 3). This is due to the incapability o f the employees in perform ing the service at the desired level. M aintaming service quahty depends not only realising customers' expectations and appropriate standards but also on w ork force of people that are able to and wiUing to perform at the specific service quality levels.
The key conceptual factors contributing to Gap 3 are as follows; 1. Role am biguity
2. Role conflict
3. Poor- employee job fit 4. Poor technology jo b fit
5. Inappropriate supervisory control systems 6. Lack o f perceived quality
7. Lack o f team w ork
3»3.1. Antecedents of Gap 3
3»3.1»1. Role Ambiguity
If no training or inform ation is given to the em ployees in order to perform their jobs appropriately, role ambiguity occurs. They unfortunately would not have any idea about w hat is expected from them and how those expectations would be satisfied. They do not have the training or the skills to provide the necessary service to satisfy the customers. Also they generally do not have any idea about performance evaluation and the reward systems. The training is essential to cope
with, the role ambiguity but also there may be lack o f role clarity. In order to close the Gap 3 training m ust be supported by clear m essages about the expectations o f the managers, the appropriateness o f the behaviours o f the employees should be realised by diem selves and feedback is needed to correct the problems.
3.3.1.2. Role Conflict
This occurs when the perception th at employee can not satisfy all the dem ands o f the individuals he must satisfy. This may be due to the too m any custom ers demanding service at the same tim e. Also another cause for the role conflict m ay be the service versus sales dichotom y. Also role overload which m eans having contact w ith too many custom ers m ay cause conflict.
3.3.1.3. Poor Employee Job Fit
This m ay be due to the em ployees' unfit to their positions. The custom er contact personnel is generally less educated and low paid, therefore they m ay have some incapability in providing services such as lack o f language. By having high turnover among the customer contact employees may solve this problem . Also m anagers m ust be very careful in selecting and hiring employees.
3.3.1.4. Poor Technology Job Fit
hn order to have employees perform ing high quahty services, the m anagem ent must provide them appropriate tools and technology. And this w ill increase the employees performance and should have a positive effect in closing the Gap 3.
3.3.1.5. Inappropriate Supervisory Control Systems
G enerally the perform ance o f the customer- contact personnel is measured by their output. And this perform ances are m onitored and rew arded due to company defined goals rather than service quality delivery. How ever the expected level of perform ance diat w as set can be compared by the custom ers' measurement o f performance. And due to this m easurement the team w ould get the bonus.
3.3.1.6. Lack of Perceived Control
Perceived control is the ability to make responses that influence threatening situations and the ability to choose outcomes or goals. The authors argued that as the employees perceives them selves to be in control o f situations, they encounter their jobs, hence less stress and this w ill yield to higher performance. Also perceived control can be low if the rules, procedures, and the culture lim it the contact employees' flexibility io. providing service.
3.3.1.7. Lack of Teamwork
The value o f teamwork is that it brings together the employees and the managers for the same common goal. One aspect o f team w ork is that employees view other employees as customers. Second aspect o f it is that how m uch the employee feels that he is committed and involved in the firm.
3.4. Gap 4: Service D elivery» External Communications Gap
The gap between w hat the firm prom ised and w hat it actually dehvers. Accurate and appropriate company communication is necessary to provide services that
custom ers perceive as high quality. A reason for Gap 4 is that; the company should inform the custom ers o f special quality assurance efforts. M aking the custom ers aw are o f the efforts w hen these custom ers do not have any idea about them , w ould be usefiil in im proving the service quality.. The key conceptual factors contributing to Gap 4 are as follow s;
1. Inadequate H orizontal Com munication 2. Prosperity to Overpromise
3.4.1. Antecedents of Gap 4
3.4.1.!^ Inadequate Horizontal Communication
com m unication betw een different functional departm ents are essential in order to achieve common goals o f the organisation. In situations w here the horizontal com m unication channels are closed, perceived service quality is in jeopardy. The com m unication issue is im portant for the organisations m ore than advertisement. Also if these channels are closed, breaking down these boundaries is diEhcult and tim e consum ing.
3 .4 .I.2 . Propensity to Overpromise
A s the com petition in the service sector increases, firm s feel pressure on them selves, and to beat the com petitors, they overpromise. This raises expectations to an unrealistic levels that lead to more initial business, but it fosterSithe customers' disappointm ent and discourages the repeat business
3.5. Gap 5: Customers' Expectations ^ Perceived Quality
Gap 5 is the quality shortfall perceived by customers aud the shortfalls w ithin the service provider's organization as Gaps 1 through 4. Gap 5 represents the potential discrepancy betw een the expected and the perceived service from the custom er standpomt. Key determ inants o f service expected by customers include w ord o f m outh com m unications, personal needs, past experience, and external communications from the service provider. First Gap 5 is to be m easured by the dimensions o f service quality. A nd in order to diagnose the causes o f the Gap 5, other four gaps should be m easured. After this problem definition step, model recom mends solutions to those problem s.
4,1, T he SERVQUAL Questionnaire
4.1,1, Questionnaire for Customers(App, A)
This questionnaire is to measure Gap 5. It has two sections; an expectations section to understand the expectations o f customers and has 22 statements, and the second section is the perceptions section which is aim ed to m easure customers’ assessment o f a specific service. These statements are evaluated on a seven poiat scale rangiag from strongly disagree (1) to strongly agree (7).
The dim ensions o f the m ethod are m easm ed in this part as follows; F irst four statem ents m easure the tangibles dimension.
Statem ents from five to nine m easures reliability. Statem ents from ten to thirteen are for responsiveness.
The ones that are betw een fourteen and seventeen are for assurance and The rest are for empathy dimension measurement.
The data obtained is converted into perceptions m inus expectations scores for each statem ent. As m entioned earlier, the more the negative is the score, the higher the shortfall in the service quality according to the custom ers.
I V , M E T H O D O L O G Y
T his questionnaire is for the employees working in tiie service providing company. The scores o f Gap 1 first averaged in the five dimensions separately. Then these results are summed up to get the overall score.
G aps 2 through 4 , the em ployees are asked about their perceptions o f the extend o f these gaps. Again a seven point scale is used.
4.1.2.1. Questionnaire for Managers (App. B)
To m easure the potential antecedents o f the Gaps 1 and 2, this part is used. This part is answ ered by the managers. The statem ents betw een 1 and 9 are for Gap 1 and they are classified in them selves as ; Statem ents between one and four is for market research orientation. Statements betw een 5 and 8 are for upward communication and statement 9 is fo r levels o f management. Then the rest of the question are for Gap 2. Statements betw een 10 and 12 are used to m easure management's commitment to service quality, thirteen and fourteen is for the goal setting, fifteen and sixteen is to measure task standardization and the rest is for the perceptions o f the feasibility. Also it should be m entioned that there are negatively worded statements w hich should be rated reversibly.
4.1.2.2. Questionnaire for Customer Contact Personnel (App. Q 4 .1 ♦2. Q u e stio n n a ir e for E m p lo y ees
T his is the last part and used in order to measure the antecedents o f Gaps 3 and 4. The statem ents betw een one and five are for the teamwork concept, six and seven for the em ployee jo b fit, technology jo b fit is measured by the statem ent number eight, statem ents betw een nine and tw elve is to measure the perceived c o n tro l, Supervisory
control system s are measured by tire statements thirteen through fifteen, statements betw een sixteen and eighteen are for the role conflict and the others till tw enty-three are used to measure role ambiguity. The rest o f the questions are for Gap 4 and the ones betw een tw enty-four and tw enty-seven are for horizontal communication and the rest are for propensity over promise.
V , F IN D IN G S A N D R E SU L T S
SERVQUAL siurvey was applied to 30 customers, aU o f the company managers and 20 contact personnel. The data obtaiaed w as analysed to see the five Gaps explaiaed in SERVQUAL method.
5.1. G ap 5 Scores o f th e C o m p an y
Gap 5 is measured in order to see w hat custom ers expect from a hotel service and w hat they have found in Bilkent Hotel. The findings about Gap 5 are presented in TABLE 1.
T A B L E 1: The Gap 5 SERVQUAL Score; (Customers' Perceptions - Customers' Expectations)
DIMENSIONS SERVQUAL SCORE Tangibles -0.75 Rehability -1.41 Responsiveness -1.27 Assurance -0.88 Empathy -1.00 Overall -1.062
The overall score indicates a large gap betw een perceptions and expectations o f the customer. The company perform s relatively well in tangibles dimension
w hich generally indicates physical appearance o f the company. R eliability and responsiveness have large gaps and these are tw o im portant dimensions in the customers eye.
The average w eights given each dimension by the custom ers presented in TABLE 2.
T A B L E 2: W eights Assigned to Dimensions by Custom ers
DIMENSION W EIGHTS (%) Tangibles 20 R ehabüity 27 Responsiveness 19 Assurance 20 Empathy 14 Overall 100
As can easily be seen from the table that the m ost im portant dimension according to customers is Reliability. The others except em pathy have approxim ately same
significance to the customer. The weights associated to each dimension by the
company m anagem ent is given in TABLE 3.
W hen the im portance o f the dimensions com pared betw een customers and managers, it can be easily seen that rehability is the m ost significant one. Customers gives more importance to tangibles and m anagers rank empathy higher according to customers.
T A B L E 3: W eights A ssign ed to D im ensions by Managers
DIM ENSION W EIGHT(%)
Tangibles 13.5 R eliability 30.6 Responsiveness 17.8 A ssurance 20.8 Empathy 17.3 O verall 100
Gap 1 Scores of the Company
Gap 1 occurs due to the difference betw een the expectations o f custom ers and m anagem ents perceptions. The m ost im portant concept in m arketing and quality is to satisfy customers’ expectations. To do this, customers' expectations should be know n by the m anagem ent. This gap according to five different dimensions are given in TABLE 4.
W hen overall score is considered, management is weU in understanding custom ers' expectations. A lthough the overall score is negative, the gap is narrow . Some studies can be conducted to understand the customers' expectations better.
Here, management is perform ed w ell in understanding customers' expectations on tangibles. Here, highest difference is belonging to responsiveness dimension, then assurance and empathy comes.
T A B L E 4 : The Gap 1 Score: (Custom ers' Expectations - Management’s Perceptions)
DIM ENSION SERVQUAL SCORE
Tangibles 0.32 R ehability -0.13 Responsiveness -0.25 A ssurance -0.21 Em pathy -0.22 Overall -0.098
In order to understand the reasons o f Gap 1 and how can it be closed, antecedents o f Gap 1 is found by SERVQUAL survey w hich is presented in TABLE 5.
T A B L E 5: The A ntecedents o f Gap 1
M arketing Research O rientation 6.0 Upw ard Communication 5.5 Levels o f M anagement 6.0
The m ore close the antecedent scores to 7, the less problem occurs in the antecedent. Here, values are relatively close to 7 but again some efforts should be perforaied to close that naiTow gap and obtain a higher quality. The first antecedent explains that some m arket research should be conducted to set a m arketing orientation in the organization ia order to understand customer and satisfy the needs o f them. The experiences o f contact personnel with the customers' should be taken into consideration.
The second an teced en t" U pw ard communication" has the low est score, therefore there are some problem s present in the organization about upward comm unications. The com m unication betw een upper level management and contact personnel should be increased.
The third antecedent shows that there are not much levels present betw een the customer, contact personnel and the top management. But, in order to close that narrow gap die interaction betw een contact personnel and the top management can be increased.
53» Gap 2 Scores of the Company
Gap 2 scores w hich depicts the difference betw een the m anagem ent's perception and the service quality specifications is given at TABLE 6
T A B L E 6: The Gap 2 Score; (M anagement's Expectations - Service Quality Specifications)
DIMENSION SERVQUAL SCORE
Tangibles 6.36 R eliability 6.09 Responsiveness 6.18 Assurance 5.45 Empathy 6.10 Overall 6.04
I f m anagers understand the expectations o f customers, they can set the standards o f the organization better. W hen the dimensions o f Gap 2 are considered such a
picture is seen. The best form al standards are present for tangibles. Reliability, responsiveness and em pathy have somewhat narrow gaps unlike Assurance w hich is an im portant dim ension as tangibles for customers, since their weights are both ranked 20% by custom ers, has the highest gap. The extent o f informality is higher for assurance. A ssurance includes ability o f employees to convey trust and confidence and know ledge o f courtesy o f employees.
It should be m entioned th a t in hotel services tangibles form im portant criteria because hotels ranked (four star or etc.) according to certain tangibles present in i t So, w hat are the reasons o f this Gap and how can they be improved can be determ ined by analyzing antecedents o f Gap 2 w hich were given m TABLE 7.
T A B L E 7î The A ntecedents o f Gap 2
M anagem ents Commitment to
Service Quality 5.15
Goal Setting 5.23
Task Standardisation 4.77 Perception o f Feasibility 5.94
A lthough the overall score o f Gap 2 is 6.04 w hich is not representing a big gap but such antecedents should be taken into account analyzing the reasons.
The antecedents show scores low er than 7, so in order to improve the scores o f Gap 2, these had to be taken into consideration. The m anagem ents commitment to service quality m eans providing service that the customer perceives as high quality. They should establish internal service quahty ioitiatives and should reahse that better company perform ance is a result o f service quality.
G oals setted by the m anagem ent should be according to customers' expectations. These goals should be specific, challengiag, realistic and accepted by employees. Task standardization is seemed to be m ost im portant antecedent for Gap 2 and it can be closed by increasing the use o f hard and soft technology to standardize the service task.
Perception o f feasibility has the highest score (5.94). It explains that; m anagers m ay think that meeting the custom er needs is infeasible, however this type o f m entality is a narrow thinking and short term. The only way to be competitive among competitors, survive and be profitable in the long run is by m eeting custom er perceptions.
5A^ G ap 3 S cores o f B ilk e n t H o tel
Gap 3 is service perform ance gap w hich shows the setted service specifications and die actual service delivery given from Bilkent Hotel. The results determined by die survey are given in TABLE 8.
T A B L E 8: The Gap 3 Score: (Service quality Specifications = Service Delivery)
DIMENSION SERVQUAL SCORE
Tangibles 6 Reliability 6.6 Responsiveness 6.6 Assurance 6.2 Empatiby 7 Overall 6.48
W hen the overall score considered, company is successful in delivering service quality specifications. This gap shows the incapability o f employees in performing the service at the desired level. On the empathy dimension, there is no problem as it has score o f 7 w hich is the highest that can be taken. The important reliability and responsiveness dimensions are also higher. This narrow gap should also be closed and the reasons o f this gap is given in TABLE 9 but here it should be m entioned that the scores o f antecedents are not parallel with the findings o f Gap 3 scores. This may be from errors o f the survey or lim itations of SERVQUAL. The questions asked for determioing the gaps are asked directly and this may cause some biased answers and for each dimension only a statement is used where the reliability o f the answers can not be detected by this melhod.
T A B L E 9: The Antecedents o f Gap 3
Teamwork 6.42
Employee Job Fit 6.45
Technology Job Fit 6.10 Perceived Control 3.95 Supervisory Control Systems 5.13
Role Conflict 4.7
Role Ambiguity 4.96
Tliere is not much problem in teamwork which brings employees and managers together for the same common goal. Also employees fit their positions generally. In order to peiibrm higher quality services, the necessary tools, equipment and technology should be provided to personnel and the score o f 6.10 shows that there is not much problem but improvements can be applied.