Science Teachers’ Beliefs and Attitudes towards the Use of
Interactive Whiteboards in Education*
Ceren ANATÜRK TOMBAK1, Armağan ATEŞKAN2
1 Bilkent University, Ankara- TURKEY
2 Assist. Prof. Dr., Bilkent University, Ankara- TURKEY, ORCID ID: 0000-0001-5648-2385
* This study is a part of M.A. thesis approved by Bilkent University. It is also presented at the 8th International
Computer and Instructional Technologies Symposium
Received: 23.05.2019 Revised: 04.07.2019 Accepted: 11.09.2019
The original language of article is English (v.16, n.3, September 2019, pp.394-414, doi: 10.12973/tused.10290a)
Reference: Anatürk Tombak, C. & Ateşkan, A. (2019). Science Teachers’ Beliefs and Attitudes towars the Use
of Interactive Whiteboards in Education. Journal of Turkish Science Education, 16(3), 394-414.
ABSTRACT
This study aimed to explore the beliefs and attitudes of 36 science teachers (biology, physics and chemistry) in six high schools in Ankara towards the use of Interactive White Boards (IWB). Of these, three teachers from each school were chosen for interview and classroom observations according to their questionnaire results with purposeful sampling method. The results were analyzed with descriptive statistics and qualitative data analysis methods. According to the results, teachers agree that using IWBs facilitate reaching different sources and display them to the whole class immediately. Teachers describe the common use of IWBs as showing visual materials, videos and animations in science classes. The majority of teachers enjoy using the IWB technology and express positive feelings about it. Most teachers state that they follow the advances in educational technology regularly. Since the frequencies are approximately equal, no meaningful difference was found between teachers with different majors on staying current with technology. The findings show that biology and chemistry teachers use IWB more frequently than physics teachers. Although the teachers have positive attitudes towards the use of IWBs, it was seen that most of them do not feel comfortable while using them in the classrooms. The interviews indicate the reason for that as insufficient in-service trainings.
Keywords: Science teacher, interactive whiteboard, belief, attitude.
INTRODUCTION
In the twenty-first century, technology has increasingly been used in education field and especially to support teaching students with different learning characteristics (Sözcü & İpek, 2012). The Welsh Assembly Government in the United Kingdom (UK) stated that every primary school would be provided with one IWB, one computer and one projector (Beauchamp, 2004). After the pilot studies in England, this technology became a focus of interest among other countries in the world. The highest IWB penetration rate (73%) is in
Corresponding author e-mail:[email protected] © ISSN:1304-6020
TÜRK FEN EĞİTİMİ DERGİSİ Yıl 16, Sayı 3, Eylül 2019
Journal of
TURKISH SCIENCE EDUCATION Volume 16, Issue 3, September 2019
England (Liang, Huang & Tsai, 2012; McIntyre- Brown, 2011). Taiwan, Japan, Singapore, Malaysia, China and Russia are all actively advancing the integration of this technology in classroom teaching. The United States of America (USA), Canada and Mexico are also conscious of the importance of using IWBs in classrooms (Liang et al., 2012).
In addition to the other countries, in 2012, as part of a new project, Turkey launched a pilot study on the use of IWBs and tablets in 52 schools across the country. The project known as FATİH (Movement of Enhancing Opportunities and Improving Technology) by the Ministry of National Education (MNE) is among the most significant educational investments of Turkey. The main goal of the project has been to make Information and Communication Technologies (ICT) one of the main instruments of the education process. The project also aims to help teachers and students in classrooms to use these technologies effectively. Thus, it is expected of teachers to help students gain different points of view, create information of their own and be able to keep information through the years, and so, prepare for the future generation from today (MNE, 2012).
Since IWBs are already in use by teachers and students, the questions and studies focus on investigating their beliefs and attitudes towards the effectiveness and integration of the IWBs in the classroom. A considerable amount of studies indicate positive findings about using IWBs in classrooms and also positive effects on learning (Habeeb, 2018; Şen & Ağır, 2014). From a pedagogical perspective it is thought that IWBs facilitate collaborative group working among students (Kennewell & Morgan, 2003; Slay, Siebörger & Hodgkinson-Williams, 2008; Smith, Higgins, Wall & Miller, 2005). As students have an interactive, activity-based learning environment, they want to share their tasks and opinions with other students in the classroom. Another advantage of the IWB is that it is a teaching tool that has high interactivity. According to Murcia and Sheffield (2010), the wealth of the pictures, diagrams and photos, moving objects, annotating information and shown animations on the board enrich this interactivity. During lessons, students especially volunteer to answer questions due to colorful images, shapes and games, so IWBs motivate students and increase teacher-student interaction (Glover, Miller, Averis, & Door, 2005; Murcia & Sheffield, 2010; Smith et al., 2005).
Although most of the studies report positive results for the integration of this technology, there are some conflicts about improving students’ motivation and efficacy of usage. For example, it is thought that teachers do not have adequate training to use IWBs to their full potential (Marín-Diaza, Figueroa-Floresb & Varoa, 2017; Samsonova, 2019). Also, some of the students find them difficult to operate (Çoklar & Tercan, 2014; Smith et al., 2005). Other problems are stated by the teachers are in relation to the usage of the board and the long time needed for preparation before the lesson. On sunny days, the teacher’s shadow may fall on the screen during the writing process, so some of the students have difficulty in seeing the board clearly and also the sound that comes from the board marker disrupts students’ concentration during the lesson (Çoklar & Tercan, 2014; Erduran & Tataroğlu, 2009).
Computer facilities such as wireless internet, multimedia devices and applications such as IWBs have started to enhance teaching and learning processes (Dinçer, 2015; Mathews-Aydınlı & Elaziz, 2010; Nafidi, Alami, Zaki, El Batri, & Afkar, 2018). Even if education with modern technological tools has started to replace the traditional classroom techniques, this evolution has raised a lot of questions and speculations along.
Like many countries around the world, IWBs became fashionable classroom tools in Turkey in the scope of the FATİH Project. Although a considerable amount of studies have emphasized positive attitudes towards the use of IWBs in classrooms, the differences in the education background of the country, pre-service trainings, and technological infrastructures of the schools may cause diverse outcomes. According to Abuhmaid (2014), several factors
including teacher trainings, support of the school principals, adequate infrastructure, and mentoring are believed to be facilitating factors for the effective utilization of IWBs by teachers in the classrooms. Supporting the importance of the pre-service trainings, The European Commission (2013) states that, teachers’ confidence in using ICT can be as important as their technical competence, because confidence levels have an influence on the frequency of utilisation of ICT based activities.
In 2015, Ormanci, Cepni, Deveci and Aydin conducted researches about thematic review of IWB use in science education. According to their findings, the researchers carried out studies about IWBs because of gaps in the literature. The studies are done regarding the effects of IWBs on student academic success, learning outcomes, users’ experiences. They also highlighted the need of more studies about use of IWBs focusing on science education.
Thus, by considering all of these issues, it is apparent that the utilisation of IWBs can vary in different countries and also educational technological background is a factor. Since this technology is new in Turkey, the literature has some lacking points in terms of teachers’ acceptance of the IWBs in Turkey. In addition, there are limited studies about science teachers’ acceptance towards this technology.
The aims of this study are to explore high school science teachers’ beliefs and attitudes towards the use of IWBs in science classes, to investigate particular IWB usage differences among three disciplines of science teachers (physics, chemistry and biology) from each school, and, to find out the contributions of IWBs to particular teaching processes of the high school science teachers’ teaching processes.
METHODS
The study utilized a mixed-methods approach with an embedded design. At the beginning of the study, the attitudes of the high school science teachers towards the use of IWBs were measured quantitatively with a questionnaire. This quantitative data was supplemented by qualitative data which consisted of classroom observations and interviews with the teachers. Observations of each class (physics, chemistry and biology) were used in order to explore IWB usage processes and differences among these teachers. Interviews with science teachers of each discipline (physics, chemistry and biology) were conducted to understand the contribution of IWBs to particular teaching processes and the main differences among subject area teachers towards the use of IWBs.
a) Participants
This study was conducted at six high schools in Ankara. Science teachers (biology, physics and chemistry) from each of the six high schools were selected. The total number of subjects in the sample was 46, but only 36 of the teachers were willing to fill the questionnaire. This means 78.2% of the teachers participated in the study. Of these, three teachers from each school were chosen by considering their questionnaire results with purposeful sampling method. Thus, with two exclusions, 16 of the teachers were interviewed and observed in the classroom.
b) Instruments
The instruments of the research consist of; questionnaire, interview, and classroom observation.
Questionnaire
In this research, a questionnaire was used in order to explore high school teachers’ beliefs and attitudes towards the use of IWBs. The original questionnaire was developed by Mathews-Aydınlı and Elaziz (2010) to investigate attitudes of teachers towards the use of
IWBs in English as Foreign Language (EFL) classrooms. The questionnaire was adapted for the science teachers by making the necessary pronoun changes. Specifically, the adaptation was done by replacing “English” word with “science” in item 12, 13 and 15.
The questionnaire includes a five-point Likert-type scale, open-ended and multiple-choice items. A reliability check with Cronbach’s Alpha resulted in the score of .78 (Mathews-Aydınlı & Elaziz, 2010). Since the questionnaire was adapted for current study with some changes, reliability was rechecked with Cronbach’s Alpha and resulted in the score of .84. In addition, to improve the questionnaire, a pilot study was conducted in one of the high schools in Ankara with nine science teachers.
Below, Table 1 shows the distribution of the questionnaire’s items and their dimensions. There are a total of 22 items in the questionnaire which consists of six dimensions: attitudes related to IWBs as a teaching tool (9 items), positive attitudes towards the use of IWBs (5 items), negative attitudes towards the use of IWBs (5 items), attitudes towards teacher training (2 items), the usage of IWBs in science classes (5 items) and the frequency of using IWB (1 item).
Table 1. Questionnaire questions and dimensions
Dimensions Questionnaire questions
Attitudes related to IWBs as a teaching tool 1,2,3,4,5,6,7,8,9 Positive attitudes towards the use of IWBs 10,12,17, 21, 22 Negative attitudes towards the use of IWBs 11,13,14,15,16,
Attitudes towards teacher training 18,19
The usage of IWBs in science classes 2,3,4,9,20
The frequency of using IWB 6
Interview
In order to explore the attitudes of science teachers towards the use of IWBs and providing further insight, a semi-structured interview protocol (Harrell & Bradley, 2009) was used. The questions in the protocol were adapted from the interview questions of Mathews-Aydınlı and Elaziz (2010). There were 14 open-ended questions in total, which covered exploring teachers’ opinions about the benefits of IWBs, the most common problems about using IWBs and general background information about the teachers. The interviews were conducted with three of the science teachers from each school. Two of the teachers chose not to participate in the interviews and lesson observations. Therefore 16 out of 18 teachers participated in the interviews. The interviews were held in Turkish, and participants’ responses were recorded on a voice recorder. In data analysis process, all answers were translated to English by the researcher.
Observation
In addition to the interview questions, quantitative data was supplemented by observations of the three science classrooms (biology, physics and chemistry) from each school. An observation chart was developed after a literature review and partially adapted from Altınçelik (2009). The questions in the chart basically focused on teachers’ common uses of the IWBs in science classes and their common problems related to IWB use. Also, there was an independent part with a sketch of the classroom that includes the location of the IWB.
c) Data Analysis
Quantitative data analysis
All of the items in the questionnaires were analyzed comparatively with descriptive statistics using the Statistical Package for Social Sciences (SPSS, v.15.0). All the Likert-scale
items consisted of a five-point scale: strongly agree (5), agree (4) no idea (3), disagree (2), and strongly disagree (1). While calculating means and standard deviations, the option “No idea” was excluded from the variables in order to investigate only the degree of actual agreement and disagreement among the participants. Since the descriptive analysis method was used for data analysis, means, frequencies and percentages were used to represent the data.
Qualitative data analysis
Qualitative data examined in the research was gathered from the semi-structured interviews and observations. Grich (2013) indicates that two stages are needed for analysis of interview or observational data; the first stage is the transcription and the second is the preliminary analysis of the data. To follow these steps, gathered data was grouped according to conceptual framework, research questions or key variables and provided in a proper display format. Miles and Huberman (1994) defined this procedure as coding for analysis.
At this stage of the study, responses from the interview section were transcribed to begin the data analysis. A structured coding system was created by considering the meanings of the responses and actions of the teachers. To keep teachers’ personal data confidential, numbers were given as a code to each interviewee. Interviews were analyzed after categorizing the common responses with the help of color codes, and under sub-categories. For analyzing classroom observations, a checklist which contained all the gathered data from observation charts was prepared. The data in the observation charts were grouped according to common features and categories. Then, all data which derived from interviews and observations were categorized by considering research questions. Thus, this allowed the researchers to analyze the qualitative data from two different perspectives.
FINDINGS
The results were obtained from the analysis of data, which were related to science teachers’ attitudes towards using IWBs, usage in the science classrooms, differences among disciplines, and contributions of IWBs to particular teaching processes.
a) Attitudes of high school science teachers towards the use of IWBs
Attitudes of high school science teachers towards the use of IWBs were categorized into four sub-sections:
Teachers’ attitudes towards IWBs as a teaching tool Teachers’ positive attitudes towards the use of IWBs Teachers’ negative attitudes towards the use of IWBs Teacher attitudes towards training programs about IWBs
Teachers’ attitudes towards IWBs as a teaching tool
Teachers’ attitudes towards the use of IWBs as teaching tools were investigated with nine questions (1, 2, 3, 4, 5, 6, 7, 8, and 9) of the questionnaire.
Table 2. Teachers' attitudes towards IWB as a teaching tool
SD D NI A SA Mean SD Q1 f % 0 0 8 22.2 7 19.4 12 33.3 9 25.0 3.61 1.103 Q2 f % 4 11.4 12 34.3 6 17.1 9 25.7 4 11.4 2.91 1.245 Q3 f % 1 2.8 2 5.6 1 2.8 15 41.7 17 47.2 4.25 0.96 Q4 f % 1 2.8 6 16.7 5 13.9 18 50.0 6 16.7 3.61 1.050 Q5 f 2 4 4 15 11 3.81 1.167
% 5.6 11.1 11.1 41.7 30.6 Q6 f % 4 11.4 9 25.7 10 28.6 11 31.4 1 2.9 2.89 1.078 Q7 f % 0 0 6 16.7 1 2.8 19 52.8 10 27.8 3.92 0.996 Q8 f % 3 8.3 12 33.3 3 8.3 13 36.1 5 13.9 3.14 1.268 Q9 f % 0 0 3 8.3 3 8.3 21 58.3 9 25.0 4.00 0.828
Note: f: Frequency SD: Strongly disagree (1) D: Disagree (2) NI: No idea (3) A: Agree (4) SA: Strongly agree (5)
SD: Standard Deviation
Q1: Using the IWB resources reduces the time I spend writing on the board.
Q2: When using IWBs in the classroom, I spend more time for the preparation of the lesson.
Q3: I think using IWBs makes it easier to reach different sources and display them to the whole class immediately.
Q4: IWBs are beneficial for saving and printing the materials generated during the lesson. Q5: I can give explanations more effectively with the use of IWBs.
Q6: With the help of the IWB, I can easily control the whole class. Q7: I think IWBs can be a good supplement to support teaching. Q8: Using IWBs makes me a more efficient teacher.
Q9: Using IWBs makes it easier for a teacher to review, re-explain, and summarize a subject.
According to mean scores given in Table 2, teachers agree with most of the statements in the questionnaire. The highest mean score belongs to question three, approximately 88.9% (N=32) of the teachers think that IWBs make it easier to reach different sources and display them to the whole class immediately. The second highest mean score belongs to question nine, 83.3% (N=30) of the teachers think that using IWBs make it easier for teachers to review, re-explain, and summarize. Regarding the first question, 58.3% (N=21) of the teachers think that using the IWB resources reduce the time they spend writing on the board. For the second question, 37.1% (N=13) of the teachers reveal that when they use IWBs in the classroom, they spend more time for the preparation of the lesson. Regarding the results of fourth question, 66.7% (N=24) of the teachers agree that IWBs are beneficial for saving and printing the materials generated during the lesson. Looking at the responses to the fifth question, 72.3% (N=26) of the teachers agree that they can give explanations more effectively with the use of IWBs.
The sixth question has the lowest mean score in this category (M=2.89). 37.1% (N=13) of the teachers disagree that with the help of using the IWB, they can easily control the whole class, while 28.6% (N=10) of the teachers indicate that they have no idea about this statement. For the seventh question, 80.6% (N=29) of the teachers indicate that IWBs can be a good supplement to support teaching. Furthermore, looking at the responses to the eighth question, 50% (N= 18) of the teachers agree that using IWBs makes them more efficient teachers.
Teachers’ positive attitudes towards the use of IWBs
Teachers’ positive attitudes related to the use of IWBs were investigated with 10th and 12th questions in the questionnaire and implicitly investigated with 12th and 13th interview questions.
Table 3. Teachers' positive attitudes towards the use of IWBs
SD D NI A SA Mean SD Q10 F % 0 0 1 2.8 8 22.2 19 52.8 7 25.0 3.91 0.742 Q12 F % 0 1 2.9 7 20.0 23 65.7 4 11.4 3.86 0.648
Note: f: Frequency SD: Strongly disagree (1) D: Disagree (2) NI: No idea (3) A: Agree (4) SA: Strongly agree (5)
SD: Standard Deviation
Q10: I like using IWB technology in my lessons.
Q12: I have positive attitudes towards the use of IWBs in science lessons.
The mean scores of the 10th (M=3.91) and 12th question (M=3.86) indicate that teachers agree with 10th and 12th questions. 77.8% (N= 26) of the teachers agreed that they like using IWB technology in their lessons. The responses given for 12th question show that, 77.1% (N=27) of the teachers have positive attitudes towards the use of IWBs in science lessons. There is only one participant who disagreed with 10th and 12th questions each.
Interviews were carried out with 16 teachers out of 18. The participants were asked two questions (12 and 13) which were implicitly related with positive attitudes towards using IWBs in science classes. 12th question was about whether they would recommend this technology to their colleagues or not. 87.5% (N=14) of the teachers indicated that they would recommend this technology to the other teachers. Two of the reflections which were recorded during interviews with Teacher 5 and Teacher 12 are as follows: Teacher 5 states that; “I definitely recommend this technology to my colleagues because visual learning is really essential in science education”. Teacher 12 states that: “I recommend this technology to my colleagues who are in different schools. In this school, since the school is exam-oriented, IWBs have the secondary importance. But for other schools which are in rural areas, this technology is really essential”.
13th question was related to teachers’ opinions about using IWB technology immediately in all of the schools in Turkey. 81.25% (N=13) of the teachers reflected that IWB technology in classrooms should become more common all-around Turkey. The ideas of the teachers who gave the negative responses to these two interview questions (12 and 13) are given in the following section.
Teachers’ negative attitudes towards the use of IWBs
Negative attitudes of teachers about the use of IWBs were investigated with 11th, 13th, 14th and 16th questions in the questionnaire and 12th and 13th questions in the interview.
Table 4. Teachers' negative attitudes towards the use of IWBs
SD D NI A SA Mean SD Q11 F % 2 5.6 4 11.1 3 8.3 18 50.0 9 25.0 3.61 1.103 Q13 F % 13 36.1 18 50.0 4 11.1 1 2.8 0 0 2.09 1,245 Q14 F % 12 33.3 15 41.7 3 8.3 5 13.9 1 2.8 0.75 0.96 Q16 F % 6 16.7 12 33.3 8 22.2 7 19.4 3 8.3 1.39 1.050
Note: f: Frequency SD: Strongly disagrees (1) D: Disagree (2) NI: No idea (3) A: Agree (4) SA: Strongly agree (5)
SD: Standard Deviation
Q11: I feel uncomfortable in front of my students while using IWB. Q13: I have negative attitudes towards the use of IWBs in science classes. Q14: I do not think my students are ready for this technology.
Q16: I am not the type to do well with IWB-based applications.
The result of the 11th question reveals that 75% (N=27) of the teachers feel uncomfortable in front of their students while using IWB. Considering the responses to the 13th question in this section, 2.8 % (N=1) of the teachers had negative attitudes towards the
use of IWBs in science classes. According to the responses to the 14th question, 16.7% (N=6) of the teachers think their students are not ready for this technology yet. Looking at the responses given for the 16th question, 27.7% (N=10) of the teachers think that they are not a good example for doing well with IWB-based applications.
12th question from interviews was whether they would recommend this technology to their colleagues or not. 12.5% (N=2) of the teachers indicated that they did not recommend this technology to their colleagues. Teacher 15 supported his idea with the argument of “The priority could be for basic needs instead of such kind of costly technology.” 13th question was related to teachers’ opinions about using IWB immediately around all schools in Turkey. 6.25% (N=1) of them stated that he/she did not support this technology to become widespread in schools. Teacher 2 states that “There are some infrastructure problems related to internet connection. Also, teacher trainings are not sufficient. If IWB technology is to become more common, these problems should be solved”.
Teacher attitudes towards training programs about IWBs
Teachers’ views related to teacher training about IWBs were directly investigated with 18th and 19th questions in the questionnaire and with sixth interview question.
Table 5. Teachers' views related to teacher training
SD D NI A SA Mean SD Q18 f % 3 8.3 4 11.1 2 5.6 15 41.7 12 33.3 3.81 1.261 Q19 f % 0 0 7 20.0 12 34.3 12 34.3 4 11.4 3.37 0.942
Note: f: Frequency SD: Strongly disagrees (1) D: Disagree (2) NI: No idea (3) A: Agree (4) SA: Strongly agree (5)
SD: Standard Deviation
Q18: I believe that training is required to teach with IWB technology.
Q19: If I do not get sufficient training, I do not feel comfortable using IWBs in the classroom.
According to the data from table 5, the results of the 18th question reveals that 75% (N= 27) of the teachers think that training is required to teach with IWB technology. Looking at the responses to the 19th question, 45.7% (N=16) of the teachers stated that they do not feel comfortable using IWBs in classrooms for the reason that they think their training is not sufficient.
Sixth question in interview aimed to investigate how teachers learned to use IWBs. The responses for this question showed that, 93.75% (N= 15) of the teachers learned to use IWBs in the teacher training program which was implemented in the scope of FATİH Project. On the other hand, Teacher 3 states that “I learned to use IWBs while I was practicing in the classroom. I had taken the thirty-hour training program, but it was not satisfactory”.
Since the interview was semi-structured, the researcher asked other questions which were related to the hours and sufficiency of the training. Only three of the teachers out of 16 stated that the teacher training was sufficient. Teacher 5 states that “We learned in the training, but it was not sufficient. We developed our skills about the IWBs as we were using it in the classroom, as we gained experience”. Another view is stated by Teacher 9: “I am not confident with using IWBs in the classroom. We learned what we can do with IWBs in in-service trainings but we did not learn how we can practice these”.
b) Use of IWBs in high school science classes
This section is categorized into two sub-sections: Teachers’ common uses of IWBs in science classes
Teachers’ common uses of IWBs in science classes
In this section, data were provided by questionnaires, interviews and classroom observations to investigate teachers’ common uses of IWBs in science classes. At the beginning, responses to the questions three, four and nine in the questionnaire were analyzed descriptively. The results obtained from the analysis of the questionnaires are presented in Table 6.
Table 6. The usage of the IWBs as a teaching tool in science classes
SD D NI A SA Mean SD Q3 f % 1 2.8 2 5.6 1 2.8 15 41.7 17 47.2 4.25 0.96 7 Q4 f % 1 2.8 6 16.7 5 13.9 18 50.0 6 16.7 3.61 1.050 Q9 f % 0 0 3 8.3 3 8.3 21 58.3 9 25.0 4.00 0.828
Note: f: Frequency SD: Strongly disagree (1) D: Disagree (2) NI: No idea (3) A: Agree (4) SA: Strongly agree (5)
SD: Standard Deviation
Q3: I think using IWBs makes it easier to reach different sources and display them to the whole class immediately.
Q4: IWBs are beneficial for they allow saving and printing of the materials generated during the lesson. Q9: Using IWBs make it easier for a teacher to review, re-explain, and summarize the subject.
Based on the results of question 3 on Table 6, 88.9% (N=32) of the teachers think that using IWBs make it easier to reach different sources and display them to the whole class immediately. The results of the fourth question in the questionnaire reveals that 66.7% (N=24) of the teachers thought IWBs are beneficial in a way to allow the teacher to save and print the materials generated during the lesson. For question 9, 83.3% (N=30) of the teachers think that using IWBs makes it easier for a teacher to review, re-explain, and summarize the subject.
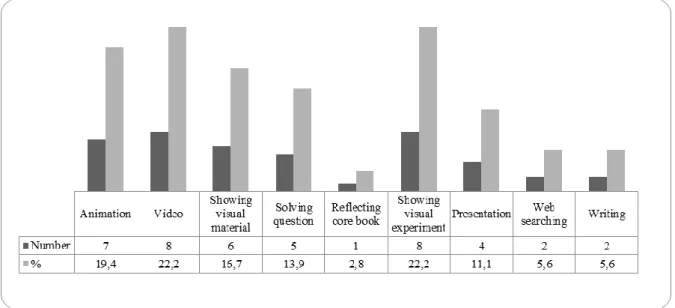
The responses to interview question 9 provided detailed information in terms of understanding teachers’ common uses of IWBs in science classes. The responses to the question 5 are presented in the Figure 1.
As seen in Figure 1, teachers state the common uses of IWBs in science classes as showing visual materials, videos and animations. 19.4% (N=7) of the teachers show animations via IWBs during classes. 22.2% (N=8) of the teachers use IWBs for showing videos in the lessons. Also, teachers who use the IWBs for showing visual experiments account for 22.2% (N=8) of the total participants of interviews.
The usage of IWBs for writing, presentation and web searching is not as common as showing visual materials during classes. While 5.6% (N=2) of the teachers use IWBs for writing on the board, 5.6% (N=2) of them use IWBs for web searching during the classes. 11.1% (N=4) of the teachers use IWBs for presentations during classes. Also, there is only one teacher who prefers to use the IWB for reflecting the textbooks on the board.
In order to see the common uses of IWBs in science classrooms and to discover the problems related to this technology, the researcher also conducted observations of 16 different classes in which IWBs were used. The results of the observations are given in Table 7 according to teachers’ subject areas.
Table 7. Basic functions of IWBs as a teaching tool in science classrooms
Basic functions of IWBs Total %
Teacher highlights a text or passage with different color. 1 6.25
Teacher uses her/his finger to draw or highlight something on the IWB screen. 8 50
Teacher searches for something on the Internet. 6 37.50
Teacher uses a specific software program during class. 10 62.50
Teacher uses the drag and drop function of IWB. 10 62.50
Teacher plays audio and video files. 3 18.75
Teacher writes on the board by using stylus pen. 2 12.50
Teacher navigates the texts and images from the board screen, not from the desktop or laptop computer.
11 68.75
Teacher uses the function of screen curtain. 11 68.75
As given in Table 7, 68.75% (N=11) of teachers navigate the texts and images from the board screen, not from the desktop or laptop computer. Also 68.75% (N=11) of them use the screen curtain features. Another common function is used by 10 of the teachers (62.50%) is the drag and drop function of IWB. It is observed in the classroom that 62.50% (N=10) of the teachers use a specific software program during classes. Also 50% (N=8) of them use their fingers for underlying or emphasizing something on the board (see Figure 4). 37.50% (N=6) of the teachers use IWBs for web searching during classes. Only 18.75% (N=3) of the teachers play audio and/or video files. The number of teachers who highlight a text or passage with different color is just one (6.25%) and this function has the lowest percentage.
c) Teachers’ common problems which are related to IWBs
Teachers’ commons problem while using IWBs during classes were investigated with interview question 14.
Table 8. The common problems which is related to IWBs
Common Problems which is related to IWBs f %
Not being able to see the things displayed on the IWB screen because of sunlight
1 6.2
Calibration settings and touch screen properties are damaged frequently 6 37.5
Students use the board out of intended purpose so IWBs are frequently damaged 6 37.5
Web connection is not sufficient 5 31.2
Causing behaviour problems like the disruption of students’ attention 3 18.7
Teacher needs a lot of time to prepare the materials 1 6.2
Discomfort in the eyes of teachers and students after extended interactions with the IWB and headaches
2 12.5
Teachers concern about the amount of radiation from IWBs 4 25
In-service training was unsatisfactory 10 62.5
Teachers need to become confident users, but they think students are better about technology
5 31.2
Note: f: Frequency
Based on the scores in Table 8, 6.2% (N= 1) of the teachers state that sometimes, it is not possible to see the things displayed on the IWB screen because of sunlight. The teachers who think calibration settings and touch screen properties are damaged frequently make up 37.5% (N=6) of the total participants. The reason for this was explained by Teacher 10: “Since there are both chalk boards and IWBs in the classroom, the dust from the chalk boards damage the calibration property of the IWBs. The dust harms the touchscreen. Web connection is constantly slow so we cannot watch the videos. I use the teaching resources which I got used to while using old-fashioned projectors. Students use the board out of intended purpose, for listening to music at the break times. This also damages the calibration of IWBs. Lastly, during the in-service training, it was told that there would be tablet and IWB connection in the class. But it did not happen”.
Just like Teacher 10, 37.5% (N=6) of the teachers state that since students use the board out of purpose thus IWBs frequently break down. 31.2% (N=5) of the teachers think that web connection is not sufficient. Besides, 31.2% (N=5) of the teachers agree that EBA is not updated regularly with new resources. 18.7% (N=3) of the teachers agree that IWBs cause behavior problems like attention deficiency. Also, some of the teachers indicated that this situation may be originated from teachers turning their back to the classroom while writing on the IWB (see Figure 4). At the point of students’ health, 12.25% (N=2) of the teachers think that students’ eyes get tired when they continually look at the IWB screen and that the students suffer from headaches. In addition to these, 25% (N=4) of them were worried about the amount of radiation from IWBs. Teacher 4 states that “IWBs damage the interaction between us and the students contrary to common belief. Students’ attention is disrupted regularly. They suffer from headaches, so I bought a radiation protector, but it did not work. Our eyes get tired after we continually look at the screen. I tried to solve this problem by changing the color of the screen frequently. Using IWBs for every topic is meaningless, they are not proper for every topic. The preparation time for each lesson and searching for the materials take much more time than expected”.
Teachers who think in-service training was unsatisfactory make up 62.5% (N=10) of total interviewees. For the reason that 31.2% (N=5) of them think that students are better about using technology. Teacher 13 states that “I am the guidance teacher of this school about IWB technology. According to my views, meeting with immense technology at younger ages may cause problems in terms of children’s health for the future. But at the same time, our students install programs and stay current with the technology very well. They are well-informed and are like the masters of the technology. Also, as another problem, tablets become a kind of play tool for students. The connection between the IWB and tablets of which we were told never came to life”.
d) Differences among high school science teachers’ attitudes (physics, chemistry, biology) towards the use of IWBs
In this section, differences among high school science teachers’ attitudes (physics, chemistry, biology) towards the use of IWBs are categorized under two sub-sections:
The frequency of using IWBs
Staying current with educational technology
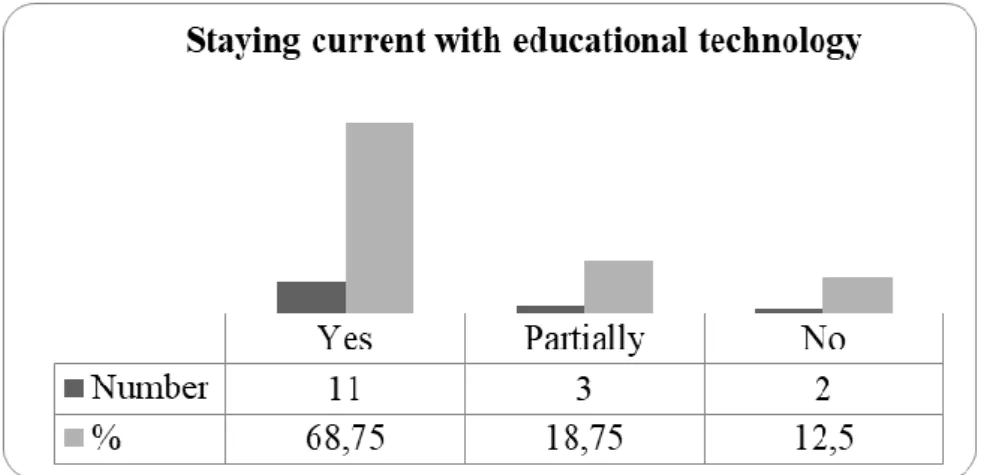
Teachers’ views related to staying current with the educational technology were investigated with interview question 5. The results were shown in the Figure 2 below.
Figure 2. Distribution of teachers' responses towards the question of “Do you stay current with educational technology?"
As it is seen from the Figure 2, 68.75 % (N=11) of the teachers give the response of ‘yes’ to the question. It means that they stay current with the educational technology. 18.75% (N=3) of the teachers give the partially response which means they stay current with the technology to some extent. And %12.5 (N=2) of them stated that they do not stay current with educational technology.
Table 9. Distribution of different subject area teachers' responses to the question of “Do you stay current with educational technology?"
Responses B % P % C % Total %
Yes 4 25 3 18.75 4 25 11 68.75
Partially 1 6.25 1 6.25 1 6.25 3 18.75
No 1 6.25 1 6.25 2 12.5
B: Number of biology teachers P: Number of physics teachers C: Number of chemistry teachers
According to data in Table 9, it is seen that 25% (N=4) of all interviewees stay current with educational technology are biology teachers. 6.25% (N=1) of them stay current with educational technology partially. And 6.25% (N=1) of them do not stay current with technology. Considering the results of physics teachers, as it is seen in Table 9, 18.75% (N=3) of all the interviewees are physics teachers who stay current with the educational technology. 6.25% (N=1) of them stay current with educational technology partially. And 6.25% (N=1) of them do not stay current with the educational technology. Lastly, 25% (N=4) of all the interviewees are chemistry teachers who stated that they stay current with the educational technology. Only 6.25% (N=1) of them stated that they stay current with the educational technology partially.
The frequency of using IWBs
The frequency of using IWBs in science classes was investigated in questionnaire with the question 6. And it was investigated in the interview with question 16 of the same teachers who participated in the questionnaire.
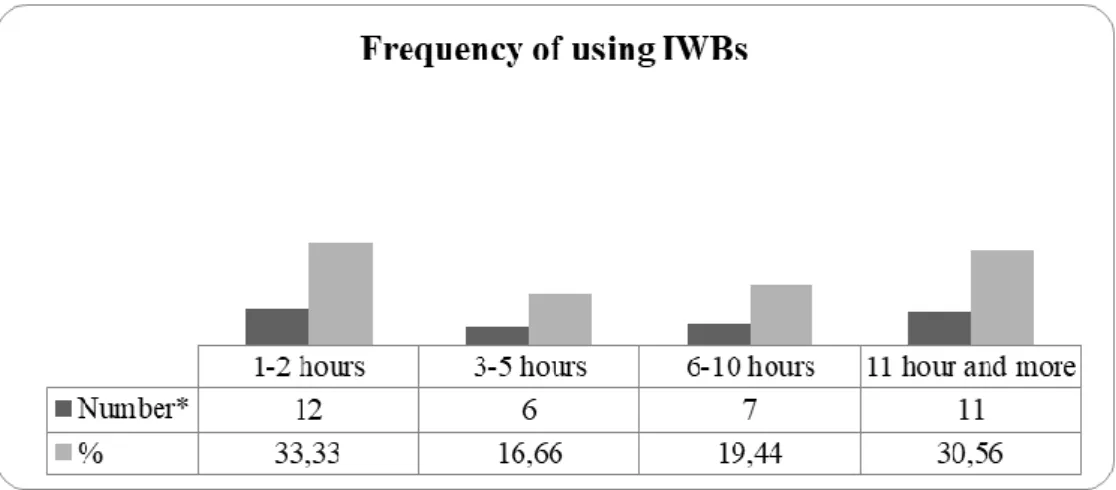
Figure 3. The frequency of using IWB in science classes (questionnaire results)
Number*: Number of teachers
Looking at the data from Figure 3, while 33.33% (N=12) of the teachers stated that they use IWBs 1-2 hours a week, 16.66% (N=6) of the teachers use IWBs for 3-5 hours in a week. And we see that 19.44% (N=7) of the teachers stated that they use IWBs 6-10 hours in a week. Lastly the second highest score belongs to 30.55% (N=11) of the teachers who stated that they use IWBs 11 hours or longer in a week. To check the consistency of the data, the same question was investigated with the interview questions. The results were shown in Table 10.
Table 10. The responses of different subject area teachers on frequency of using IWBs
Responses B % C % P % Total %
Rarely 1 6.25 - - - - 1 6.25
Sometimes - - 2 12.5 3 18.75 5 31.25
Often 4 25 4 25 2 12.5 10 62.5
B: Number of biology teachers P: Number of physics teachers C: Number of chemistry teachers
According to Table 10, 62.5% (N=10) of the teachers use IWBs in their lectures often. Amongst all interviewees, 25% (N=4) are biology teachers, 25% (N=4) are chemistry teachers and 12.50% (N=2) are physics teachers who stated that they use IWBs in their lectures often. 31.25% (N=5) of them stated that they sometimes use IWBs in their classes. Of these, 12.50% (N= 2) of all participants are chemistry teachers and 18.75% (N=3) of all are physics teachers. 6.25% (N=1) of all participants use IWBs in their classes rarely and this particular subject is a biology teacher.
e) IWB’s contribution to particular teaching processes of the high school science teachers
Two interview items (question 10 and 11) investigated teachers’ views about IWBs’ contributions to particular teaching processes. Question 10 aimed to learn teachers’ views about the benefits of IWBs in science teaching settings. The question 11 was about when teachers use IWBs, whether they can attain the expected outcomes easily, or not.
Table 11. Teachers' views about IWBs’ contributions to the science education
Teachers' views about IWBs’ P % C % B % Total %
There is no benefit of IWBs to the science
education - 1 6.25 1 6.25 2 12.50
conditions
Sharing the visual materials support the learning
2 12.50 2 12.50 3 18.75 7 43.75
Raising students’ motivation and avoiding monotonous lesson
- 2 12.50 2 12.50 4 25.0
Saving of time 1 6.25 1 6.25 1 6.25 3 18.75
P: Number of physics teachers C: Number of chemistry teachers B: Number of biology teachers
As it is seen in Table 11, 6.25% (N=1) of all participants who are chemistry teachers and 6.25% (N=1) of all who are biology teachers stated that there is no benefit of IWBs to the science education. 18.75% (N=3) of all participants who are physics teachers, 18.75% (N=3) of all who are chemistry teachers and 6.25% (N=1) of all who are biology teachers responded as showing the experiment which is in optimum condition, contributes to science education.
Other contributions of the IWBs is stated by 12.50 % (N=2) of all participants who are physics teachers, 12.50% (N=2) of all who are chemistry teachers and 6.25 (N=1) of all who is a biology teacher. It is stated that sharing the visual materials support learning science. 12.50% (N=2) of all participants who are chemistry teachers and 12.50% (N=2) of all who are biology teachers think that IWBs provide motivation to students and help avoid monotonous classes. Lastly 6.25% (N=1) of all the teachers from each of the subject groups stated that IWBs help save time in science classes.
Table 12. Teachers' views which are related to the interview question 11
Views P % C % B % Total %
Yes 3 18.75 5 31.25 6 37.75 14 87.50
No 1 6.25 - - - - 1 6.25
No idea 1 6.25 - - - - 1 6.25
P: Number of physics teachers C: Number of chemistry teachers B: Number of biology teachers
Q11. If you use IWBs, do you think that you can attain the outcomes easily?
Table 12 indicates that 18.75% (N=3) of all participants who are physics teachers, 31.25% (N=5) of all participants who are chemistry teachers and 37.75% (N=6) of all participants who are biology teachers think that if they use IWBs in their lessons, they can attain the outcomes easily. Only one of the teachers stated that he/she has no idea about the question (6.25%). Lastly, one of the teachers thinks that if he/she uses IWBs, he/she will not attain the outcome easily (6.25%). Teachers’ comments related to IWB’s contributions to particular teaching processes can be exemplified as below. Teacher 2 states that “IWBs are really beneficial to science education. Although teachers value the importance of conducting the experiment in the laboratory, it cannot be as effective as expected because of the huge number of students and other reasons. IWBs provide the opportunity to observe experiments in optimum conditions and discuss about problems and difficulties in crowded classrooms”. Similar to Teacher 2, Teacher 5 states that “I use the IWBs especially for summarizing subjects to 12th grade students. Since they study for the university entrance exam, reviewing some topics is really easy with IWBs. Also, visual materials support learning and makes the knowledge last”. Lastly, another different comment was provided by Teacher 10: “If I use IWBs, I can attain the outcomes easier but IWB cannot operate itself. Teacher is also important.”
DISCUSSION and CONCLUSION
a) Attitudes of high school science teachers towards the use of interactive white boards
One of the aims of this research was to investigate science teachers’ beliefs and attitudes towards the use of IWBs. Teachers’ general views related to IWBs as a teaching tool were explored with a questionnaire and interview questions. According to teachers, using IWBs makes it easier for them to review, re-explain, and summarize a lecture. Most of the teachers agreed that they gave the explanations with utmost effectiveness with the help of IWBs.
In the literature, there are studies that found similar results (Glover & Miller, 2001; Güler & Çavuş, 2018; Mathews- Aydınlı & Elaziz, 2010). Another essential finding was the issue of time needed for the preparation of the lecture. A majority of teachers agreed that IWBs save time when they write on the board. According to Glover and Miller (2001), when teachers implement IWBs in their lectures, they need better preparations before the lesson. But, contrary to the findings of Glover and Miller (2001), the current research indicated that for the implementation of IWBs, teachers may not spend more time for the preparation of the lecture. In the literature, two researches found similar results with the current study (Mathews-Aydınlı & Elaziz, 2010; Türel & Johnson, 2012).
According to Gregory (2010), IWBs are significantly effective at reducing behaviour problems in the classroom. Also, Türel and Johnson (2012) and Mathews-Aydınlı and Elaziz (2010) found similar results. Contrary to the findings in the literature, the current study indicated that IWBs may not facilitate classroom management, for the reason that some of the teachers claimed that students’ attention can be distracted easily after long hours. Thus, in the current study, it may be concluded from the teachers’ common opinions that IWBs are not sufficient for classroom management alone, also teachers’ performance is really important.
The majority of science teachers enjoy using the IWB technology and have positive feelings towards it. Similar results were found in other studies in literature (Altınçelik (2009; Güler & Çavuş, 2018; Mathews-Aydınlı & Elaziz, 2010). Also, Çoklar and Tercan (2014) found that teachers listed number of advantages of using IWBs in the classroom.
Demographic features of the participants bring another approach. Since the ages of the teachers who participated in the study were mostly fourty and over, the attitudes of teachers towards using IWBs were expected to be negative rather than positive. Waugh (2004) concluded that technology acceptance decreases as age increases (as cited in Kotrlik & Redmann, 2009, p. 46). According to Smerdon et al. (2000), experienced teachers were less capable of using computers and internet than less experienced teachers. But in the current study, although teachers’ ages were 40 and over, their acceptance of IWB technology was extremely high.
Additionally, although teachers have positive beliefs and attitudes towards IWBs, it was found that they were not confident while they were using IWBs in classrooms. Several researchers (Alparslan & İçbay, 2017; Al-Qirim, Mesmari, Mazroeei, Khatri, Kaabi, 2017; Marín-Diaza, Figueroa-Floresb & Varoa, 2017; Samsonova, 2019) claimed that in-service teacher trainings and teachers’ feelings of preparation are related. By looking at the responses to questions related to teacher training programs, most of the teachers stated that in-service trainings were unsatisfactory. These findings reveal that although teachers have the potential to use IWBs in their classrooms, they hesitate to use it because of needs to develop their technology skills.
b) Use of IWBs in high school science classes
Another finding of the current study was related to the actual use of IWBs in high school science classes. Regarding the teachers’ responses which were collected with the
questionnaire and interviews, teachers admitted that IWBs are a good teaching supplement that helps teachers to review, re-explain, and summarize the subject. While they strongly agreed that with IWBs it is easier to access different sources and display them to the whole class immediately, they also shared the same idea about IWBs that it makes it easier to save and print the materials generated during the lesson.
In addition to the questionnaire findings, results of the interview questions indicated that teachers mostly use IWBs to show visual experiments, materials, animations and to play videos in the science classes. Thus, it was found in the current study, the majority of the teachers prefer to use IWBs as a visual material for increasing the students’ motivation and make learning permanent. Alparslan & İçbay (2017) and Hodge & Anderson (2007) have reported similar findings, since IWBs integrate visual materials with active learning activities; it is a kind of facilitator of learning.
According to the views of Beeland (2002), IWBs address three modalities of learning: visual, auditory and tactile. In the current study, although teachers used a series of visual and auditory activities, no activity was observed for tactile learners. Thus, some of the teachers indicate that EBA should provide specific activities which will incorporate the students into the lesson.
Sixteen hours of observations in the science classes revealed that most of the teachers were able to use the basic functions of IWBs like: searching something on the internet, highlighting a text part, navigating the screen from the board itself and not from the desktop computer, using functions of screen curtain and using specific software programs. During the classroom observations, one of the common uses of IWBs was searching for something on the internet spontaneously in the case of necessity. It was seen that freedom of accessing knowledge during classes reduces the pressure on teachers and promotes self-confidence. Hodge and Anderson (2007) also reported that; with the help of IWBs, teachers can bring the outside world like art galleries, scientists or the microscopic world into the classrooms.
Another important function which was used in observed classrooms was the drag and drop function of the IWBs. It was observed that teachers could make some changes on the lesson material immediately, could move figures and have implemented activities which are specific to IWBs. Bannister (2010) also reported in her study, by using the drag and drop function, many interactive activities can be arranged based on this simple idea.
Although the majority of teachers stated that they use IWBs for showing animations or playing videos in the interview, the findings in the observation phase were surprising in that only 18.75% (N=3) of the teachers played audio or video files. The reason for that may be originating from the time limitation because of condensed curriculum in the lesson.
c) Teachers’ common problems which are related to IWBs
In this section, the study focused on the common problems which were structured according to responses of science teachers who participated in the interview. The results of the interview questions showed that 62.5% of teachers think that their in-service training was un-satisfactory. Also, teachers think that students are better at using IWBs rather than them. According to Martin, Shaw & Daughenbaugh (2014) and Smerdon et al. (2000), teachers’ use of technology is related to their feelings of preparedness, and the feeling of preparedness can be strengthened with in-service trainings. Thus, the results of both that study and the current one indicate that a majority of the teachers may become more motivated to use IWBs if they get sufficient in-service trainings.
Another problem is although teachers have access to the StarBoard software program and tools which are included in IWB, most of them tend to use the similar functions which are available through computer and projector. Teachers do not use specific features of IWBs and most of them think that there is no basic difference between proxy and IWBs. Hence some of
the teachers think that there was no need such costly innovations. From a different perspective, minority of teachers who use the specific features of the IWBs, cannot describe the functions of IWBs which they use in the classroom. So according to result, it might be stated that most of the teachers’ Technological Pedagogical Content Knowledge (TPACK) and or Technological Pedagogical Knowledge (TPK) may be different from each other and need to be improved. According to Lefebre, Samson, Garean & Brouillette (2016), TPK and Technological Knowledge (TK) of the teacher have an effect on use of IWBs regardless of the grade they are teaching, their gender, or the years of teaching experience.
One of the common reported problems as stated by other researchers (Çoklar & Tercan, 2014) related to the use of IWBs is the frequency of damage to the boards or calibration settings. Teachers reflected that this problem may originate from the students’ use of the board outside of intended purpose. According to teachers, students use IWBs as a play tool and they also listen to music and upload programs at the break times. While the classroom observations, the music sounds originated from the classrooms at the break times, were frequently observed. Thus, it can be stated that students’ use of IWBs out of intended purpose may be the main reason for the frequent damage of the board.
Another common problem which was stated by the teachers is the insufficiency of the internet connection. In classroom observations, most of the teachers suffered from the lack of internet connection and stated this problem in their interviews. Besides that, it was stated that IWBs could cause some concerns about health, safety and the amount of resulting radiation. Teachers stated that students suffer from headaches after long hours of using of IWBs. In the literature there are some similar results (Bell, 2001; Smith et al., 2005; Tameside MBC, 2003). Also, the findings of other researchers, Kocak and Gulcu (2013), about teachers’ concerns about resulting radiation, exhaustion of the eyes and headaches are similar to the current research.
As a final point, teachers wish to have relevant sources which can incorporate students to the lesson actively. They expect innovation from EBA for providing specific resources and activities compatible with the IWBs. All of these findings reveal that if these problems can be solved, the expected results of the IWBs in education field could reach the targeted levels.
d) Differences among high school science teachers’ (physics, chemistry, biology) attitudes towards the use of IWBs
To evaluate the attitude differences among high school science teachers towards using IWBs, their acceptance towards staying current with the educational technology was investigated. According to study, 68.75% of the teachers stay current with the educational technology regularly. Since the frequencies are approximately equal, there was no significant difference between different subject areas of teachers in terms of staying current with technology. This finding may be a reason for high acceptance ratios of IWB technology by high school science teachers.
Another important issue was the frequency of using IWBs in the classrooms. Although most of the teachers had positive attitudes towards using IWBs, the number of hours which teachers use IWB technology was surprising. One third (33.33%) of the teachers stated that they use IWBs 1-2 hours in a week, and 30.55% of the teachers stated that they use IWBs 6-10 hours in a week. When it comes to differences among subject areas (physics, chemistry and biology), it can be stated that biology and chemistry teachers’ use of IWB is more than physics teachers. When the reasons for that were asked to physics teachers, most of them indicated that it might be originating from time limitation because of the needs of problem solving and practicing in especially physic lessons. Also, they emphasize that since students find the physics lesson hard to understand, they prefer to solve problems and see IWB activities as waste of time. This result can be related with the utilization of IWBs in science
classes. According to the findings, it can be seen that physics teachers use basic functions of IWBs less than other teachers. This result may be correlated with teachers’ opinion that using IWBs in every class is nearly impossible.
e) IWB’s contributions to particular teaching processes of the high school science teachers
The final aim of this study was to investigate IWBs’ contributions to particular teaching processes of the high school science teachers. 87.50% of the teachers stated that when they use IWBs in their lessons, they attain the outcomes easily. Several researchers (Chou, Chang & Chan, 2017; Habeeb, 2018; Şen & Ağır, 2014) claimed that the use of IWBs have a positive effect on students’ academic performances.
Smith (2000) stated that IWBs are large that facilitates the board to be the focal point of the lesson. Besides that large images could be used that motivates the students. Thus, this helps students to remember lectures easily and so objectives of teachers are fulfilled. In the current study, 43.75% of the teachers stated that the visual materials displayed by IWBs support learning. As they think that IWBs improve students’ motivation and help avoid monotonous lectures, they also indicate that IWBs have the possibility to show experiments in optimum conditions. Consequently, according to their views, IWBs have important contributions to science classes.
SUGGESTIONS
The in-service teacher training program about IWBs should be reorganized by considering the teachers’ basic needs. Thus, the lack of confidence in using technology that is teachers’ common problem can be dispelled. Since teachers prefer to use similar functions which they got use in the proxy, some of them found this innovation to be a waste of money. The specific software palette for IWBs, differences between proxy and IWBs may be explained in a more detailed fashion in in-service teacher training programs. Basic infrastructure problems such as internet connection problems should be fixed by providing continuous technical service facilities. For further studies, infrastructure problems which were encountered in the pilot studies of FATİH project should be fixed at the beginning of the implementation step. The impacts of the IWBs to human health should also be investigated in-depth. Students’ access to the IWBs between classes should be regulated with some protective procedures.
In this research one of the aims was to explore high school teachers’ beliefs and attitudes towards the use of IWBs in science classes. In addition to science teachers, research can be done with high school social science teachers. Other researchers can explore the compatibility of EBA’s teaching resources designed for IWBs. This research explored attitude differences among high school science teachers (physics, chemistry, biology), other researchers can investigate the usage differences between these three groups. The sufficiency of in-service teacher trainings provided by MNE can be investigated in further researches. In this research, science teachers were a part of study as participants. The study can be conducted with school principals and students as participants for further researches.
REFERENCES
Abuhmaid, A. (2014). Teachers’ perspectives on interactive whiteboards as instructional tools in four Jordanian Schools. Contemporary Educational Technology, 5(1), 73-89.
Al-Qirim, N., Mesmari, A., Mazroeei, K., Khatri, S., Kaabi, Z. (2017). Pedagogy and interactive white board technology integration in higher education institutions:
Computer-based teaching scenario prototypes. Education and Information
Technologies, 22(1), 355-368.
Alparslan, E. M., İçbay, M. A. (2017). Teachers’ opinions on interactive whiteboard and its use: A case study. Uluslararası Türkçe Edebiyat Kültür Eğitim Dergisi, 6(3), 1778-1797.
Altınçelik, B. (2009). İlköğretim düzeyinde öğrenmede kalıcılığı ve motivasyonu sağlaması
yönünden akıllı tahtaya ilişkin öğretmen görüşleri. (Unpublished master dissertation). Sakarya Üniversitesi Sosyal Bilimler Enstitüsü, Sakarya.
Bannister, D. (2010). Making the most of your interactive whiteboard. Retrieved from http://moe.eun.org/c/document_library/get_file?uuid=f4a9e773-b50a-4327-a164-46d209e93eaa&groupId=10620
Beauchamp, G. (2004). Teacher Use of the Interactive Whiteboard in Primary Schools: towards an effective transition framework. Technology, Pedagogy and Education,
13(3), 327-348.
Beeland, W. D. Jr. (2002). Student engagement, visual learning and technology: Can interactive whiteboards help? Annual Conference of the Association of Information
Technology for Teaching Education. Trinity College, Dublin.
Bell, M.A. (2001). Update to survey of use of interactive electronic whiteboard in instruction. Retrieved from http:// www.shsu.edu/ lis_mah/documents/updateboardindex .htm Chou, P.-N., Chang, C.-C., & Chen, M.-Y. (2017). Let’s draw: Utilizing interactive
whiteboard to support kindergarten children’s visual art learning practice. Educational
Technology & Society, 20(4), 89–101.
Çoklar, A.N., Tercan, İ. (2014). Akıllı tahta kullanan öğretmenlerin akıllı tahta kullanımına yönelik görüşleri. İlköğretim Online, 13(1), 48-61.
Dinçer, S. (2015). Effects of computer assisted learning on students’ achievement in Turkey: A Meta-analysis. Journal of Turkish Science Education, 12(1), 99-118.
Erduran, A., & Tataroğlu, B. (2009). Eğitimde etkileşimli tahta kullanımına ilişkin fen ve matematik öğretmen görüşlerinin karşılaştırılması. 9. International Technology
Conference (IETC). Ankara.
European Commission. (2013). Survey of schools: ICT in education benchmarking access,
use and attitudes to technology in Europe´s Schools. Retrieved from;
https://ec.europa.eu/digital-agenda/sites/digital-agenda/files/KK-31-13-401-EN-N.pdf Glover, D., & Miller, D. (2001). Running with technology: The pedagogic impact of the large
scale introduction of interactive whiteboards in one secondary school. Journal of
Information Technology for Teacher Education, 10(3), 257-276.
Glover, D., Miller, D., Averis, D., & Door, V. (2005). The interactive whiteboard: a literature questionnaire. Technology, Pedagogy and Education, 14(2), 155-170.
Gregory, S. (2010). Enhancing student learning with interactive whiteboards: perspective of teachers and students. Australian Educational Computing, 25(2), 31-34.
Güler, Ç., Çavuş, H. (2018). Interactive whiteboard use in teacher training: Trainers vs. trainees after one year experiences. Journal of Theoretical Educational Science, 11(4), 838-859.
Habeeb, K. (2018). Effects of interactive whiteboard training programs on teacher efficacy and student outcomes in kindergartens. Education and Information Technologies,
23(5), 2201-2212.
Harrell, M. C., & Bradley, M. A. (2009). Data collection methods: semi-structured interviews
and focus groups. RAND National Defend Research Institute. Retrieved from
http://www.rand.org/content/dam/rand/pubs/technical_reports/2009/RAND_TR718.pd f
Hodge, S., & Anderson, B. (2007). Teaching and learning with an interactive whiteboard: A teacher’s journey. Learning, Media and Technology, 32(3), 271–282.
Kennewell, S., & Morgan, A. (2003). Student teachers’ experiences and attitudes towards using interactive whiteboards in the teaching and learning of young children.
Conference on Young Children and Learning, 65–69.
Kocak, O., & Gulcu, A. (2013). Teachers’ remarks on interactive whiteboard with LCD panel technology. International Journal of Education in Mathematics, Science and
Technology, 1(4), 294-300.
Kotrlik, J. W., & Redmann, D. H. (2009). Technology adoption for use in instruction by secondary technology education teachers. Journal of Technology Education, 21(1), 44–
Lefebvre, S., Samson, G., Gareau, A. & Brouillette, N. (2016). TPACK in elementary and high school teachers’ self-reported classroom practices with the interactive whiteboard. Canadian Journal of Learning and Technology, 42(5), Retrieved July 9, 2019 from https://www.learntechlib.org/p/178019/
Liang, T., Huang, Y., & Tsai, C. (2012). An investigation of teaching and learning interaction factors for the use of the interactive whiteboard technology. Educational Technology
& Society, 15(4), 356–367.
Marín-Diaz, V., Figueroa-Flores, J. & Varo, C. (2017). The perceptions of early childhood educators regarding the uses of the interactive whiteboard. International Journal of
Environmental and Science Education, 12(6), 1503-1524.
Martin S., Shaw E., Daughenbaugh L. (2014). Using smart boards and manipulatives
in the elementary science classroom. TechTrends: Linking Research & Practice to
Improve Learning, 58(3), 90–96.
Mathews-Aydınlı, J., & Elaziz, F. (2010). Turkish students’ and teachers' attitudes toward the use of interactive whiteboards in EFL classrooms. Computer Assisted Language
Learning, 23(3), 235–252.
McIntyre-Brown, C. (2011). Understanding the next wave of technology innovation in
education: UK. Retrieved from
http://www.futuresource-consulting.com/pdfs/2011-01_Futuresource UK_UnderstandingNext%20WaveTechnology.pdf
Miles, M., B., & A. Michael, H. (1994). Early steps in analysis. An expanded sourcebook:
Qualitative data analysis (pp. 50-88). Thousand Oaks, CA: SAGE Publications.
Ministry of National Education. (2012). General information about FATİH Project. Retrieved from http:// FATİH projesi.meb.gov.tr/tr/english.php
Murcia, K., & Sheffield, R. (2010). Talking about science in interactive whiteboard classrooms. Australasian Journal of Educational Technology, 26(4), 417-431.
Nafidi, Y., Alami, A., Zaki, M., El Batri, B., & Afkar, H. (2018) Impacts of the Use of a Digital Simulation in Learning Earth Sciences (the Case of Relative Dating in High School). Journal of Turkish Science Education, 15(1), 89–108.
Ormanci, U., Cepni, S., Deveci, I, & Aydin, O. (2015). A thematic review of interactive whiteboard use in science education: Rationales, purposes, methods and general knowledge. Journal of Science Education and Technology, 24(5), 532-548.
Samsonova, O., (2019). Exploring Elementary Teachers’ Practices with Response to IWBS.
PUPIL: International Journal of Teaching, Education and Learning, 3(1), 130-145.
Slay, H., Siebörger, I., & Hodgkinson-williams, C. (2008). Interactive whiteboards: Real beauty or just ‘‘lipstick”? Computers & Education, 51, 1321-1341.
Smerdon, B., Cronen, S., Lanahan, L., Anderson, J., Iannotti, N., Angeles, J., & Greene, B. (2000, September). Teachers’ tools for the 21st century: A report on teachers’ use of