INCREASING THE SENSITIVITY
OF
THE SCANNING ACOUSTIC
MICROSCOPE TO ANISOTROPY
Abdullah
ATALAR
Electrical and Electronics Engineering Department
Bilkent
University, Ankara,
TURKEY
ABSTRACT
The response of the scanning acoustic microscope to anisotropic ma- terials is theoretically investigated. For this purpose, the reflection coefficient of plane acoustic waves incident on a liquid-anisotropic-solid interface is numerically calculated. The reflection coefficient depends, in general, on polar and azimuthal angles of incidence. For the acous- tic microscope case, a mean reflectance function can be deflned which depends only on the polar angle, b e c a w there is a circular symmetry. With this mean reflectance function it is possible to explore the effects of changing the lens parameters such as the acoustic field at the back side of the lens. It i s found that the response of the scanning acoustic microscope can depend heavily on the orientation of the solid material under investigation provided that a suitable lens insoniflcation is uti- lized. The amplitude of the acoustic microscope signal is influenced by the orientation of the material, because there is an interference between the acoustic waves reflected from the material surface at different az- imuthal angles. This interference is revealed as a minimum in the mean reflectance function. It is shown by computer simulation that, sensitiv- ity to orientation can be increased by uae of a ring shaped transducer in the near fleld of the acoustic lens. With such lenses, it may be possible to determine the orientation of crystallites in a material.
1.
INTRODUCTION
Scanning acoustic microscope has become a useful instrument in char- acterizing the properties of materials on a microscopic scale. Its mate- rial dependent images are a result of the sound wave reflection at the liquid-solid interface. The reflection coeficient-both amplitude and phase-uniquely characterizes the material under investigation. Cry%
talline materials such as integrated circuits and thin film structures or the grains of a polycrystalline material are typically acoustically anisotropic. For such materials direction sensitive acoustic lens gwme- tries have been utilized for characterization purposes [l,2,31. Somekh et al. Ill] have studied the reflection coefficient of anisotropic materials at a liquid interface for the purpose of understanding acoustic images obtained by acoustic microscopes. They have numerically calculated the reflection coefficients for some materials and applied the results for interpretation of contraat in acoustic images.
In this paper, the results of a study on the reflection of plane acous- tical waves at a liquid-anisotropic-solid interface are applied for the determination of the scanning acoustic microscope response. Ways of improving the sensitivity to anisotropy are discussed.
0090-5607/87/00oO-O791 $1
.OO 0
1987 IEEE
U.
RESPONSE
OFSCANNING ACOUSTIC
MICROSCOPE
TOANISOTROPIC MATERULS
For a planar object surface placed perpendicular to the lens axis scan- ning acoustic microscope output can be expressed as[6,6)
where V is the output voltage of the acoustic microscope, U+ is the acoustic field at the back side of the acoustic lens, R is the complex re- flectance function at the liquid-solid interface as a function of direction cosines in two directions, P
is
the pupil function of the lens, j is the focal length of the lens and 2 is the distance between the focal point and the object position. At2
= 0 the microscope output is essentially an integral of the reflection function. Eq. 1 can be written in cylindrical coordinates asFor circularly symmetric cues, it is possible to reduce the reflection function to a one-dimensional function for for the purposes of calcu- lating the acoustic microscope output 141. Following the notation of Somekh et al. with sin 8 = r / j we can deflne a mean reflectance func-
tion and write
Ir
R'(sin8) =
1
R(sin8cos),sin8ain))d) (3) R' is a function of sin8 only. Because the ) dependance is removed by an integration in9
direction. Due to the complexity of the reflec- tion problem, an analytical solution ofR
is not possible [7,8], hence a numerical approach is attempted. A FORTRAN program has been written to compute the reflection function as a function of polar and azimuthal angles. The program can handle materials with arbitrary stiffness matrices of twenty-one Constants, so materials with arbitrary orientation can be handled with proper transformation of stiffness ma- trix by multiplication with Bond-matrices[SI. The program was tested against materiala whose reflection coemcients were previosly calculated[4,lO]. The integral in Eq. 3 must be carefully evaluated because of the complex nature of the reflectance function. Suficiently many points must be included in the integral for correct results, especially for large sin 8 values. We have calculated a number of such curves for
SAM
re- sponse determination. Fig. 1 shows the amplitude and phase plots ofR' for water-silicon interface at principal planes of silicon. Since silicon crystal is of cubic structure, for (001) surface integration is performed for ) between 0' and 45', for (011) surface between '0 and 90" and for (111) surface between 0' and GOo. Figs. 2,3,4 and 5 are similar
0 01 0 2
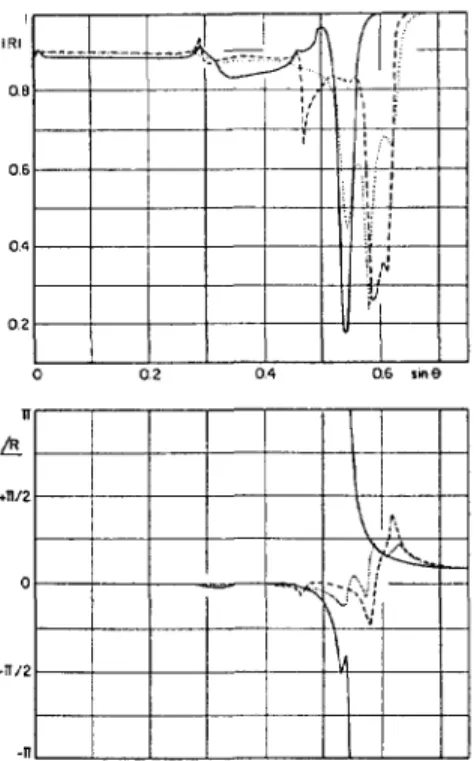
Figure 1: Average reflection function amplitude and phase for wa- ter-silicon interface at various orientations, (001) (solid), (011) (dotted) and (111) (dashed) as a function of sin#.
Figure 2 Average reflection function amplitude and phase for w a ter-GaAs interface at various orientations, (001) (solid), (011) (dotted] and (111) (dashed) as a function of sin 6.
presentations for water-GaAs, -iron, -nickel and -aluminum interfaces. Inspection of the amplitude curves indicate that there
ia
a signiflcant dip in the curves where there is a phase transition. The dip is asa result of interference between reflected rays at different uimuthal angles after the integration operation. The interference is insignificant for isotropic or nearly isotropic materials where the phase transition
O C C U ~ nearly at the same 0 for different I$ values. But for anisotropic materials the phase transition occum at different 6 values for different
I$ values. When the acoustic rays at these angled are vectoriaUy added, there will be an interference. We must point out that our results for mean reflection function do not fully agree with that of Somekh et al. [SI, although plots for R are in perfect agreement.
We recall that the interference effect, which gives rise t o material d o pendence of V(2) curves, O C C U ~ between the central rays and and the
rays near the phase transition angle Ill]. For an-wotropic materials we observe that the amplitude of the m y s near transition angle
is
consid- erably reduced because of another interference effect mentioned above. Hence, the nulls and peaks of V(2) will not be very deep and the sen- sitivity to material parameters will be less for such materials.For a circulary symmetric illumination and pupil function
Eq.
2 can be simplified. CombiningEq.
3 withEq.
2 one can arrive at a one- dimensional integral:This integral ia relatively easy to calculate. The functions U+ and
P
will be determined from the lens parameters. Typically one uses transducer s i m which will minimize the diffraction low in the buffer rod. Fig. 6shows a plot of U+ for such a case. In Fig. 7 we show the results of cal-
culations for GaAs and nickel crystals at various orientations. Observe that the difference between the curves are appreciable at negative Z
values, i.e. when the object surface is brought closer to the lens than the focal diwtance. It is therefore poasible to observe the grain structure of a material under acoustic microscope with a sacrifice in resolution.
IU.
INCREASING
THE SENSITIVITY TO ANISOTROPY
Looking at the Figs. 1-5 it is easy t o imagine how one gets an increase in contrast between differently oriented regions of the same material. Comparison of the amplitude curves indicate that the angles around zero degrees do not differ considerably. On the other hand, at higher angle values and especially around the phase transition there is more difference. It may be preferrable to use a pure amplitude response rather than a phase effect.
One should excite only those angles which are more interesting. One needs
an
annular type excitation. Nikoonahad et al. 1121 used an acous- tic lens with a suitable transducer to exclude some excitation angles for providing Rayleigh wave suppression. Our proposal here is just the opposite case. The central rays are to be suppressed to increase sensi- tivity. Note that, providing an annular transducer does not guarantee that excitation U+ will be annular. Diffraction effects are not at allnegligible considering the fact that at typical operating frequencies the wavelength ia comparable to the siee of the transducer. We have calcu- lated the diffraction low between two annular transducers as a function of distance between the transducFn, The results show that the diffrac- tion loss increases drastically in the Fresnel region of the transducer. One acceptable solution
ia
in the near fleld of the transducer. This im- plies that one has to uae relatively thin acoustic buffer rods which may be impractical at high frequencies. Nevertheless, it is also possible to flnd geometries which will give acceptable diffraction loss and generate a reasonably ring shaped illumination at the back side of the acoustic lens. To improve the situation the central portions of the acoustic lens surface may be coated by an absorber material or the antireflectionReferences
layer may be etched away in this region.Once the transducer is illuminated by a ring shaped acoustic field, the response of the microscope for different materials can be calculated. The illumination function U+ of Eq. 5 must be appropriately defined
for the acoustic field pattern at the back focal plane of the lens. With an illumination function shown in Fig. 6, V ( 2 ) curves for various ma-
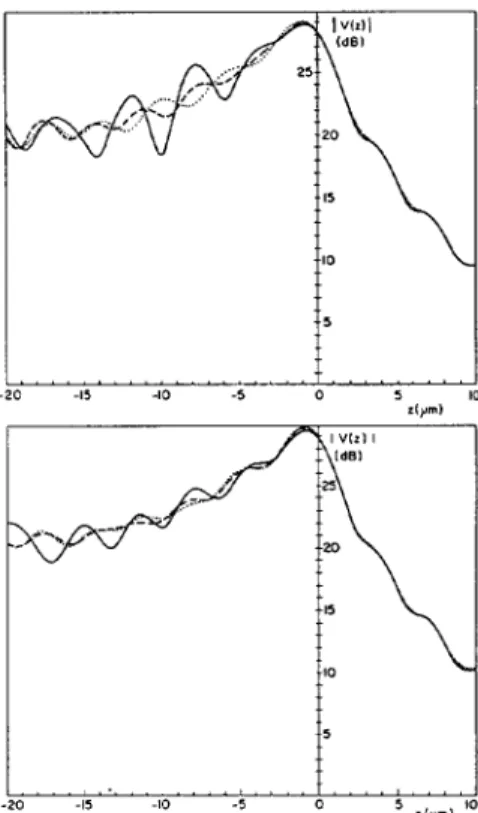
terials can be compared to see the gain in sensitivity. Fig. 8 depicts calculated V ( 2 ) curves for GaAs and nickel a t various orientations
with the annular excitation. Comparing thw figure with Fig. 7 we note the increase in the difference between the curves. Notice also that the signal level at
2
= 0 is now significantly different for different orien- tations. Hence, the grain structure of materials can be observed [13] also at 2 = 0 without losing resolution. It is possible to increase the sensitivity even further, if a narrower ring excitation can be used. But this is rather diWcult because of diffraction effects in the buffer rod.IV.
CONCLUSIONIn this paper, the results of numerical calculations on acoustical re- flection problem at a liquid-anisotropic-slid interface are presented and the mean reflection coefficient plots of various solids are obtained. It is possible to compute the response of an acoustic microscope for anisotropic materials, once the mean reflection function is determined. Response of the acoustic microscope for various anisotropic crystals at various orientations are presented. We have found that it ia possi- ble to increase the sensitivity of the scanning acoustic microscope to anisotropy by using ring shaped transducers. With properly designed lenses, the acoustic image contrast observed between the grains on sur-
faces of polycrystaline materials will be increased.
[l] J.Kushibiki, A. Ohkubo, and
N.
Chubachi, "Anisotropy detection in sapphire by acoustic microscope using line-focus beam" Elect. Lett. 17, 534-536 (1981).(21 J.A.Hildebrand and L.K.Lam, "Directional acoustic microscopy for observation of elastic anisotropy" Appl. Phys. Lett. 42, 413-
415 (1983).
131 D.A.Davids and H.L.Bertoni, "Bow-Tie h d u c e r s for measure- ment of anisotropic materials in acoustic microscopy" Proc. of
UI-
trasonies Symp. Williamsburg, VA (1986).
141 M.G. Somekh, G.A.D. Brigga and C.Ilett, "The effect of elastic anisotropy on contrast in the scanning acoustic microscope" Philo- sophical Magaeine A, 49, 179 (1984).
161 A.Atalar, "An angular spectrum approach to contrast in reflection acoustic microscopy" J.Appl.Phys. 49, 6130 (1978).
[6] K.K. Liang, G.S. Kino and B.T. Khuri-Yakub, "Material Charac- terization by the Inversion of V(Z)", IEEE h s . Son. Ultrason.,
32,213-224 (1985).
[7] E.G. Henneke, 11, J. Acoust. Soc. Am. 51, 210 (1969).
[8] E.G.Henneke I1 and G.L.Jones, "Critical angle for reflection at a liquid-solid interface in single crystals" J. Acoust. Soc. Am. 59,
[9] B A . Auld, Acoustic Fields and Waves in Solids, Vols. 1 and 2
(Wiley-Interscience, New York, 1973).
[lo] A. Atalar, "Reflection of ultrasonic waves at a liquid-cubic-solid interface" J. Acoust. Soc. Am. 73,435 (1983).
Ill] W. Parrnon and H.L. Bertoni, "Ray interpretation of the material signature in the acoustic microscope" Elect. Lett. 15, 684 (1979). 204-205 (1976).
Figure 5: Average reflection function amplitude and phase for wa- ter-aluminum interfaceat various orientations, (001) (solid), (011) (dot- ted) and (111) (dashed) as a function of sine.
(12) MNikoonahad, PSvaprakasapillai and E.A.Ash, "Rayleigh wave suppression in reflection acouatic microscopy", Elect. Lett., 19,
(13) J.E. Heiserman and C.F. Quate, "The Scanning Acoustic Mi- croscope", Rontiem in Physical Acoustics, XCIIl Corn, 343-394 (1986).
906-908 (1983).
t
I I,
0 0.2 0.4 Sin e 0.6
Figure 6: lnsonification functions U+ used in computations for a
sapphire acoustic lens with 75p pupil radius at 1100 MHz: De- signed t o minimize diffraction loss (solid curve)( 105p transducer ra- dius, 1200p buffer rod length), designed to improve the sensitivity to anisotropy(daahed linej(55p transducer inner radius, 75p transducer outer radius, 500p buffer rod length, central region blocked).
I . . . . , . , . . . . . . . . , . . t . . . - 2 0 -15 -10 -5 0 5 ripml 5 0 z i y r n l
'
-20 -15 -10 -5Figure 7: Calculated V ( Z ) curves for (001)(solid), (Oll)(dashed) and (lll)(dotted) faces of GaAs and nickel.
Figure 8: Calculated