INVESTIGATION OF LITHIUM SALT-NONIONIC
SURFACTANT MESOPHASES AND THEIR APPLICATIONS IN
SOLAR CELLS AS GEL ELECTROLYTE
A THESIS
SUBMITTED TO THE DEPARTMENT OF CHEMISTRY
AND THE GRADUATE SCHOOL OF ENGINEERING AND SCIENCE OF BILKENT UNIVERSITY
IN PARTIAL FULFILLMENT OF THE REQUIREMENTS FOR THE DEGREE OF
MASTER OF SCIENCE
By
GÖZDE BARIM July, 2013
I certify that I have read this thesis and that in my opinion it is fully adequate, in scope and in quality, as a thesis for the degree of Master of Science.
………. Prof. Dr. Ömer Dağ (Advisor)
I certify that I have read this thesis and that in my opinion it is fully adequate, in scope and in quality, as a thesis for the degree of Master of Science.
………. Prof. Dr. Nihal Aydoğan
I certify that I have read this thesis and that in my opinion it is fully adequate, in scope and in quality, as a thesis for the degree of Master of Science.
………. Assoc. Prof. Dr. Margarita Kantcheva
Approved for the Graduate School of Engineering and Science:
………. Prof. Dr. Levent Onural Director of the Graduate School
i
ABSTRACT
INVESTIGATION OF LITHIUM SALT-NONIONIC SURFACTANT MESOPHASES AND THEIR APPLICATIONS IN SOLAR CELLS AS GEL
ELECTROLYTE
Gözde Barım
M.S. in Department of Chemistry Supervisor: Prof. Dr. Ömer Dağ
July, 2013
Some salts and some nonionic surfactants self-assemble together into lyotropic liquid crystalline (LLC) mesophases. The salt can be either in aqueous solution phase or in its molten phase in the self-assembly process. Concentrated aqueous solutions of lithium salts (LiCl, LiBr, or LiI) and pluronics (triblock copolymers, such as P65, P85, P103, or P123) or 10-lauryl ether (C12H25(CH2CH2O)10OH, denoted as C12EO10) type nonionic surfactant mesophases were investigated in this thesis work. The LLC mesophases are well ordered between 5.0 and 25.0 salt/pluronics and 2.0 and 10.0 salt/C12EO10 mole ratios, and remain stable for months under the ambient conditions. The water molecules remain as the hydrates under open atmosphere in the LLC mesophases of lithium salts-nonionic surfactants. The lithium salt-pluronic LLC mesophases are birefringent and have a hexagonal mesophase in a broad range of salt concentrations. The unit cell of the mesophases increases and a transition from the hexagonal to a cubic mesophases occurs upon increasing the salt content of the media. Moreover the LLC mesophases are ordered and stable up to 25.0 salt to pluronic mole ratio. At higher salt content, one can observe either a disordered phase or co-existence of salt crystals and mesophase.
There is a big demand on the gel electrolytes for dye sensitized solar cells (DSSC) in order to overcome solvent problems caused by liquid electrolytes. The LLC mesophases of LiI, LiCl and LiBr salts with 10-lauryl ether (C12EO10) has been
ii
considered as gel-electrolyte for the DSSC. We demonstrate that the LiI/I2 couple can be incorporated into above LLC mesophases of various lithium salt-nonionic surfactant systems. Those LLC phases, with LiI/I2 couple have been characterized by means of diffraction, microscopy, spectroscopy and conductivity measurements. The LLC mesophases diffract at small angles and do not show any phase segregation upon incorporating the LiI/I2 redox couple. The LLC mesophases of these systems are 2D hexagonal, and they remain stable under ambient conditions for months. In the LLC media, the iodide ion and iodine molecule react to produce triodide ion in the media. The iodide/triodide (I-/I3-)redox couples containing gel electrolytes were formed and their solar performance was investigated by using a solar simulator and a cell consisting of a dye sensitized anode (FTO-dye modified TiO2), gel-electrolyte, and a cathode (FTO-Pt nanoparticles). The LLC mesophases of various lithium salt-nonionic surfactant systems with the I-/I3- redox couple were characterized using POM (Polarized Optical Microscope), XRD (X-ray Diffraction), FT-IR (Fourier Transform Infrared Spectroscopy) and Raman techniques. These new LLC mesophases can be used as gel electrolytes in solar cells after incorporation of redox couple into the media and display responses as good as commonly used liquid electrolytes.
Key Words: Lyotropic Liquid Crystal, Mesophases, Molten Salt, Concentrated Aqueous Solution, Self-assembly, Solar Cell, Gel Electrolyte, Redox Couple
iii
ÖZET
LİTYUM TUZLARININ İYONİK OLMAYAN YÜZEY AKTİFLERLE OLUŞTURDUKLARI ARAHALLER VE BU YAPILARIN GÜNEŞ HÜCRELERİNDE JEL ELEKTROLİT OLARAK UYGULAMALARI
Gözde Barım
Yüksek Lisans, Kimya Bölümü Tez Yöneticisi: Prof. Dr. Ömer Dağ
Temmuz, 2013
Bazı tuzlar iyonik olmayan yüzey aktiflerle kendiliğinden düzenlenerek liyotropik sıvı kristal (LSK) arahaller (mesophase) oluşturur. Kendiliğinden düzenlenme sürecinde tuzlar elektrolit çözelti olarak ya da eriyik halde bulunabilirler. Bu çalışmada lityum tuzlarının derişik elektrolit çözeltilerinin (LiCl, LiBr, and LiI) iyonik olmayan yüzey aktiflerle (oligo(ethylene oksitler, yada pluronikler, üç-bloklu polietilen-polipropilen-polietilen) oluşturdukları arahaller incelenmiştir. Lityum tuzlarının pluroniklerle oluşturduğu LSK arahaller 5.0 ile 25.0 tuz/pluronik, oligo(ethylene oksit) (C12EO10) ile oluşturduların da ise 2.0 ile 10.0 tuz/C12EO10 mol oranında düzenli olduğu ve oda koşullarında aylarca karalı olduğu gösterilmiştir. Atmosfere açık lityum tuzu-Pluronik LSK arahallerinde su, hidrat bileşikleri olarak kalmaktadır. Bu sistemlerin geniş tuz yoğunlukları aralığında hekzagonal arahalde bulunduğu gözlemlenmiştir. Ortamdaki uz oranlarını arttıkça birim hücrenin büyüdüğü ve hekzagonal arahalden kübik arahale geçiş olduğu gözlemlenmiştir. 25.0 tuz/pluronik mol oranlarına kadar numunelerin düzenli ve kararlı bir yapıda oldukları daha yüksek oranlarda ise düzensiz arafazlar ve/veya tuz kristallerinin oluştuğu görülmüştür.
Jel elektrolitler, sıvı elektrolitlerde görülen sorunların giderilmesi bakımından oldukça ilgi çekmektedirler. Bu çalışmada, LiI, LiCl ve LiBr tuzlarının 10-lauryl eter (C12EO10) ile oluşturdukları lyotropik arahaller de incelenmiştir. Bu arahaller 2.0 ile 10.0 tuz/C12EO10 mol oranı aralığında kararlı yapıdadırlar. LiI/I2 çifti, jel elektrolit oluşturmak için çeşitli lityum tuzu-iyonik olmayan yüzey aktif sistemine katılmıştır.
iv
LiI/I2 çifti içeren LSK arahaller polarize optik mikroskopu, X-ışını kırınım yöntemi, FT-IR ve raman spektroskopileri kullanılarak incelenmiştir. Bu sistemlerin lytropik arahallerinin 2D hegzagonal yapıda olduğu ve açık atmosferde aylarca kararlı kaldığı belirlenmiştir. Bu arahallerin düşük açıda kırınım yaptığı ve LiI/I2 çifti katıldıktan sonra faz ayrımına uğranmadığı görülmüştür. Ayrıca LSK arahallerde iodürün, iyot ile tepkime vererek tri iyodür oluşturduğu gözlenmiştir. Böylece I
-/I3- yükseltgenme indirgenme çifti içeren jel elektrolitler elde edilmiş ve bu elektrolitlerin performansları güneş benzeticisi ve oluşturulan güneş hücresi (anot-gel elektrolit-katot, anot = FTO-boya uyarılmış TiO2, katot = FTO-Pt nanoparçacıklar) kullanılarak ölçülmüştür. Bu yeni LSK sistemlerinin güneş pillerinde jel elektolit olarak kullanılabileceği ve bilinen sıvı elektrolitler kadar iyi performans verdiği gösterilmiştir.
Anahtar Kelimeler: Liyotropik Sıvı Kristaller, Arahaller, Eriyik Tuzlar, Derişik Elektrolit Çözeltiler, Kendiliğinden Düzenlenme, Güneş Hücreleri, Jel Elektrolitler, Yükseltgenme İndirgenme Çifti
v
ACKNOWLEDGEMENTS
First of all, I would like to express my gratefulness to my graduate program supervisor, Professor Ömer Dağ for patiently sharing his ideas with me throughout the time of my research. From him, I got acquainted with lots of chemistry disciplines and scientific methods. He encourages collegiality and team work in all his group members. His support and positive attitude towards my studies have helped me to propel ahead, despite all the academic challenges and huddles I faced. To accomplish great things especially in such a high level of education requires effort, dedication, perseverance, optimism and most importantly a supervisor like him, who never relents until he sees you to the level you aspired to reach. Without his continuous support and supervision, the possibility of completing this demanding task would have still been a nightmare. His knowledge and wisdom will always be a fountain!
I would also thank examining committee members, Prof. Margarita Kantcheva and Prof. Nihal Aydoğan, for their time and valuable suggestions on my thesis.
I am deeply grateful to Cemal Albayrak too. He was one of the senior members in our research group whose contribution and guidance in my research cannot be overemphasized. He assisted me all sectors of my research especially in the alkali metal systems. The service he rendered to me and other members of the group have been exceptional. As a result of his generosity and selfless attitude towards us all, I sincerely wish to thank him on behalf of all the present members of the group and on my own personal behalf. I will also like to thank Cüneyt Karakaya, Ebrima Tunkara and Aykut Aydın; we have had enjoyable and fruitful discussions about our research topics. I also thank all present and former group members for their contributions, help and friendship. I would not have gone this far without the courage and confidence they instilled in me.
For success to be pronounced in anyone‘s academic life, there must be nice and loving batchmates around him/her, to discourse ideas with, ease their frustrations, and remained steadfast in both dying and trying moments. Therefore, if my thesis achievement is anything to go by, I would like to thank my dear friends for being the soul reason. The list includes but not limited to Özlem Ünal, Tuğçe Durgut,
vi
Merve Doğaç, Tuba Yaşar, Yiğit Altay, Menekşe Koca, Melis Tunalı, Duygu Demircioğlu, and Merve Taner from our department. Bilkent became my home because of their sincere friendship. We all share our happiness and sorrow, joy and frustration during the last seven years. I was truly blessed having such reliable friends. Special thanks to Şeyma Ekiz, Okan Çiftçi, Elif Mercan and Batuhan Kav for their sense of humor and candid fellowship. I spent my funniest time with them both in ‗Gradhane‘ and ‗International Society of Irrationality‘. I will miss the conversations we used to have about anything irrational so much after going to the US.
The hardest thing in one‘s life is to stay away from the people you love most: people that will never want to see you sick, poor, or underachieve. I missed my family so much for the past seven years in order to pursuit academic excellence. In that regard, I wish to sincerely thank and dedicate the thesis to my family for their encouragement, patient and motivation. It was significant for me to feel their suppot in order to complete this thesis.
vii
CONTENTS
CHAPTER 1 ... 1 1. INTRODUCTION ... 1 CHAPTER 2 ... 3 2. BACKGROUND ... 3 2.1. Liquid Crystals ... 32.1.1. Lyotropic Liquid Crystalline Mesophases ... 7
2.1.2. Binary Systems of Poly(ethylene oxide) Type Surfactants (CmEOn+H2O)... 10
2.1.3. Effect of the Additives on CmEOn-H2O Systems ... 13
2.2. Lyotropic Liquid Crystals in the Synthesis of Novel Materials ... 16
2.3. Salt-Surfactant Liquid Crystalline Systems ... 18
2.4. A New Phase Transition in LLC Systems ... 22
2.5. Effect of Deliquescence on the Stability of LLC Mesophases... 24
2.6. Electrolytes for Dye-Sensitized Solar Cells ... 25
2.6.1. Characteristics of the Iodide/Triiodide Redox Couple ... 27
CHAPTER 3 ... 30
3. EXPERIMENT RESULTS ... 30
3.1. Materials ... 30
3.2. Sample Preparation ... 30
3.2.1. Preparation of the LiX-xH2O-C12EO10 Gel Samples ... 30
3.2.2. Preparation of Samples in the Solution Phase ... 30
3.2.3. Preparation of the Samples with Redox Couple ... 30
3.2.4. Preparation of thin LLC Films and Small Scale Gel Samples ... 31
3.3. Fabrication of Solar Cells ... 31
3.3.1. Preparation of Mesoporous Titania Films (meso-TiO2) ... 31
3.3.2. Preparation of Dye Solution and Titania Electrode ... 31
3.3.3. Preparation of Pt-deposited FTO electrode ... 31
3.3.4. Assembly of DSSCs ... 32
3.4. Instrumentation ... 33
3.4.1. The X-ray Diffraction (XRD) ... 33
3.4.2. The Polarized Optical Microscopy (POM) ... 33
3.4.3. The Fourier Transform - Infrared Spectroscopy (FT-IR) ... 33
3.4.4. The micro-Raman Spectroscopy ... 33
3.4.5. The AC Impedance Spectroscopy ... 34
3.4.6. UV-vis Spectroscopy ... 34
viii
CHAPTER 4 ... 35
4. EVALUATION ... 35
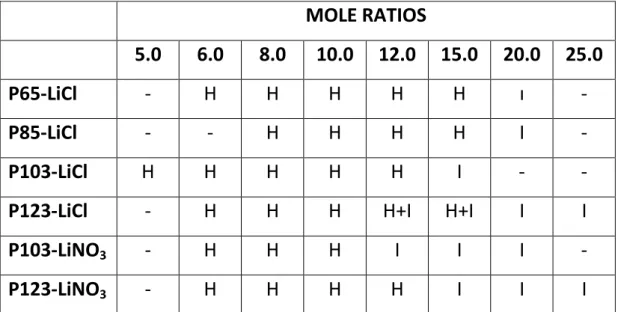
4.1. Lyotropic Liquid Crystalline Mesophases of Pluronics (P65, P85, P103, and P123) with LiCl and LiNO3 Salts ... 35
4.1.1. Salt-water-surfactant Interactions, Spectroscopic Studies ... 50
4.1.2. Conductivities and Isotropization Temperatures of Lithium Salt-Pluronic Systems ... 56
4.2. Lil-xH2O-C12EO10- Mesophase ... 60
4.3. Effect of Anions on the Lil-I2-xH2O-C12EO10 System ... 67
4.3.1. FT-IR and Raman Spectroscopic Investigations of the Li(X)-I2-xH2O-C12EO10 Systems ... 70
4.4. LLC Mesophases as Gel Electrolyte for Dye-Sensitized Solar Cells ... 73
4.5. Future Work ... 78
CHAPTER 5 ... 79
5. CONCLUSION ... 79
ix
LIST OF FIGURES
Figure 2.1. An illustration of positional and orientiaonal order in solids, liquid crystals and liquids. ... 3 Figure 2.2. Schematic representation of calamitic and discoitc liquid crystalline molecules... 4 Figure 2.3. Schematic representation of nematic, smectic and columnar phases from left to right.4 ... 5 Figure 2.4. Schematic representation of non-ionic, anionic, cationic and zwitterionic surfactants from top to buttom. ... 6 Figure 2.5. Schematic representation of surfactant molecules (left) and micelles (right) in water... 7 Figure 2.6. Schematic representation of (a) simple cubic (I1), (b) 2D-hexagonal (H1), (c) bicontiuous cubic (V1) and (d) lamellar (Lα) mesophases.18 ... 8 Figure 2.7. Schematic representation of a surfactant molecule as an ice-cream cone.19... 9 Figure 2.8. Phase diagram of C10EO6-H2O system at 1 atm.37... 11 Figure 2.9. Phase diagrams of C10EO6-H2O systems in the presence and the absence of salts. The salt species none (circles and straight line), LiCl (squares and dotted line), NaCl (triangles and dashed line) and CsCl (diamonds).45 ... 14 Figure 2.10. Phase diagrams of C12EO7 with various Na+ salts. The dashed lines corresponds to the salt free phase diagram.47 ... 15 Figure 2.11. Two different approach in the synthesis of mesoporous materials: (A) Cooperative self-assembly and (B) True LC templating process.54 ... 17 Figure 2.12. Schematic representation of hydrogen bonding interactions between coordinated water molecules and the ethylene oxide chain in a hexagonal LLC mesophase.48... 19 Figure 2.13. Phase diagram of the ZnX-C12EO10 system.68 ... 20 Figure 2.14. XRD patterns of the 4.0LiI-xH2O-C12EO10 mesocrystal at (a) low angles, and (b) high angles.71 ... 22 Figure 2.15. FT-IR spectra the 4.0LiI-xH20-C12EO10 mesocrystal (top) and LLC mesophase (bottom) at different wavenumbers.71 ... 23
x
Figure 2.16. POM images of 4.0CaCl2-xH20-C12EO10 mesocrystal Mesocrystal growth from (A) defect site mesophase (B)edge of the sample (magnified images on the right).71 ... 23 Figure 2.17. Energy scheme of cis-Ru(dcbpy)2(NCS)2-sensitized TiO2 solar cell with I-/I3- redox couple.84 ... 28 Figure 3. 1. DSSCs with gel electrolyte in the form of cell. ... 32 Figure 3. 2. DSSC with gel electrolyte sandwiched between two electrodes. ... 32
Figure 4.1. The small angle XRD patterns of the LiCl-xH2O-P65 mesophases with 8.0, 12.0 and 15.0 LiCl/P65 mole ratio (from bottom to top, left), and a POM image of a sample (right). ... 37 Figure 4.2. The XRD patterns at small angles of LiCl-P65-nH2O system with different mole ratios. ... 38 Figure 4.3. The XRD patterns, at small angles, of LiCl-xH2O-P85 system with 10.0, 12.0 and 15.0 mole ratios (from bottom to top). ... 39 Figure 4.4. The POM images of LiCl-xH2O-P85 system with 3.0, 6.0 and 8.0 mole ratios indicating surfactant crystals (bright dots) and formation of fan texture under the surfactant crystals. ... 39 Figure 4.5. The XRD patterns at small angles of LiCl-P85-nH2O system with different mole ratios. ... 40 Figure 4.6. The POM images of the LiCl-xH2O-P103 samples with a LiCl/P103 mole ratio of 6.0 (top) and 8.0 (bottom)... 41 Figure 4.7. The XRD pattern of cubic mesophase of LiCl-xH2O-P103 system with 15.0 LiCl/P103 mole ratios. The inset is a plot of the d spacing obtained from the above three diffraction lines versus 1/(h2 + k2 + l2)1/2. ... 42 Figure 4.8. The XRD patterns at small angles of LiCl-P103-nH2O system with different mole ratios. ... 44 Figure 4.9. The XRD patterns at small angles of LiCl-P123-nH2O system with different mole ratios. ... 45 Figure 4.10. The XRD patterns of the 2D hexagonal mesophase of LiNO3-xH2 O-P103 samples with 6.0, 8.0, 10.0, 12.0 and 15.0 LiCl/O-P103 mole ratios from bottom to top. ... 46 Figure 4.11. The XRD patterns at small angles of LiNO3-P103-nH2O system with different mole ratios. ... 47
xi
Figure 4.12. The XRD patterns of the 2D hexagonal mesophase of LiNO3-xH2 O-P123 system with 6.0, 8.0, 10.0, 12.0 and 15.0 LiCl/O-P123 mole ratios from bottom to top. ... 48 Figure 4.13. The XRD patterns at small angles of LiNO3-P123-nH2O system with different mole ratios. ... 49 Figure 4.14. FT-IR spectra of the LiNO3- xH2O-P123 and P123 (bottom) and LiNO3- xH2O-P103 and P103 (top) with the same salt/pluronic mole ratios. ... 51 Figure 4.15. Micro-Raman spectra of P123 and the LiNO3-xH2O-P123 samples with 6.0, 8.0, 10.0, 12.0 and 15.0 salt/pluronic mole ratios (from bottom to top). ... 52 Figure 4.16. FT-IR spectra of different salt systems (as indicated on the spectra) at various salt/surfactant mole ratios, from bottom to top 6.0, 8.0, 12.0, and 15.0... 54 Figure 4.17. FT-IR spectra of P123, LiCl-xH2O-P123 and LiNO3-xH2O-P123 (bottom) and P103, LiCl-xH2O-P103 and LiNO3-xH2O-P103 (top) with the12.0 salt/Pluronic mole ratios. ... 55 Figure 4.18. (A) Nyquist plots of various samples with 10.0 and 200.0 salt/ surfactant and water/surfactant mole ratios between 1.0x10⁴ Hz and 0.2 Hz. (B) Resistance values were recorded at the point where Zimaginary is equals to zero. ... 57 Figure 4.19. FT-IR spectra of sample with composition 10.0LiCl-200.0H2O-1.0P65, under 25% RH and RT with time. ... 57 Figure 4.20. (A) Nyquist plots of samples with various water/surfactant mole ratios between 1.0x10⁴ Hz and 0.2 Hz, and (B) the correlation between water mole ratio and conductivity. ... 58 Figure 4.21. Typical XRD patterns at small angles of LiI-xH2O-C12EO10 system with (a) 2.0, (b) .03, (c) 4.0 and (d) 5.0 LiI to C12EO10 mole ratio, and a POM image of a LiI-xH2O-C12EO10 sample in the inset. ... 61 Figure 4.22. The XRD patterns at small angles of the LiI-I2-xH2O-C12EO10 mesophases (numbers correspond to mole ratio of LiI, I2, and H2O per mole of surfactant). ... 62 Figure 4.23. The XRD patterns at small angles of LiI-I2-xH2O-C12EO10 with a 0.2 I2 to C12EO10 and 2.0 LiI to C12EO10 mole ratios and a POM image of the sample in the inset. ... 63 Figure 4.24. The UV-vis spectra of 2.0LiI-I2-xH2O-C12EO10 system with 0.0, 0.2, 0.3, 0.4, 0.5 I2 toC12EO10 mole ratios from bottom to top. ... 63 Figure 4.25. The UV-vis spectra of LiI/I2 couple in various solvents. ... 64
xii
Figure 4.26. The UV-vis spectra of LiI/I2 couple in various solvents and 2.0LiI-0.2I2-xH2O-C12EO10 system in water. ... 65 Figure 4.27. Raman spectra of (a) 2.0LiI-xH2O-C12EO10 and (b) 2.0LiI-0.2I2-xH2 O-C12EO10 systems ... 66 Figure 4.28. Correlation between mole ratio of iodine (0.05, 0.1, 0.15 and 0.2 I2 to C12EO10 mole ratio) in the LLC media and absorbance of triiodide. ... 66 Figure 4.29. The XRD patterns at small angles of LiCl-LiI-I2-xH2O-C12EO10 system with LiCl:LiI:I2 mole ratios per mole of surfactant in the inset. ... 68 Figure 4.30. The XRD patterns at small angles of LiBr-LiI-I2-xH2O-C12EO10 system with LiBr:LiI:I2 mole ratios per mole of surfactant in the insets. ... 69 Figure 4.31. The POM images of 2.0LiI-0.2I2-xH2O-C12EO10, 2.0LiI-0.5LiCl-0.2I2 -xH2O-C12EO10, and 2.0LiI-0.5LiBr-0.2I2-xH2O-C12EO10 samples from left to right. ... 70 Figure 4.32. The FT-IR spectra of the LiI-xH2O-C12EO10 samples with different salt/surfactant mole ratios, from bottom to top 1.0, 2.0, 3.0, 4.0 and 5.0. ... 71 Figure 4.33. The FT-IR spectra of samples with compositions: (a) 2.0LiI-0.2I2 -xH2O-C12EO10, (b) 2.0LiI-0.5LiCl-0.2I2-xH2O-C12EO10, and (c) 2.0LiI-0.5LiBr-0.2I2-xH2O-C12EO10. ... 72 Figure 4.34. Raman spectra of the samples with compositions: 2.0LiI-0.2I2-xH2 O-C12EO10, 2.0LiI-0.5LiCl-0.2I2-xH2O-C12EO10, and 2.0LiI-0.5LiBr-0.2I2-xH2 O-C12EO10 from bottom to top. ... 72 Figure 4.35. UV-vis spectra of the samples with compositions: 2.0LiI-0.2I2-xH2 O-C12EO10, 2.0LiI-0.5LiCl-0.2I2-xH2O-C12EO10, and 2.0LiI-0.5LiBr-0.2I2-xH2 O-C12EO10. ... 73 Figure 4.36. I-V curves for the DSSCs employing different kinds of electrolytes under 1 sun illumination (AM1.5, 100 mW cm-2) 2.0LiI-0.2I2-xH2O-C12EO10, 2.0LiI-0.5LiBr-0.2I2-xH2O-C12EO10, and 2.0LiI-0.5LiCl-0.2I2-xH2O-C12EO10 from top to bottom. ... 75 Figure 4.37. I-V curves of the DSSCs by employing water-based and acetonitrile-based of electrolytes under 1 sun illumination (AM1.5, 100 mW cm-2) using the LiI-I2-xH2O-C12EO10 system. ... 76 Figure 4.38. I-V curves for the DSSCs by employing the water-based LiI-I2-xH2 O-C12EO10 gel electrolyte under illumination of different sun levels. ... 77
xiii
Figure 4.39. I-V curves for the DSSCs by employing the water-based LiI-I2-xH2 O-C12EO10 gel electrolyte recorded immediately, after 24 hours, and 4 days later from top to bottom. ... 78
xiv
LIST OF TABLES
Table 2.1. Critical g (shape) parameters for different micellar structures.19 ... 10 Table 2.2. Observed phases, cloud points and CMCs for various poly(ethylene oxide)monoalkylether surfactants.23 ... 12 Table 2.3. Stability of LLC mesophases of various cation-anion couples. Roman numbers means (I) stable LLC phase, (II) no crystallization at low salt concentrations, and little structural order, (III) salt crystallizes out. The symbols indicate (-) not studied, (*) transition to mesocrystalline phase, and LS is low solubility.75 ... 24 Table 2.4. Redox potentials of various I-/I3- systems.84 ... 27
Table 4.1. Phase behavior of the LiCl-xH2O-Pluronics systems at RT and 22-25% RH (H =hexagonal, I = cubic). ... 36 Table 4.2. Phase behavior of LiCl-xH2O-Pluronics systems at RT and 22-25% RH. ... 56 Table 4.3. Photovoltaic characteristics of various DSSCs based on different gel electrolytes. ... 74 Table 4.4. Photovoltaic characteristics of various DSSCs based on LiI-I2-xH2 O-C12EO10 gel electrolyte at different time intervals. ... 77
xv
LIST OF ABBREVIATIONS
LC Liquid Crystal
LLC Lyotropic Liquid Crystal TLC Thermotropic Liquid Crystal CMC Critical Micelle Concentration CPP Critical Packing Parameter
Lα Lamellar H1 Hexagonal I1 Cubic V1 Bicontinuous Cubic L1 Micellar HLB Hydrophilic Balance
HOMO Highest Occupied Molecular Orbital LUMO Lowest Unoccupied Molecular Orbital XRD X-ray Diffractometry
POM Polarized Optical Microscopy FT-IR Fourier Transform Infrared NMR Nuclear Magnetic Resonance
C12EO10 Decaethylene glycol monododecyl ether
SMC Soft Mesocrystal
DRH Deliquescence Relative Humidity
RT Room Temperture
xvi
CB Conduction Band
FTO Fluorine-doped Tin Oxide
FF Fill Factor
SDA Structure Directing Agents CTAB Cetyrimethylammonium Bromide TEOS Tetraethyl Orthosilicate
TLCT True Liquid Crystalline Templating TMS Transition Metal Salt
N719 Di-tetrabutylammonium cis-bis(isothiocyanato)bis(2,2‘-bipyridyl- 4,4‘dicarboxylato)ruthenium(II)
1
CHAPTER 1
1. INTRODUCTION
Some solids can exhibit gradual phase transformation to liquid phase upon heating. At certain temperatures, there is another phase between solid phase and liquid phase for such materials. This phase is called liquid crystalline phase, and in that phase solid can be transformed either birefringed or non-refringed isotropic fluid. In the liquid crystalline phase, the fluid has physical properties between those of a crystalline solid and those of a liquid. Further increase in the temperature leads to disappearance of the birefringed property, and the liquid crystalline fluid transforms into isotropic liquid. During heating, some structural changes can be observed in which molecules still show long-range orientational order in the liquid crystalline phase. First the liquid to liquid crystalline phase transformation takes place when the liquid is cooled back, and then the crystalline solid phase is observed again.
In 1888, the liquid crystalline state of matter was discovered by Austrian botanical physiologist Friedrich Reinitzer. In his experiments, Reinitzer observed that cholesteryl benzoate had two different melting points. He realized that solid cholesteryl benzoate turned into hazy fluid upon heating, and at higher temperatures the material change into transparent liquid. After this discovery, the name liquid crystal was coined by a German physicist Otto Lehmann.
Liquid crystals have many physical properties of liquids such as high fluidity, formation and coalescence of droplets. They also have similar properties with crystalline solids. For instance, they display anisotropy in their mechanical, physical, electrical and optical properties. Liquid crystals can be found both in nature and technological applications. Thermotropic liquid crystals, which exhibit liquid crystalline phase transformation with temperature, are most widely used in liquid crystal displays. Other main application areas of this kind of liquid crystals are thermometers, optical imaging, visualization of radio frequency waves in wave guides, and light modulators. Lyotropic liquid crystals, which exhibit phase transformation with concentration, are ample in living systems such as proteins, living cells and tobacco mosaic virus. Lyotropic liquid crystals are mainly used as
2
electrolytes due to their conductivity. They offer many advantages such as ionic mobility, and rigidity. Therefore, they can be an alternative to solid or liquid electrolytes for solar cell applications.
Briefly, special properties of liquid crystals are still being investigated in order to provide persuasive solutions to various problems. The attention and interest on liquid crystals increases, as the new properties of these materials are investigated and researched.
3
CHAPTER 2
2. BACKGROUND
2.1. Liquid CrystalsLiquid crystals (LC) can be considered as the forth state of matter with distinct features intermediate between solid and liquid. Atoms in crystalline solids have fixed lattice points and oriented in certain directions. As a result of the thermal motion of the atoms, there is some uncertainty in atomic positions. Crystals are optically isotropic if they have a cubic space group, and if not, they become anisotropic with distinct physical properties with respect to different directions in the crystal. In amorphous solids, atoms are spatially disordered, and it can exhibit only short-range order. On the hand, molecules in liquids can change their positions randomly, and there are large fluctuations in atomic positions. Liquids do not exhibit any long-range orientational order, and so they are optically isotropic. Liquid crystals have similar features with both solids and liquids. In the LCs, molecules can flow like in liquids, but they also can be oriented like in solids.
Figure 2.1. An illustration of positional and orientiaonal order in solids, liquid crystals and liquids.
Intrinsic properties of molecules in LCs and temperature play a crucial role in the molecular order in liquid crystals. In contrast to solids, weak forces such as Hydrogen bonding, dipole-dipole interactions or van der Wall‘s forces act on liquid crystals.1 Thus, understanding the nature of weak forces of the soft chemistry has significance in order to figure out the self-assembly process of living organisms.
4
Liquid crystals can be divided into thermotropics and lyotropics. Thermotropic liquid crystals can form liquid crystalline phase at certain temperature ranges and their phase transition is a function of temperature. Calamitic (rod-like) and discotic (disk-like) are two main sub groups of thermotropic liquid crystals. Calamitic liquid crystals have a rod-shape structure in which one molecular axis is much longer than the other two. Discostic liquid crystalline mesophases are obtained with disk-like molecules where the director is perpendicular to the molecular plane.
Figure 2.2. Schematic representation of calamitic and discoitc liquid crystalline molecules.
Calamitic liquid crystals have a rigid center which maintains its alignment on the orientational direction. They have also flexible parts at each end in order to strengthen weak forces and intra-molecular interactions.
Discostics have disk-like building blocks with a rigid aromatic core and peripheral flexible chains. In contrast to calamitic liquid crystals, the z-direction of a discostic liquid crystal is shorter than the xy plane. The weak molecular interactions both in the z-direction and xy plane play crucial role in the self-assembly process of discostic liquid crystals.2
Thermotropic liquid crystals exhibit nematic (N), smectic (S) and cubic mesophases.3 Calamitic liquid crystals tend to form smectic mesophases whereas discostic ones prefer to self-organize into columnar mesopahses. The nematic phase is the least ordered phase in which the rod-like or disk-like molecules line up parallel to each other along a direction defined as n, and there is no long-range translational order.4 In smectic phases, molecules are parallel to each other, and they are arranged in layers with long axes parallel to the layer plane. Therefore, smectic phase are positionally ordered along one direction, and
5
smectic phases can be found at lower temperature than the nematic phase.5 In more viscous columnar phases, molecules stack on top of each other into columns, and the columns are arranged into a two-dimensional lattice.4
Figure 2.3.1 Schematic representation of nematic, smectic and columnar phases
from left to right.4
In contrast to thermotropics, lyotropic liquid crystals (LLC) are formed by at least two components, a surfactant and a solvent. In addition to the temperature, LLCs have another degree of freedom which is concentration. This additional degree of freedom leads to formation of a rich variety of new structures.7-11 Molecules which contain both hydrophilic (water-like) and hydrophobic (lipid-like) groups can exhibit LLC behavior by forming aggregates when put into an appropriate solvent. These molecules that have both hydrophilic and hydrophobic parts are called as amphiphilic molecules. Surfactants are amphiphiles so they have a tendency to decrease surface tension of the water in an aqueous media.12
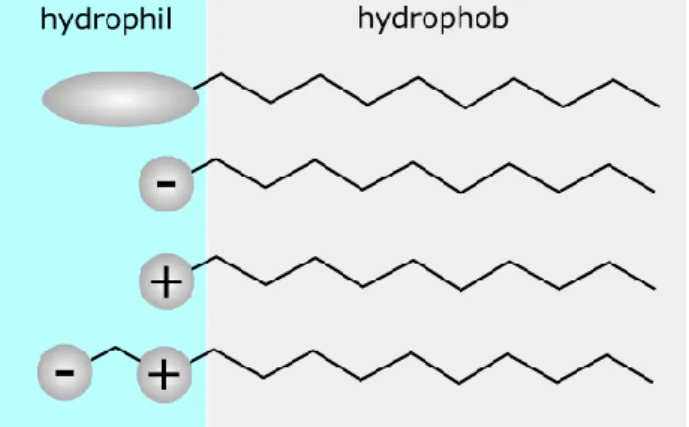
Surfactants can be classified as their charge properties; surfactants which bear no charge in a solvent is named as non-ionic surfactants, which bear charge are called as cationic, anionic or zwitterionic surfactants depending on the sign of the charge on their hydrophilic parts, see Figure 2.4.
1
Reprinted fromSergeyev, S., Wojciech P., and Yves H. G., Discotic liquid crystals: a new generation of organic semiconductor Chemical Society Reviews 36, 1902-1929, (2007), with permission from The Royal Society of Chemistry.
6
Figure 2.4. Schematic representation of non-ionic, anionic, cationic and zwitterionic surfactants from top to bottom.
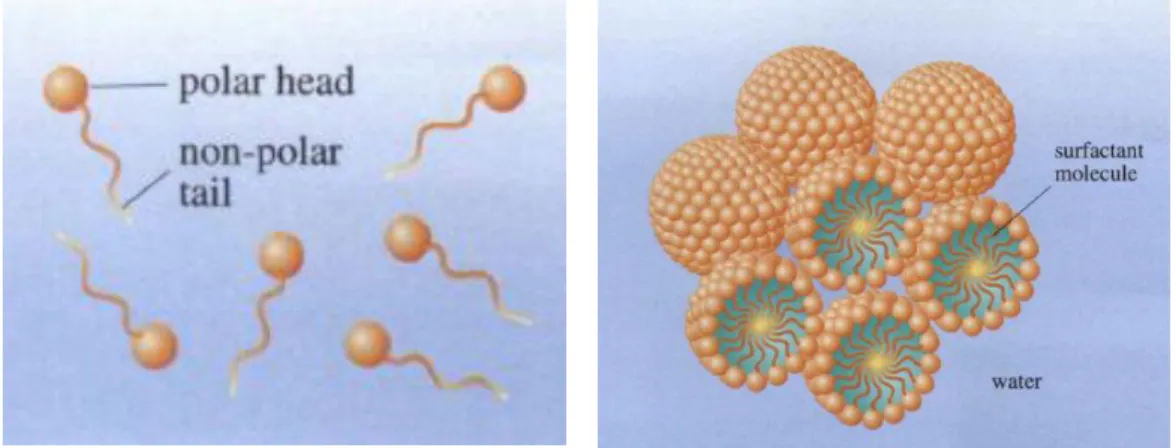
Surfactants are surface active molecules, and they can be adsorbed at the water-air interface in order to reduce surface free energy. Surfactants can interact selectively with the different sides of the interface by using its hydrophobic and hydrophilic parts. The phase behavior of surfactants depends mainly on the concentration. At very low concentrations, surfactant molecules tend to move toward the water-air interface. The hydrophobic parts tend to stay away from the water in order to reduce interaction with water; however, the hydrophilic parts are hydrated by water molecules. When the concentration increased, the surfactant molecules start to form spherical aggregates. These aggregates are called as micelles, and the formation of micelles is related to intermolecular interactions of the surfactant molecules. The hydrophilic parts of a micelle tend to forms hydrogen bonds with water molecules. This leads to disruption of the hydrogen bonding network of water molecules. As the hydrophilic regions of water molecules come close to each other, they tend to share the same shell of the hydrogen bonding network. This situation is not energetically favorable due to the presence of excess water molecules. This causes repulsion between hydrophilic parts of the surfactant, and they tend to keep away from each other. On the other hand, hydrophobic parts cannot interact with water molecules, and this causes hydrophobic interaction between alkyl chains of the surfactant.13-15 As a result of both hydrophilic repulsion and hydrophobic attraction spherical micelles are formed at critical concentrations, see Figure 2.5.
7
Figure 2.5.2 Schematic representation of surfactant molecules (left) and micelles
(right) in water.
The concentration where the surfactants start to form micelles is called critical micelle concentration (CMC). It depends on the nature of the surfactant, the nature of the solvent, temperature, and additives in the media. Further increase in the surfactant concentration above the CMC increases the number of micelles in the solution. At high surfactant concentrations, the micelles become densely packed, and they start to interact with each other via repulsive electrostatic forces.16 As a result of intermicellar interactions, micellar domains form ordered mesostructures. Therefore, the viscosity of the solution increases drastically, and the liquid crystalline phase can be observed.
2.1.1. Lyotropic Liquid Crystalline Mesophases
The distance between micellar units becomes shorter with increasing surfactant concentration; thus, different lyotropic liquid crystalline phases occur due to the hydrophobic effect caused by the long-range repulsive forces between micellar interfaces. Repeating micellar units can form either lamellar (Lα) or hexagonal (H1) mesophases which have planes or axes of repeating
unit, respectively.17 There are four different type of LLC mesophases.
The simple cubic phase (I1) has globular micellar structure so it is less
viscous and less freely flowing than lamellar or columnar mesophases. In this phase, spherical micelles can form body-centered cubic (bcc, Im3m), face-centered cubic (fcc, Fm3m) or clathrate (Type I, Pm3n) packing.17
2
Reprinted from Giles Clark, The third Dimension (The Molecular World) (First Edition) 227 (The Open University, 2002) with permission from The Royal Society of Chemistry.
8
The hexagonal phase (H1), -the subscript denotes if the phase is normal (1)
or inverted (2)- is consists of dense packing of cylindrical micelles, arranged on a 2D or 3D hexagonal lattice. It can be identified by a characteristic fan texture under the polarized optical microscope because of the focal conic domains. This phase has intermediate viscosity between discrete micellar and bicontinuous cubic phases.17
The bicontinuous cubic phase (V1) is very viscous so it can be almost solid
in some cases. It exhibit cubic symmetry and does not display optical textures. This phase is structurally wrapped lamellar phases, and the network has both positively and negatively curveted regions.17
a) b)
c) d)
Figure 2.6.3
Schematic representation of (a) simple cubic (I1), (b)
2D-hexagonal (H1), (c) bicontinuous cubic (V1) and (d) lamellar (Lα)
mesophases.18
The lamellar phase (Lα) has parallel surfactant bilayers that are separated
by water rich regions. The α subscript refers to the molten chains in this phase. It has characteristic X-ray spectra with scattering peaks in the ratio 1:2:3, related to the inter bilayer spacing. Like other anisotropic phases, it can
3
Reprinted from Cevc, G., and Holger R., Lipid vesicles and membrane fusion Advanced Drug
9
be identified by the distinct optical texture. The characteristic texture of this phase is streaky or mosaic-like.17
The transitions between these phases are in the following order with increasing surfactant concentration: L1(micellar) I1 H1 V1 Lα. The
length, structure and nature of the hydrophobic chains, the nature and the charge on the hydrophilic regions, electrolyte concentration, temperature and pressure can also affect the structural preference.18
Repulsive interactions at the hydrophilic regions, attractive interactions between hydrophobic moieties at the core-shell interface in order to reduce unfavorable interactions with the solvent molecules and repulsive interactions of alkyl chains in the core are three major forces acting on the surfactant molecules.5 These three forces determine the dimensionless shape parameter, g, which is very beneficial to predict morphology and topology of mesophases. Shape parameter can be defined in terms of the area per surfactant molecule at the head-group chain interface, a, the chain length of the molecule, l, and the effective hydrocarbon volume, ν.5
(eqn. 1)
Figure 2.7.4 Schematic representation of a surfactant molecule as an
ice-cream cone.19
4 de AA. Soler-Illia, G. J., Sanchez, C., Lebeau, B., & Patarin, J., Chemical strategies to design textured materials: from microporous and mesoporous oxides to nanonetworks and hierarchical structures Chemical Reviews, 102(11), 4093-4138 (2002), with permission from American Chemical Society.
10
The shape parameter defines the volume scaling for a fixed area as a function of the alkyl chain length, and it is characteristic for the amphiphiles in the aggregate in terms of an average block shape. Therefore, the shape parameter is defined as the critical packing parameter (CPP).16 CPP is less than 1/3 for spherical micellar units, while it is 1/2 for cylinders (hexagonal phase), and it is at around 1 for lamellar structure. It is required to have higher than 1 CPP value in order to obtain inverted structures, where hydrophobic from the shell and hydrophilic groups from the core.16
Table 2.1.5 Critical g (shape) parameters for different micellar structures.19
Note that the validity of this concept depends on the complete study on various parameters including surfactant nature, pH, and presence of cosurfactants or cosolvents. Moreover, a constant temperature is required for these structural considerations, since the hydrophilicity of molecules in the micelle changes with temperature.19-22
2.1.2. Binary Systems of Poly(ethylene oxide) Type Surfactants (CmEOn+H2O)
The poly(ethylene oxide)monoalkylether surfactants are consist of an alkyl chain attached to a hydrophilic ethylene oxide unit. CnEOm is used as the
shorthand representation for poly(ethylene oxide)monoalkylether surfactants where n represents the total number of carbon atoms in the alkyl chain, and m stands for the total number of ethylene oxide units on the hydrophilic head group.
The phase behavior of CnEOm type nonionic surfactants has been extensively investigated in various solvents such as aqueous solutions,23 room temperature ionic liquids,24 supercritical carbon dioxiode,25,26 and organic sovents.27-29 Studying the phase behavior of this type surfactants is
5
de AA. Soler-Illia, G. J., Sanchez, C., Lebeau, B., & Patarin, J., Chemical strategies to design textured materials: from microporous and mesoporous oxides to nanonetworks and hierarchical structures Chemical Reviews, 102(11), 4093-4138 (2002), with permission from American Chemical Society.
11
significant due to their wide application areas.30-35 By changing the chain length of the alkyl and the ethylene oxide units one can control the hydrophilic balance (HLB) of the surfactants. As the number of carbon atom increase in both the alkyl chain and ethylene oxide unit, the efficiency of the surfactant increases.36 Therefore, a liquid crystalline region can be observed in the phase diagrams of more efficient surfactants. Generally, micellar (normal or inverse), hexagonal (normal or inverse), cubic (normal or inverse) are common liquid crystalline phases in these diagrams.
Figure 2.8.6 Phase diagram of C
10EO6-H2O system at 1 atm.37
Figure 2.8 indicates a typical T-X phase diagram of C10EO6 and H2O mixture where various mesophases occurs with respect to changing in the CPP. L1 H1 V1 Lα transformation is observed with increasing
surfactant concentration. These phase diagrams can be constructed by using
6 Reprinted from Nibu, Yoshinori, and Tohru Inoue, Phase behavior of aqueous mixtures of some polyethylene glycol decyl ethers revealed by DSC and FT-IR measurements Journal of colloid and
12
different techniques including X-ray diffractometry (XRD), polarized optical microscopy (POM), differential scanning calorimetry (DSC), Fourier transform infrared (FT-IR) spectroscopy, and nuclear magnetic resonance (NMR).
Tiddy and coworkers investigated phase diagrams of the binary C10EO6 -H2O system. The chain length of the alkyl and the ethylene oxide units were varied from 8 to 16 and 3 to 12 respectively so they were able to monitor the impact of the chain length of hydrophilic and hydrophobic parts on the phase behavior.38 They observed that Lα phase exists for EOm where m<5, and I1
phase is dominant when m>8. The reason is that increase in the ethylene oxide chain length leads to an increase in the cross-sectional area; therefore structures with higher interfacial curvatures become more favorable. On the other hand, I1 H1 V1 Lα phase transitions is observed with increasing
temperature since decrease in the cross-sectional area causes an increase in intermicellar repulsions. Another factor can be dehydration of ethylene oxide chain with temperature leads to breakdown of water around hydrophilic region.39-40
Table 2.2.7 Observed phases, cloud points and CMCs for various poly(ethylene
oxide)monoalkylether surfactants.23
7
Dong, Renhao, and Jingcheng Hao, Complex fluids of poly (oxyethylene) monoalkyl ether nonionic surfactants Chemical reviews 110, 4978, (2010), with permission from American Chemical Society.
13
2.1.3. Effect of the Additives on CmEOn-H2O Systems
An additive can considered as a variable which changes the g parameter. Generally, the head group repulsions between the ionic surfactants decreases by the addition of ions into the solution. On the other hand, the effect of electrolytes is quite different for nonionic surfactant systems, and this effect generally follows the Hofmeister series of ions.
In 1881, Hofmeister and Lewith indicate that the precipitation of proteins with various salts related to concentration of ions, and anions have greater impact than the cations.42 However, there is not any certain explanation for the behavior of the anions in the molecular level.
For the anions:
SO42- > HPO42- > CrO42- > CO32- > F- > Cl- > Br- > NO3- > I- > CIO4- > SCN- For the cations:
K+ > Na+ > Li+ > Ca2+ > Guanidium
The ions on the left side of the Hofmeister series is called as kosmotropes, and they reduce the solubility of organic compounds in water (salting-out) due to their tendency to enhance hydrogen bonding network of water.43 Therefore, kosmotropes are considered as structure-makers. However, the ions on the right side tend to break down water clusters so water molecules hydrate the hydrophilic segments, and the overall solubility increases (salting-in). These ions are called as chaotropes or structre-breakers.
The Hofmeister series has also strong effect on the solubility of many organic compounds including surfactants in addition to proteins. For instance, the CMC and cloud point of poly(ethylene oxide) surfactants follow the Hofmeister series. The cloud points of CmEOn surfactants decreases with the order: F- > Cl- > Br-. 44-45 The reason is that water molecules that are closer to the hydrophilic part have a tendency to interact with each other instead of forming hydrogen bonds with hydrophilic ethylene oxide units if the water structure does not break down. Thus, the kosmotropes leads to an extension in the dehydration of ethylene oxide units, and so the cloud points drop.
The effect of cations on the phase behavior of C12EO7-H2O system was investigated by Zheng and coworkers.46 By mixing 1.0 M of LiCl, NaCl and CsCl salts with C12EO7 various percent of salt solutions were obtained, and
14
different phase diagrams were plotted on the same graph, see Figure 2.9. The presence of smaller cations causes the expansion of Lα phase. The influence
of the cations is related to the hydration capability of the ions.
Figure 2.9.8 Phase diagrams of C
10EO6-H2O systems in the presence and the absence of salts. The salt species none (circles and straight line), LiCl (squares and dotted line), NaCl (triangles and dashed line) and CsCl (diamonds).45
Li+ has the strongest hydration due to its smaller size, but the weakest hydration is expected for Cs+. Thus, the largest amount of water is required for the hydration of Li+, and the hydration of the ethylene oxide units follows this trend: Cs+ < Na+ < Li+. The effective cross sectional area reduces with the dehydration of the ethylene oxide chains so CPP of the surfactant molecules increases. As a result, the region that belongs to Lα phase expands in the
diagram with higher CPP values.
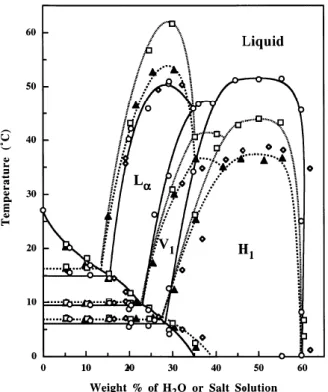
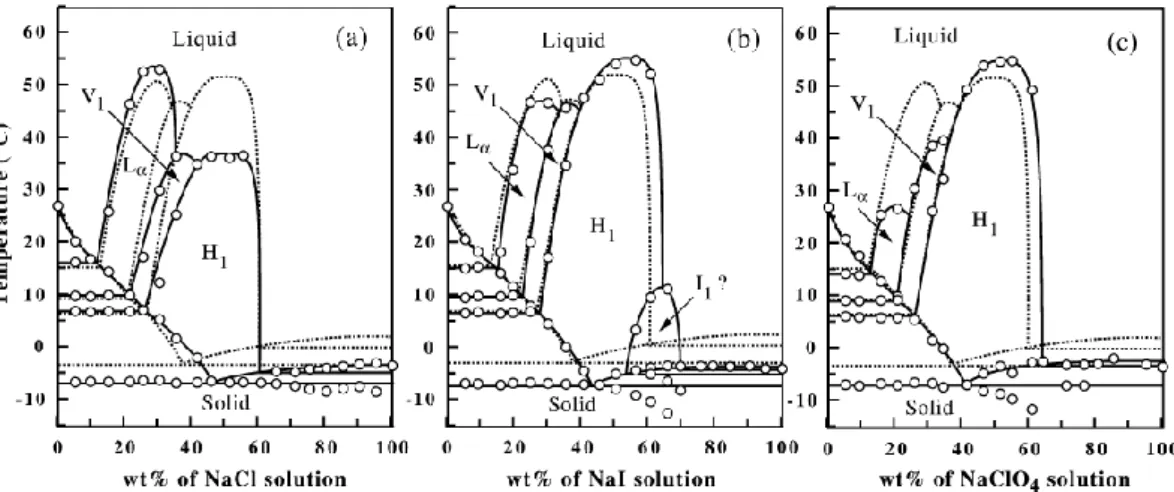
The anion effect on the phase behavior of C12EO7 system was investigated by Inoue and coworkers.47 In this case, 1.0 M of NaCl, NaI and NaSCN salts
8 Peprinted from Zheng, Li Qiang, et al., "Effect of inorganic salts on the phase behavior of an aqueous mixture of heptaethylene glycol dodecyl ether" Langmuir 19, 10487-10494 (2003), with permission from American Chemical Society.
15
were mixed with surfactants at different weight percent of salt solutions. It was observed that H1 region expands with ClO4- and I- anions, but it shrinks with Cl- ion, see Figure 2.10. This observation is related to the dehydration of the ethylene oxide chains. The effective cross sectional area per surfactant molecule decreases as a result of the dehydration of ethylene oxide units which is caused by the structure-maker ions, and the structure-breaker ions have the opposite impact.
Figure 2.10.9 Phase diagrams of C12EO
7 with various Na+ salts. The dashed lines corresponds to the salt free phase diagram.47
In the investigation of phase behavior of nonionic surfactants, the salts were usually considered as additives, and their influence on the phase behavior and the cloud points were studied generally at low concentrations. A detailed study of LLC mesophases at high salt concentrations have never been performed until 2001.48 On the other hand, salts can be the main component of surfactant self-assembly at high concentrations. This argument will be investigated on the upcoming chapters.
9
Reprinted from Inoue, Tohru, Yusuke Yokoyama, and Li-Qiang Zheng, Hofmeister anion effect on aqueous phase behavior of heptaethylene glycol dodecyl ether. Journal of colloid and interface
16
2.2. Lyotropic Liquid Crystals in the Synthesis of Novel Materials
According to IUPAC definition, inorganic solids having pore size in the range of 2 to 50 nm are called mesoporous materials.49 Ordered mesoporous materials have high functionality as a result of their high surface area (ca. 1500 m2/g).50 Therefore, they become great candidates as catalysts or adsorbents for selective chemical reactions. They can also be considered as anti-quantum dots or anti-quantum rods due to their nano-scale geometries. Therefore, they represent transport properties and size effects which make them as good candidates for novel optical, electrical and magnetic devices.51
In 1992, Kresge and coworkers discovered ordered mesoporous silica.52 Hexagonal (MCM41), cubic (MCM-48), and lamellar (MCM-50) mesoporous materials were produced via cetyrimethylammonium bromide (CTAB) as structure directing agents (SDA) and tetraethylortosilicate (TEOS) as the polymerizing component.53 Hydrophilic surface of the micelles provide a reaction media for the silica precursor. During the reaction, silica particles surround these micelles, and newly formed binary structure condenses to form mesostuructured materials. The surfactant molecules are removed by calcinations in order to from the porous structure.
There are two main approaches in the synthesis of mesostructured and mesoporous materials, see Figure 2.11. The first approach is cooperative self-assembly (CSA) method where the inorganic precursors and surfactants are mixed and self-assembled into an ordered pseudo-LC phase. After the formation of LC phase, further polymerization and condensation of the inorganic species are required to form more rigid framework that can be calcined to obtain mesoporous materials.54 The second approach is true liquid crystalline templating (TLCT) method. A solution of surfactants, inorganic precursor and solvent is spread over a glass substrate and LLC film is obtained by the evaporation of the solvent. In this approach, the inorganic framework exactly mimics the liquid crystalline template. However, in the cooperative self-assembly approach the final structure cannot be predicted since the final structure is constituted via coactions of the initial precursors. This is the main difference between these two approaches. Another main difference is that in the
17
CSA method the reaction carried out in a dilute micelle solution, while in the TLCT method the synthesis is directed by the LLC phase.54
Figure 2.11.10 Two different approach in the synthesis of mesoporous materials:
(A) Cooperative self-assembly and (B) True LC templating process.54
In 1995, TLCT method was introduced first by Attard and coworkers, 55 and the pathway was extended to block copolymer type surfactants.56 Hydrogen-bonding network of interactions between the polymerizing inorganic species and ethylene oxide groups of the self-assembled surfactant domains stabilized the LLC mesophase, and further condensation of the inorganics in the hydrophilic domains of the LLC phase makes the mesophase into mesostructured solid. Therefore, strong interactions between inorganic precursors and surfactant molecules are required in order to assemble metal containing structures, otherwise the metal precursors can be leach out or phase separate into surfactant rich domains and salt crystals.55
Mesoporous silica synthesis has attracted much attention since it has unique properties and well-known sol-gel chemistry of silica allowed controlled synthesis.50 In contrast, nonsilicaeous materials are more difficult to synthesis and the synthesis mechanism is not well understood. For example, LLC films are
10 Reprinted from Wan, Ying, and Dongyuan Zhao On the controllable soft-templating approach to mesoporous silicates. Chemical Reviews 107, 2821-2860, (2007), with permission from American Chemical Society.
18
exposed to H2S gas in order to synthesize metal sulfides.57,58 In the reaction, nanoparticles of metal sulfide is produced which can mimic the LLC template. High metal concentrations in the LLC phase are necessary to synthesize a macroscopic film of the mesoporous material. Therefore, it is important to explore the salt-surfactant LLC mesophases for the synthesis of new and advanced porous materials.
2.3. Salt-Surfactant Liquid Crystalline Systems
The transition metal nitrate salt (TMS, [M(H2O)n](NO3)2) and nonionic surfactant (oligo(ethylene oxides) or pluronics, triblock-copolymers) lyotropic liquid crystalline phases have been discovered in 2001 by our group.48,59 The first row transition metal ions such as Co2+, Ni2+, and Zn2+ and some second row transition metal ions such as Cd2+ in their hexa- or tetra-aqua complexes were used to form LLC mesophases with various counter-ions (X-) such as chloride, perchlorate and nitrate. The new salt-surfactant LLC mesophases have significantly high metal ion concentration when compared to water-salt-surfactant systems.48 Stable salt-surfactant LLC phase can be obtained up to 3.2 salt/surfactant mole ratio with many nitrate salts. The difference is nearly 4 folds between these salt-surfactant systems and the water-salt-surfactant systems. The salt content of these systems can be as much as 60 w/w%, and it can be further increased by adding a charged surfactant60 or using pluronic type surfactants instead of oligo(ethylene oxides).59
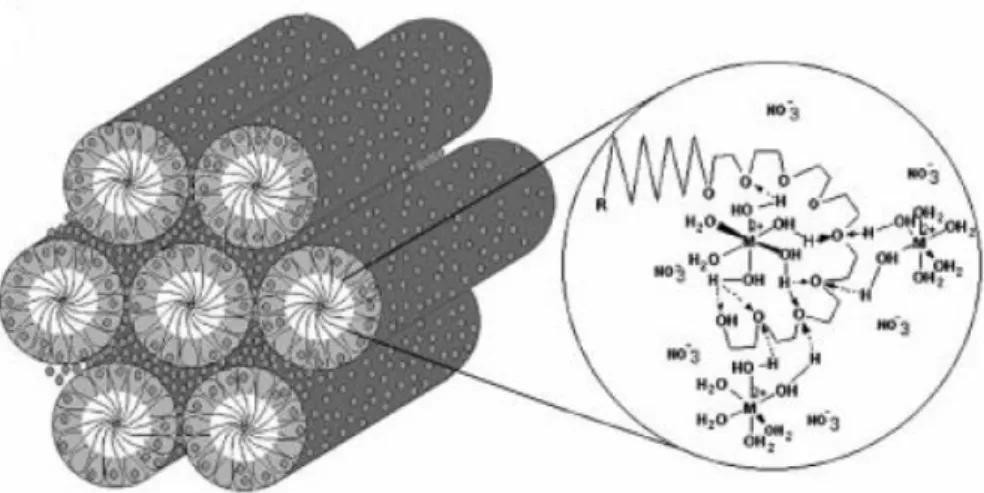
The strong hydrogen bonding between the coordinated water molecules of the TMS species and hydrophilic ethylene oxide chain of the surfactant is the driving force for the formation of the LLC phase, see Figure 2.12.48 This interaction in considerably higher than the one in the water-surfactant systems.48 As a result of this strong hydrogen bonding interaction, the salt-surfactant systems have higher isotropization temperatures where the H1 phase can be
observed up to 110 o C.
Controlling the quantity of the salt and the type of counter ion allows one to control the structure of the salt-surfactant LLC mesophases. Generally, the nitrate salts form an hexagonal LLC phase, whereas the perchlorates usually form cubic mesophase.59-61 In the nitrate systems, the overall charge decreases
19
due to the coordination of nitrate to the metal centers and so the solubility increases.48 On the other hand, only Co2+ can from an LLC mesophase with chlorides. In this system, the tetrachlorocobaltate ion (CoCl42-) is formed as a result of coordination of chlorides to the metal center.61 The LLC mesophases, where the counter ion is sulfate are not common since the sulfate salts are insoluble in small amount of water in the LLC media.48
Figure 2.12.11 Schematic representation of hydrogen bonding interactions
between coordinated water molecules and the ethylene oxide chain in a hexagonal LLC mesophase.48
In 2005, Dag et. al. extended the salt-surfactant LLC mesophases to Pluronic type triblock copolymers (OH(CH2CH2O)n-(CH(CH3)CH2O)m -(CH2CH2O)n-H).59 The pluronic-salt mesophasess have larger variety of phases including tetragonal and lamellar in addition to hexagonal and cubic phases.59 A phase separation was observed in the Co2+ systems of pluronics due to oxidation of the surfactant.62 Pluronics, in the cobalt salt-pluronic mesophases, undergo slow oxidation in the presence of Co2+ and oxygen and cause phase separation as salt rich LLC mesophase and an disordered salt free macro domains. All other metal salts form stable LLC mesophases with pluronics. The salt-surfactant mesophases have also been used as templates for the synthesis of mesoprorous materials.58,63-65
11
Reprinted from Özgür Çelik, and Ömer Dag, A new lyotropic liquid crystalline system: oligo(ethylene oxide) surfactants with [M(H2O)n]Xm transition metal complexes. Angewandte
20
The salt-surfactant-water ternary mixtures were also used as templates in the synthesis of mesostructured silica monoliths. In these systems, the salts were chosen among noble metals such as H2PtCl6, AgNO3 and HAuCl4.68 Metal nanoparticles were produced by the reduction of noble metal in the silica network. Moreover, the mesostructured metal sulfide films were produced by exposing spin coated LLC samples over a glass substrate to H2S gas.57,58 Later, Dag and coworkers increased the metal-uptake of the salt-surfactant systems up
to 80 w/w% of salt by using charged surfactants such as
cetyltrimethylammonium bromide (CTAB) or sodium dodecylsulfate (SDS).60,67 In these mesophase, the charged surfactants do not leached out as a result of the long-range columbic interaction between the salt species and the charged core-shell interface of the mesophase. Therefore, it is possible to synthesize stable mesostructures metal sulfide films having higher salt ratios.64
Figure 2.13.12 Phase diagram of the ZnX-C12EO
10 system.68
The [Zn(H2O)6](NO3)2)-C12EO10 mesophase has been investigated extensively in order to clarify the perspective on the salt-surfactant systems of
12
Reprinted from C. Albayrak, N. Özkan, and Ö . Dag. Origin of Lyotropic Liquid Crystalline Mesophase Formation and Liquid Crystalline to Mesostructured Solid Transformation in the Metal Nitrate Salt−Surfactant Systems. Langmuir 27, 870-873, (2010), with permission from American Chemical Society.
21
the first row transition metals.68 The phase diagram of the [Zn(H2O)6](NO3)2 )-C12EO10 was constructed by using DSC, POM and XRD techniques, see Figure 2.13.68
The phase diagram of the salt-surfactant and water-surfactant are very similar. The V1, H1, I1 and L1 phases were observed with increasing the salt
concentration. However, the salt-surfactant mesophase shows an unusual behavior at low temperatures, and it displays glass transition at -52 oC.68 Furthermore, the LLC mesophase freezes into a mesostructured solid below the glass transition temperature.68 This work proved that in the [Zn(H2O)6](NO3)2 )-C12EO10 system, the salt species are in the molten phase and they act as solvent in the media.68
In 2012, Dag and coworkers further extended salt-surfactant mesophases to non-transition metal salts. They proved that the LiNO3, LiCl and LiClO4 salts can also form LLC mesophases with the oligo(ethylene oxide) type surfactants in the presence of a small amount of water.69 In these mesophases, the hydrated alkali metal salts acts as a solvent in the assembly process. Therefore, the highly concentrated solution of electrolyte can be regarded as an analogue of a molten salt.68 In the LLC mesophase of LiNO3, the salt to water mole ratio can be nearly 2 times lower than the one in the saturated LiNO3 aqueous solution.69 The reason of this is due to the interaction between the salt-water couple and ethylene oxide chain, and confinement effect (the melting point depression of the salts in the confined hydrophilic domains of the mesophases). The confinement effect enforces the formation of the LLC mesophase through hydrogen bonding (M-OH2---(OCH2CH2)x-R) and more improtantaly depress the melting point of the salt that acts as a good solvent in the media.69 Moreover, the hydrated alkali salt-surfactant LLCs display high ionic conductivity (7.0 x10⁻³ S cm-1) so they can be considered as good electrolytes for the non-water-sensitive electrochemical applications.69
22
2.4. A New Phase Transition in LLC Systems
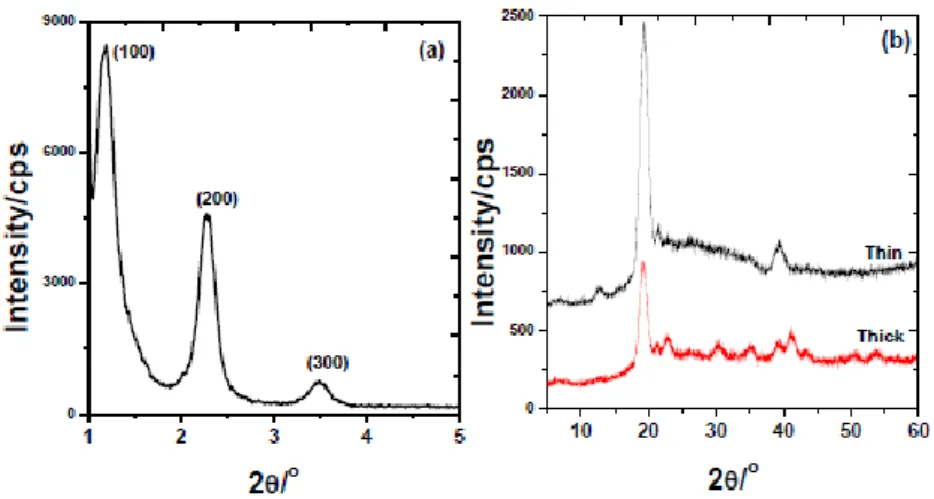
In the LLC mesophases of hydrated salt-surfactant systems of LiI, CaCl2 and MgCI2 another unusual phase transition from LLC mesophase to soft mesocrystal (SMC) phase was observed under ambient condition by our group.70-71 The mesocrystals are usually solid materials that are formed as a result of self-assembly process of colloidal nanocrystals.72 They can be synthesized through several steps; by chemical reactions to form nanoparticals,73 and then directed and organized by the organic directing agents.74 Recently, we also observed the formation of soft mesocrystals (SMC) from these three salt systems. The SMC samples display both small and high angle diffractions, and unit cell of the samples becomes larger than those of their LLC mesophases, see Figure 2.14.
Figure 2.14. XRD patterns of the 4.0LiI-xH2O-C12EO10 mesocrystal at (a) low angles, and (b) high angles.71
The FT-IR spectra of the mesocrystalline samples have some distinct properties when compared to the spectra of the LLC mesophases, Figure 2.15. All the peaks in the spectra become sharper; in addition to that, some of the surfactant peaks split into two, and some new peaks arise.
23
Figure 2.15. FT-IR spectra the 4.0LiI-xH20-C12EO10 mesocrystal (top) and LLC mesophase (bottom) at different wavenumbers.71
Two new peaks arise at 1274 and 1339 cm-1 which correspond to the CH2 twisting mode and CH2 rocking mode of the trans C-O bond in the ethylene oxide domain, respectively. This has been regarded as the expansion of the surfactant domains upon phase transition from LLC mesophase to SMC phase, and it is consistent with the changes in the XRD patterns of these samples. The water peaks get sharper and the intensity of 4 resolved water signals demonstrate that the SMC samples do not lose water during phase transition.71
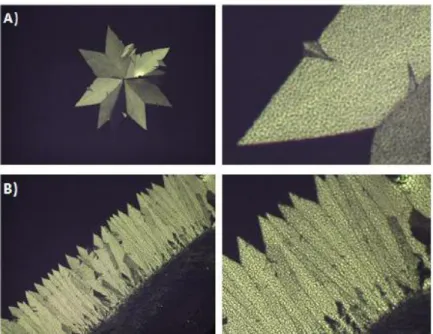
Figure 2.16. POM images of 4.0CaCl2-xH20-C12EO10 mesocrystal Mesocrystal growth from (A) defect site mesophase (B)edge of the sample (magnified images on the right).71
24
The POM images of mesocrystal samples display birefirengent and sharp edged texture like in the crystal textures, see Figure 2.16. In contrast to normal crystal texture, there is some sponge like texture in the birefringent domains.
According to our recent investigation, the mesocrystal formation is related to the temperature and relative humidity in the air. Above 25% RH mesocrystals transform into LLC phase at RT. At higher salt concentrations, the mesocrystal formation is observed at lower RH. For example, in the 5.0-8.0 mole ratios, the mesocrystal are stable at 20 % RH; however, between 3.0 and 5.0 mole ratios 15% RH is required to observe mesocrystals both at RT.76-77 These samples can change birefringency, and be used as humidity sensors due to their sensitivity toward relative humidity.
2.5. Effect of Deliquescence on the Stability of LLC Mesophases
There is a strong relationship between the formation and stability of LLC mesophases and the deliquescence relative humidity (DRH) of the salts.76 According to our recent findings, the salts can be categorized into three different groups: type I salts can from stable LLC phase because of their low DRH, type II salts have intermediate DRH and form LLC mesophases with little or no structural order, and Type III salts leach out salt and surfactant, and cannot form stable LLC mesophase due to their high DRH.70,75 Therefore, the DRH is a critical value for the salts, where the salt spontaneously absorbs water in the air and dissolves.76
Table 2.3. Stability of LLC mesophases of various cation-anion couples. Roman numbers means (I) stable LLC phase, (II) no crystallization at low salt concentrations, and little structural order, (III) salt crystallizes out. The symbols indicate (-) not studied, (*) transition to mesocrystalline phase, and LS is low solubility.75
25
Table 2.3 shows that the LiCl, LiNO3, LiBr, LiI, CaCl2, CaNO3 and MgCl2 salts can form stable LLC mesophase with non-ionic surfactants although the CaCl2-nH2O-C12EO10, LiI-nH2O-C12EO10 and MgCl2-nH2O-C12EO10 mesophases undergo mesocrystalline phase transformation upon aging. However, the Na(I) salts, K(I) salts, and Mg(II) salts, are unstable and crystallize rapidly upon spin coating, except NaI, NaClO4, KSCN and MgCl2. LiClO4 salt cannot form stable mesophase with C12EO10 surfactant, but it can form stable LLC mesophase with C18EO10 between 1.0 and 3.0 salt to surfactant mole ratios.75
The trends among different salts depend on the deliquescence relative humidity of the salts. Li(I) salts have lower DRH values than Na(I) and K(I) salts. The DRH levels of Li(I) salts are lower than 20%, which is below the experimental conditions, 20-25%.75 This may explain the stability of LLC mesophase containing Li(I) salts. The chloride salts of Ca(II) and Mg(II) have lower DRH (33%-31%) compared to nitrate salts (52%-51%). Therefore, the Mg(NO3)2-C12EO10 samples crystallize rapidly after spin coating, whereas the LLC mesophase of the Ca(NO3)2-C12EO10 is stable. This indicates that the interactions between the divalent cation and hydrophilic part of the surfactant are stronger compared to monovalent cations.75 Other factors such as the salt concentration, temperature, pressure, hydrophilicity, and relative humidity can also affect the phase behavior of hydrated salt-surfactant systems. For this reason, further investigation is required to completely elucidate the nature of such systems and their stability.
2.6. Electrolytes for Dye-Sensitized Solar Cells
Dye-sensitized solar cells (DSSCs) are photovoltaic devices that provide a maximum power conversion efficiency of around 12%.77,78 They attract significant attention since they can be produced with a lower cost than their solid-state alternatives, and they are more environment-friendly.
The working principle of the dye-sensitized solar cells is based on using photons to separate charges (electron-hole pairs). A dye that is attached to a