Journal of Education and Future year: 2018, issue: 13, 95-119
An Anthropological Analysis of the Knowledge on Graphics
within Middle School Mathematics
*
Nazlı Akar
**Filiz Tuba Dikkartın Övez***
Abstract
The aim of this study is to analyze the knowledge on graphics within middle school mathematics from an anthropological perspective. The study, which was carried out in framework of the Anthropological Theory of the Didactic, conducted a document analysis with the purpose of determining the institutional qualities of middle school mathematics. In this context, the study examined a variety of documents including mathematics curriculums that are used in Elementary Mathematics Special Teaching Methods institutions in addition to middle school mathematics course books, books on mathematics instruction, and the notes taken by faculty members. The data that were obtained from document analysis were analyzed with ecological and praxeological approaches. Based on the ecological approach, the study identified the qualities of institutional recognition by revealing the habitat and function (niche) of the graphic knowledge in its institution, while the praxeological approach revealed the mathematical organizations consisting the types of graphic-related tasks in the institution, techniques, the technologies that explain the technique, and the theories which explain and defend the necessity of the technology. The study concluded that the use of graphics as a goal, a tool, and both as goal and tool the institution was addressed to the instruction of subjects (ratio and proportion, percentage, curves, equations and inequalities, equation systems, functions, statistics, and probability) in numbers and operations, algebra and data processing learning fields, for the improvement of mathematics literacy, problem-solving, communication, association, and psycho-motor skills. The research institution employed three mathematical organizations (graphic reading and interpretation, graphic creating, making appropriate conversions between graphics) including 11 types of tasks in total.
Keywords: Anthropological Theory of the Didactic, ecological approach,
graphic, praxeological approach
* This work was supported by the project of 2017/05, which was accepted by the Balıkesir University Scientific Research Projects Commission.
**Res. Assist., Balıkesir University, Department of Mathematics Education, Balıkesir, Turkey. E-mail: [email protected]
***Assist. Prof. Dr., Balıkesir University, Department of Mathematics Education, Balıkesir, Turkey. E-mail: [email protected]
AN ANTHROPOLOGICAL ANALYSIS OF THE KNOWLEDGE ON GRAPHICS WITHIN MIDDLE SCHOOL MATHEMATICS
96
Ortaokul Matematiği Grafik Bilgisinin
Antropolojik Açıdan İncelenmesi
Öz
Bu araştırmanın amacı, ortaokul matematiği grafik bilgisini antropolojik açıdan incelemektir. Antropolojik Didaktik Teorisi çerçevesinde yapılan araştırmada ortaokul matematiği grafik bilgisinin kurumsal özelliklerini belirlemek için doküman incelemesi yapılmıştır. Bu kapsamda İlköğretim Matematik Özel Öğretim Yöntemleri kurumunda kullanılan matematik öğretim programları, ortaokul matematik ders kitapları, matematik öğretimi kitapları ve öğretim elemanlarının notlarından oluşan dokümanlar incelenmiştir. Doküman incelemesinden elde edilen veriler, ekolojik ve praksiyolojik yaklaşım kullanılarak analiz edilmiştir. Ekolojik yaklaşım doğrultusunda grafik bilgisinin kurumda bulunduğu habitatı ve işlevi (niş); praksiyolojik yaklaşım ile adaylardan kurumda talep edilen grafiklerle ilgili görev tipleri, bu görev tiplerini yerine getirme şekli (teknik), kullanılan tekniği açıklayan teknoloji ve teknolojinin niçin geçerli olduğunu açıklayan ve savunan teorilerden oluşan matematiksel organizasyonlar ortaya çıkarılarak kurumsal tanımaların özellikleri belirlenmiştir. Araştırma sonucunda ilgili kurumda grafiklerin; sayı ve işlemler, cebir ve veri işleme öğrenme alanlarında yer alan oran-orantı, yüzde, eğim, denklem ve eşitsizlikler, denklem sistemleri, fonksiyon, istatistik ve olasılık konularının öğrenilmesi ve öğretilmesinde; matematik okuryazarlığı, problem çözme, iletişim, ilişkilendirme ve psikomotor becerilerin geliştirilmesinde araç, amaç ve hem araç hem de amaç konumunda kullanıldığı tespit edilmiştir. İlgili kurumda toplam 11 görev tipini içeren “grafik okuma ve yorumlama”, “grafik oluşturma” ve “grafikler arasında uygun dönüşüm yapma” olmak üzere üç matematiksel organizasyon olduğu sonucuna ulaşılmıştır.
Anahtar Sözcükler: Antropolojik Didaktik Teorisi, ekolojik yaklaşım,
Introduction
A piece of knowledge earns a social status through its creation and development provides the interactions among the knowledge, the teacher, and the learner. However, not all structures of knowledge with conceptual structure and epistemology are conveyed to individuals as they are. In other words, the scientific knowledge that emerges from problem situations and human needs initially are transformed into the knowledge to be taught in the curricula by a community called ‘noosphere’ due to social and cultural needs (Chevallard, 1991). While this type of mathematical knowledge is offered to the community’s service based on social and cultural values (Chevallard, 1992), it still has the prints of the nature and developmental process of mathematical knowledge. In other words; the transformation of scientific knowledge, which is isolated from the daily life, into social knowledge is affected by mathematical epistemology that aims to understand the science and environment where mathematical concepts and techniques emerge (Vergnaud, 1990).
The formation of knowledge and its transfer to individuals is included in the study field of the science of didactics (Therer, 1992). The science of didactics analyzes the elements that are employed in the process of transferring knowledge to individuals as well as the effects of the individual on learning (Brousseau, 2002; Chevallard, 1991). There are many theories proposed by the studies in this field. One of them is the Anthropological Theory of the Didactic (ATD) that was proposed by Chevallard (1991). This theory considers practice important, and examined the structure, function, and different uses of knowledge as the common understanding of practice and theory (Chevallard & Sensevy, 2014).
The anthropological theory, which is shaped by the structure of knowledge aimed to be acquired in the learning process, is established on the compounds of object, (knowledge), individual, and institution. Here is the explanation by Chevallard (1991) for these three concepts: The object is described as all of the structures of which the individual is aware, and it is symbolized by “O”. A concrete item (e.g., a book) is accepted as an object, and the loving feeling for the book is an object as well. The persons that interact with the object are individuals, and the institution is a system of techniques and rules based on the individual’s thoughts and knowledge in own field of study. The individual is symbolized by “X”, and the institution is symbolized by “I”. The presence of relationships amongst knowledge, individual, and institutions proves that knowledge is recognized by the individual or that it is present in the institution. In this regard, the relationship of X individual with O object is called individual recognition, and it is symbolized by S(X,O). If the structure of knowledge is capable of being present within an institution, then there is institutional recognition. The institutional recognition for institution I that is showed with RI(O) is not the same with the recognition of another institution (I’). Thus, RI(O) ≠ RI’(O). Because the properties of the same objects change depending on the structures of institutions (Sağlam-Arslan, 2004).
Graphic is a form of representation that is practiced in both mathematics institution and a variety of other institutions such as physics and chemistry. It is used as a mathematical tool for communication since it helps express scientific theories in course books and other printed materials (Kaput, 1987), and enables the individual to convey the knowledge internalized in mind to other people (Hiebert & Carpenter, 1992). In addition to using only one visual to present the knowledge that would be expressed with thousands of words with a verbal manner which provides to convey the knowledge to the reader simply and concisely (Roth & Bowen, 2003), it plays an important role in conceptual understanding (Duval, 1999; Friel, Curcio & Bright, 2001; Winn, 1991) by improving the skills of problem-solving (Cai & Lester, 2005; Schultz & Waters, 2000), building relations between variables, comparing the variables, and making estimations with a consideration of the variables. It also accelerates the process of making sense of knowledge because it concretizes abstract thoughts through
visual elements, and coveys complicated relations with a simple manner (Altun, 2016). Furthermore, graphic is one of the fundamental concepts used jointly in reading, and scientific and mathematical literacy (Long, 2000), and it is used in science, social sciences, and other lessons as well as mathematics, both of which prove that is has an interdisciplinary dimension. It is involved in a number of other field including health and economy which require specialty and concern the public in daily life, showing the necessity to raise individuals that are conscious and have a basic understanding of graphics. For this reason, the concept of graphic which is an important subject of both multiple representation and statistics is heavily included in mathematics curricula (NCTM, 2000). In middle school mathematics curriculum (MSMC), the concept of graphic is handled as a tool of communication to understand the problem and express mathematical thoughts, a form of representation that builds relations between arithmetical and algebraic representations, and a mathematical concept to be taught in the learning field of data processing (The Ministry of National Education, 2013, 2017).
Curricula and course books form the institutional background of the knowledge to be taught, and they are among the factors that affect the teaching and learning process. These sources are the teaching materials that include knowledge aimed to be taught and the teaching activities that are connected to this knowledge. They guide the teachers for determining what to teach, and how to teach it. Most teachers make an exact practice of the content of the curriculum and course books that they use as a guide for mathematics instruction (Skiersko, 1990). Institutional qualities and limitations of the knowledge to be taught can be determined by analyzing the curriculum, which is affected by the culture and understanding of the teaching system, and course books, which reflect the in-class practice of the curriculum (Ersoy, 2006). In this context, it is important to examine graphic knowledge, which has an important place in mathematics instruction, as the knowledge to be taught in framework of ATD, and determine institutional recognitions. Because studying a structure of knowledge within the basic qualities of the institution that involves it enables revealing the expectations of the institution from the individuals, and accordingly, evaluating the individual as the subject of the institution (Chevallard, 1991). In this respect, the aim of this study is to analyze the knowledge on graphics within middle school mathematics from an anthropological perspective. Considering this aim, the study made an effort to answer the following question: “What are the qualities of institutional recognition for graphic knowledge in middle schools that apply special teaching methods?”
Method Model of the Research
This study conducted a document analysis with the purpose of doing an anthropological analysis of middle school mathematics’ graphic knowledge as the knowledge to be taught. Document analysis is a very common data collection technique among all qualitative research methods, and it includes the analysis of the written and visual materials containing information about the phenomenon or phenomena to be researched. In addition to written materials such as course books, curricula, official papers and documents, plans, exam papers, worksheets, and diaries, the materials to be examined include other sources such as films, videos, and photographs (Yıldırım & Şimşek, 2013).
With document analysis, the study aimed to identify institutional recognitions. The institution is regarded as a system which has unique methods, and teaches unique knowledge and thoughts to the individuals involved in it (Chevallard, 1991). In the didactic transformation of knowledge, mathematical knowledge is transformed from academic knowledge into the knowledge to be taught, the knowledge that is taught, and the knowledge that is learned. Each type of transformed knowledge is involved in the institution. For
instance, the knowledge that is taught is instructed under the conditions and limitations of the classroom where instruction is performed (Bosh & Gascon, 2006). In this study, Special Teaching Methods for Elementary Mathematics (STMEM) was determined as the institution. Considering the lesson contents that are determined by Higher Education Board, STMEM lessons include field-specific concepts and the general goals of field instruction related to the instruction of these concepts; appropriate methods, techniques, tools-equipments, and materials to be used for concept teaching; problem-solving, the instruction of field-specific mathematical concepts, and preparing, presenting, and evaluating lesson plan (Higher Education Board, 2017). For the purpose of the study, the concept of graphic was analyzed considering the institution side in framework of ATD from ecological (the location and function of the concept) and praxeological (types of tasks, and their technical, technological, and theoretical background) perspectives. In this respect; the graphics were studied as mathematical concepts. Their location and function were examined considering all subjects, while task types and their technical, technological, and theoretical background were examined in framework of data processing.
For document analysis, the study examined four middle school mathematics course books (Bilen, 2017; Cırıtcı, Gönen, Kavas, Özarslan, Pekcan & Şahin, 2017; Güven, 2017; Üstündağ Pektaş, 2017) that were given by the Ministry of National Education (MoNE) in the 2017-2018 academic year and that were published on Education Informatics Institution addressed to Middle School Mathematics Curriculum (MoNE; 2013, 2017). The study also examined the course books (Altun, 2016; Baykul, 2014; Van De Walle, Karp & Bay Williams, 2010) that are used as reference for the STMEM lessons taught in education faculties in framework of Primary Education Mathematics Teaching Undergraduate Program (Higher Education Board, 2017) In addition, the instruction notes of faculty members were used as a data source.
Analysis of Data
The ATD examines the factors that interact with the level of knowledge in learning process, and aims the recognition of knowledge by individuals, analysis of the knowledge within the relevant discipline, and creation of a model for these knowledge structures. With this purpose, the ATD studies knowledge with ecological and praxeological approaches. The present study aimed to make an anthropological analysis of graphic knowledge within middle school mathematics as the knowledge to be taught. The data that were obtained from document analysis were analyzed with ecological and praxeological approaches.
Ecological Approach
Ecological approach questions the conditions required for the existence of an object (Chevallard, 1991). In ecological approach, knowledge can exist along with the environment it lives in. Ecological approach evaluates the location of knowledge by resembling knowledge to a living thing; the environment where knowledge maintains its existence is called habitat, and the function of knowledge in this environment is called niche. According to this model, the habitat of knowledge shows the places where knowledge is located. In framework of the institution that was examined in this study, the locations of graphics indicate the habitat of the graphics. The function of the graphics, that is, their purpose of use, indicate their ecological niche. To demonstrate the qualities of the institutional recognitions belonging to middle school mathematics
’
graphic knowledge, the study initially determined the locations of the graphic within the documents (habitat), and their functions in these locations (niche) in framework of ecological perspective.The ecological approach, which was used with the purpose of identifying graphic-related institutional recognitions, provided information about the locations and usage purposes of graphics. However, it is insufficient in providing information about how the graphics were used. For this reason, the study used the ecological approach to reach the general information about why and where graphics are used with the purpose of determining institutional recognitions, and then, questioned how graphics are used in data processing using praxeological approach.
Praxeological Approach
Praxeology is used in ATD as an epistemological model which was developed to examine the knowledge or actions of humans (Winslow, 2011). A praxeology consists of two blocks which are practical (praxis) and theoretical (logos) blocks. The practical block of a praxeology includes the task type (T) which involves different kinds of tasks, and the technique (τ). Technique (τ) is the method which is used perform the type of task (T). The theoretical block includes the technology (Q) component which explains the technique used in the practical block as well as the theory (Θ) component which explains or defends this technology. The theoretical block mainly involves the types of knowledge that are used for explanation and justification. Therefore, the theoretical block is also called the knowledge block. A praxeology is expressed as ℘ = (T, τ, θ, Θ) (Chevallard, Bosch & Kim, 2015). When describing these four components of praxeology in the study, two field experts encoded the contents of the components, and created mathematical organizations. In this respect, the reliability of the formula was calculated using Miles & Huberman (1994) formula which is Reliability= [Agreement / (Agreement+Disagreement)] x 100. The calculations revealed that the encoder reliability was 98%.
Results
The Findings Which were Obtained through Ecological Approach
The location (habitat) and function (niche) of middle school mathematics’ graphic knowledge within STMEM was analyzed using ecological approach. The documents analyzed in the study showed that the habitats of graphics were sorted by the units and sections that were connected to fields of learning and sub-fields of learning. The sections and subject distributions that include sub-fields of learning in middle school course books showed that there were 12 sections and 39 subject headings in 5th grade mathematics course book (MCB5); 14 sections and 45 subject headings in 6th grade mathematics course book (MCB6); 134 sections and 57 subject headings in 7th grade mathematics course book (MCB7), and 13 sections and 42 subject headings in 8th grade mathematics course book (MCB8). Mathematics instruction books involved sections about different approaches to the structure and instruction of mathematics along with the teaching of subjects included in fields and sub-fields of learning. Regarding section and subject distributions; Primary and Middle School Mathematics (PMSM) book consisted of 23 sections and 143 subject headings, while Middle School Mathematics Instruction (MSMI) book included 25 sections and 183 subject headings, and Mathematics Instruction in Middle Schools (5th, 6th, 7th, and 8th Grades) (MIMS5-8) book included 11 sections and 60 subject headings (Altun, 2016; Baykul, 2014; Van De Walle, Karp & Bay Williams, 2010). Table 1 presents the subjects headings which involve the graphics within the analyzed documents.
An analysis of Table 1 shows that the MSMC (MoNE, 2013) involves graphics within 5th, 6th, 7th, and 8th grade acquisitions in framework of basic mathematical skills, numbers and operations, data processing, and algebra fields of learning as well as sub-fields of
learning. In the curriculum which was published in 2013, graphics contributed to the improvement of different skills such as problem-solving, communication, association, and psycho-motor skills. In the 2017 curricula, they were studied under the subject headings of mathematical competence and competence in science and technology in addition to cultural awareness and self-expression skills (MoNE, 2017) The 5th, 6th, 7th, and 8th grade acquisitions of the curricula were reflected under sub-fields of learning. Accordingly, the study found that the graphics were included in “producing research questions and the collection, organization, and presentation of data” sub-field of learning in the 5th grade while they were included in “producing research questions, collection and organization of data” in the 6th grade; “ratio and proportion”, linear equations”, and “producing research questions and the collection, organization, evaluation, and interpretation of the data” in the 7th grade”; and “linear equations”, “equation systems”, and “the organization, evaluation, and interpretation of data” in the 8th grade.
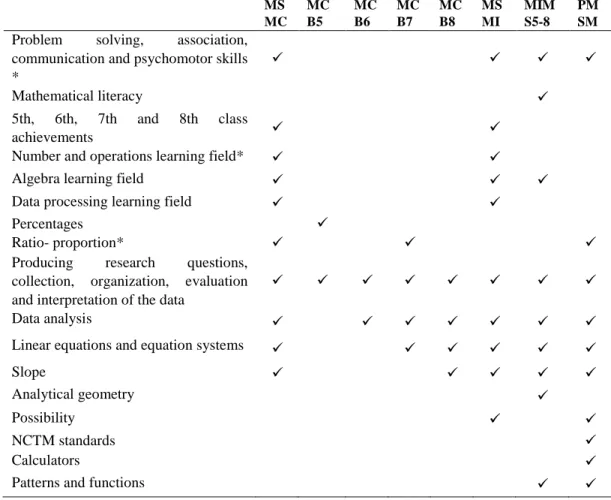
Table 1. The subject headings involving graphics within the analyzed documents
*It is not included in the content of mathematics curriculum (MoNE, 2017).
The study determined that graphics in the relevant sub-field of learning were included in the subjects of bar graph, pie graph, line graph, proportion, histogram, slope, and the solution of equation systems (MoNE, 2013). However, the revised curricula (MoNE, 2017) did not refer to the graphics within the “proportion” subject which was included in “numbers and operations” learning field, and histograms were removed from the curriculum content in
MS MC MC B5 MC B6 MC B7 MC B8 MS MI MIM S5-8 PM SM
Problem solving, association, communication and psychomotor skills *
Mathematical literacy
5th, 6th, 7th and 8th class
achievements
Number and operations learning field*
Algebra learning field
Data processing learning field
Percentages
Ratio- proportion*
Producing research questions, collection, organization, evaluation and interpretation of the data
Data analysis
Linear equations and equation systems
Slope
Analytical geometry
Possibility
NCTM standards
Calculators
“data processing” learning field. The mathematics course books for the 5th, 6th, 7th, and 8th grades (middle school) that were taught in line with the 2013 mathematics curriculum included a variety of graphics (e.g., bar graph, pie graph, line graph, and histogram). An analysis of mathematics instruction books showed that graphics were included in the sections about the instruction of the subjects within a number of learning fields which were the fundamental perspectives in the learning and teaching process of mathematics, current mathematical skills such as mathematical literacy, algebra, data processing, numbers and operations, and probability in addition to the introduction of the curriculum. The graphics were referred in 11% of the subjects in middle school course books that were analyzed in this study, while 7.3% of the subjects in the analyzed mathematics instruction books included them.
The documents analyzed within the study showed that graphics were included in the subject headings of basic skills (problem-solving, communication, association, psycho-motor skills), the acquisitions in the 5th, 6th, 7th, and 8th grades; the learning fields of numbers and operations, algebra, data processing, and the subject headings of percentages, ratio and proportion, linear equations, equation systems, producing research questions, collection-organization-evaluation-interpretation of data, data analysis, linear equations, equation systems, and slope. Also, the subjects of linear inequalities with two variables and probability in MSMI (Baykul, 2014); mathematics literacy, function graphics in algebra instruction, and analytical geometry in MIMS5-8 (Altun, 2016); National Council of Teachers of Mathematics [NCTM] standards, patterns with calculators, and functions in Primary School Mathematics Instruction book (Van De Walle, Karp & Bay Williams, 2010) included graphics. Based on the analyzed documents, the study concluded that the habitat of graphics were the learning fields of numbers and operations, algebra, and data processing; the subjects of ratio and proportion, percentage, slope, equations and inequalities, equation systems, functions, statistics, and probability within these learning fields; and the skills of mathematical literacy, problem-solving, communication, association, and psycho-motor skills.
The study analyzed the functions (niche) of the graphics in the determined habitats in framework of the analyzed documents, and found the documents mentioned that graphics increased mathematical competence by improving the skills of presenting mathematical thought, making decisions, associating, revealing cause and effect relationships, comprehending, and interpreting, and that graphics also affected the improvement of problem solving, associating, communicating, and psycho-motor skills (MoNE; 2013, 2017). The study also found that the graphic took over other roles since it is a form of multiple representations in the instruction of mathematical concepts and accordingly, a form of representation that is related to other mathematical concepts, while it was the target concept that was aimed to be learned in a variety of fields and sub-fields of learning. In this respect, the functions of graphics in their habitats may occasionally be at ‘target knowledge’ level, while they may be used in some cases as mediators for the acquisition of other mathematical knowledge and skills. For instance; graphic has the quality of target knowledge in the creation of bar graph, and it is used as the purpose. When calculating the openness of data, it serves for the development of ‘graphic openness’, and thus, used as a tool. Considering the analyzed documents, the position of graphics was evaluated to be a tool, a goal, and as tool-goal. Accordingly, the graphics were categorized as tools when they were used to teach knowledge, and as goals when the graphic type itself is the target knowledge. Table 2 presents the functions (niche) of the graphics in their habitats that were determined in document analysis as well as the categorization information on the positions of these functions.
As presented in Table 2, graphics in the analyzed documents were used for different functions (tool, goal, and tool-goal) considering their states of usage. Accordingly, the study determined that the was graphic was the tool in a number of calculating functions such as creation of frequency tables and tallies, calculation of openness/mean/mode/median, associating line graphs with slope, determining any proportions between two quantities with given graphics, calculation of the proportionality constant, determination of the solution set for linear equation systems, and calculation of the surface area of a region limited by lines. The graphic was used as the goal in different functions including the interpretation of the data based on bar graph, pie graph, line graph, and histogram; presenting the data on bar graph, pie graph, line graph, and histogram; and making appropriate conversions of graphs into each other. The graphic was used as both as a tool and a goal in problem-solving, association, improvement of communication and psycho-motor skills, interpretation of the data that include linear relations and associating them with algebraic representation, and the presentation on graphic of the data that include linear relations. In this context, the study observed that graphics have a variety of functions. These are the improvement of concepts in many subjects such as statistical information, curves, ratio and proportion, equations, solution of equations, and surface area when they are used as a tool; organization and presentation of data when they are used as a goal; and the teaching and learning of subjects by improving mathematical skills when they are used both as a tool and a goal. In the documents analyzed in the study, graphics were used as a tool in 33.78% of totally 521 tasks, while they were the goal in 40.12% and both the tool and the goal in 26.1%. In all the documents analyzed in the study, graphics were used for “A1. Creation of frequency tables and tallies” as a tool; for “B1. Interpretation of the data on a bar graph” and “B.5 Presentation of the data on a bar graph” as a goal.
The documents which were analyzed considering the habitats and niches of graphics in the relevant institution showed that they were jointly and mainly included in the documents as bar graph, pie graph, line graph, and histogram in framework of “data processing”, and that the graphic types to be included in the content of middle school curricula were limited with these graphic types (MoNE; 2013, 2017). In relation to these graphic types, the analyzed documents generally mentioned the institutional qualities of graphics such as the meaning of the data type, similar of different aspects of graphic types, the graphic type suitable for the data, the methods used for drawing graphics, strengths or weaknesses of graphic types when compared to each other. These institutional qualities mention in the documents were explained within the findings which were obtained through praxeological approach.
The Findings Which were Obtained through Praxeological Approach
This study used the praxeological approach to determine the institutional recognitions related to the graphic knowledge which was used as a reference for the knowledge to be taught in STMEM institution apart from the ecology of graphics. In this respect, mathematical organizations were created with the praxeological approach. Mathematical organizations were determined based on the documents analyzed in the study.
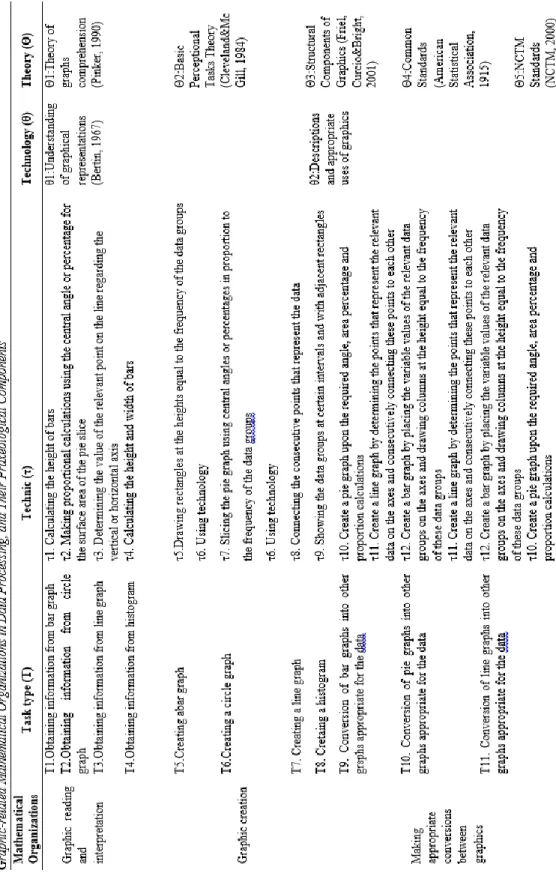
Mathematical organizations
The mathematical organizations that represented institutional recognitions were expressed with this praxeology: ℘ = (T, τ, θ, Θ). Initially, the study determined the task types (T) to create mathematical organizations. In the analyzed documents, there were a total of 232 tasks related to bar graph, line graph, and histogram in framework of data processing. These tasks were categorized into three task groups. For this reason, the study grouped the
232 tasks in three mathematical organization categories which were “graphic reading and interpretation”, graphic creation”, and “making appropriate conversions between graphics”. Table 3 presents the distribution of the determined mathematical organizations in the documents analyzed in the study.
Table 3. The distribution in the analyzed documents of the mathematical organizations
related to graphic knowledge
Mathematical Organizations Graphic reading
and interpretation Graphic creation
Making appropriate conversions between graphics Total f % f % f % f % MCB5 9 3.88 10 4.31 - - 19 8.19 MCB6 7 3.02 6 2.59 - - 13 5.60 MCB7 26 11.21 25 10.78 8 3.45 59 25.43 MCB8 16 6.90 27 11.64 17 7.33 60 25.86 MSMI 13 5.60 11 4.74 3 1.29 27 11.64 MIMS5-8 8 3.45 13 5.60 1 0.43 22 9.48 PMSM 18 7.76 11 4.74 3 1.29 32 13.79 Total 97 41.81 103 44.40 32 13.79 232 100
According to Table 3, there were a total of 232 tasks in the analyzed documents that were related to graphics in framework of data processing. Of these tasks, 41.81% were in the mathematical organization of graphic reading and interpreting, while 44.40% were in graphic creation, and 13.79% were in making appropriate conversions between graphics. In this respect, graphic creation was regarded as the most required mathematical organization in graphic instruction. Making appropriate conversions between graphics was the least included mathematical organization in the analyzed documents. This mathematical organization was not mentioned in the 5th and 6th grade course books. An analysis of the distribution of mathematical organizations in course books revealed that 8.19% of the organizations were in MCB5 while 5.60% were in MCB6, 25.53% were in MCB7, 25.86% were in MCB8, 11.64% were in MSMI book, 9.48% were in MSMI5-8, and 13.79% were in PMSM. Accordingly, MCB8 was the resource that included the biggest number of tasks related to graphics. In addition to bar graph, pie graph, and line graph that were taught in the previous levels, it included 8th-grade-level tasks on the interpretation and creation of histogram, and the conversion of these graphics into each other. The tasks included in graphics were the task types which expect individuals to be informed about the concept of graphic and the qualities of graphics according to ATD. To reveal the institutional recognitions related to the concept of graphic, the study accepted these tasks as task types (T) among the praxeological components. The methods which are used to perform these determined task types form the technique (τ). To determine the techniques, the study used the example solutions, activity examples, and the strategies which are used in explanations. To explain the technology (θ) which explains the relevant technique used to perform the task as well as the reason for the necessity of this technology, and to defend the technique and technology based on justifications, the study accepted the theories in the relevant literature and scientific resources as the theoretical (Θ) component of the relevant organization. In this context,
Table 4 presents the praxeological components of the mathematical organizations that reflect the institutional recognitions related to graphic knowledge.
Table 4 shows that the analyzed documents included a total of 11 task types in relation to the determined mathematical organizations. There were 4 task types in the mathematical organization of graphic reading and interpretation, while there were 4 in graphic creation, and 3 in making appropriate conversions between graphics. An analysis of Table 4 shows that 12 techniques were used for the determined 11 task types. Two task types were performed with the technique of using technology (τ6). In this context, it is possible of create both bar graph and pie graph. The documents were analyzed in framework of converting them into each other appropriately, and it was determined that there were no conversions related to the histograms in the study.
An analysis of the theory blocks of the determined mathematical organizations showed that graphic reading and interpretation organization (MO1) was a theoretical component of θ1 (understanding graphical representations) technology and Θ1 (theory of graphs comprehension). The theory blocks of graphic creation (MO2) and making appropriate conversions between graphics (MO3) were common. In this regard, graphic creation and making appropriate conversions between graphics are local mathematical organizations (Chevallard, Bosh & Kim, 2015). It was found that θ2 technology (descriptions and appropriate uses of graphics) explained the techniques which were employed to perform the task types, and this technology was explained by the theories Θ2 (basic perceptional tasks theory), Θ3 (structural components of graphics), Θ4 (common standards), and Θ4 (National Council of Teachers of Mathematics [NCTM] standards). Here are the determined mathematical organizations and more comprehensive explanations for the praxeological components of these organizations:
The mathematical organization of graphic reading and interpretation (MO1) In framework of graphic types; the organization of graphic reading and interpretation consists of four task types: T1. Obtaining information from bar graph, T2: Obtaining information from pie graph, T3: Obtaining information from line graph, and T4: Obtaining information from histogram. There are different techniques used to obtain information from each of the graphic types included in the study. In the analyzed documents, the respective techniques used to obtain information from bar graph, pie graph, line graph, and histogram are given below:
τ1. Calculating the height of bars
τ2. Making proportional calculations using the central angle or percentage for the surface area of the pie slice
τ3. Determining the value of the relevant point on the line regarding the vertical or horizontal axis
τ4. Calculating the height and width of bars
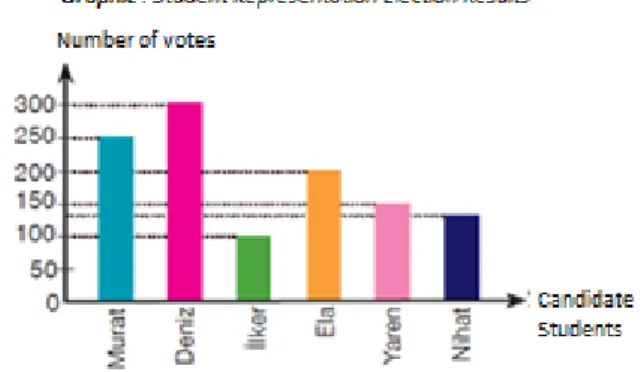
An analysis of the determined techniques indicates that the techniques vary by the structural qualities of graphics. For instance; the frequencies of data groups are determined based on the height of bars in bar graph since the categorical data are represented by bars in this graph. In graphic reading and interpretation organization (MO1), an example from MCB5 content for the task of obtaining information from bar graph (T1) was given in Figure 1 along with its solution.
Figure 1
Example for Obtaining Information from Bar Graph
(Cırıtcı et al., 2017, p. 254, 255)
Figure 1 shows that in the bar graph indicating the results of student representative election, the numbers of votes casted for each candidate student were shown through columns. While answering the questions asked to the readers to obtain information from the bar graph given in the example, the height of the columns showed the numbers of votes. The questions were answered considering the height of the columns.
Similarly, structures that represent frequency were used for the tasks of obtaining information from pie graphs (T2), line graphs (T3) and histograms (T4). The central angle and percentages, which digitize the areas of the graph showing the categorical data, were
used for the task of obtaining information from pie graphs (T2). However, it was found that the angle and percentages that correspond to the areas of the slices were not equal to the frequency of the relevant data. It was concluded that in the examples given for the T2 task, the slices determined through proportional calculations among the data were representing the areas of central angles, and were interpreted based on the size of the central angles of the graph data. The horizontal and vertical values of a certain point on the graph were used to obtain information from line graph (T3). For the task of obtaining information from histogram (T4), the heights and widths of the adjacent columns with a fixed width were considered. The MTMS indicates that group frequencies are represented by the columns’ areas in histograms (Baykul, 2014, p. 490). Zigzag was used in the histogram for the intervals without data (Üstündağ Pektaş, 2017).
In the reviewed documents, columns in bar graphs and histograms, central angles or percentages in pie graphs and lines in line graphs indicate that these graphs are presented in different ways. Understanding the graphic presentations, which explain the techniques determined for the types of the tasks of obtaining information from graphs, forms the technology of this organization (θ1). Bertin (1967) categorizes understanding the graph presentations as external recognition, internal recognition and perception of correspondence. External recognition: Recognition of the fact that the figures, numbers, labels, titles and lines that form a graph transfers the information in real-world.
Internal recognition: Determination of the changes in the graph, the dimensions of these changes, and to which conceptual variable the visual dimensions correspond. Noticing the information about the graph data.
Perception of correspondence: Association of the results scaled in the graph with visual dimensions to represent the real size. In other words, association of the visual dimension with the variable or scale to which it corresponds.
The literature review, carried out to find the theory that explain and defend the technology to understand the graph presentations in the graphic reading and interpretation organization, indicated the “A Theory of Graph Comprehension” suggested by Pinker (1990) based on Bertin’s explanations. The Theory of Graph Comprehension (Θ1) explains how to read a graph and which cognitive processes to be carried out. External recognition, internal recognition and perception of correspondence enable readers to know that the objects in the graph are represented in a single way and to understand the dimensions of the visual components and the corresponding mathematical scale (Pinker, 1990). Readers can understand the meaning of the visual objects in the graph and interpret the graph. The theory of graph comprehension is used to generalize the predictions about what makes a graph better or worse at information transfer to the readers who read the graph. Graph comprehension is based on two mental representations called visual recognition and graphic scheme. Visual recognition is to understand the physical dimensions of the symbols on the graph. Graphic scheme indicates how to match these physical dimensions with mathematical scales (Pinker, 1990). Graphic scheme builds a bridge between the conceptual questions and the conceptual message represented by visual recognition.
Mathematical organization of graphic creation (MO2)
The types of tasks within the scope of the mathematical organization of graphic creation (MO2) are: T5. Creating a bar graph, T6. Creating a pie graph, T7. Creating a line graph, and T8. Creating a histogram. The techniques used in the reviewed documents to create a bar graph, pie graph, line graph and histogram were, respectively:
τ5. Drawing rectangles at the heights equal to the frequency of the data groups τ6. Using technology
τ7. Slicing the pie graph using central angles or percentages in proportion to the frequency of the data groups
τ8. Connecting the consecutive points that represent the data
τ9. Showing the data groups at certain intervals and with adjacent rectangles
The techniques used for certain task types of mathematical organization of graphic creation included explanations that two techniques can be used for the tasks of creating a bar graph (T5) and a pie graph (T6). The first explanation is manually drawing the bar and pie graphs, and the second explanation is drawing through the spreadsheet programs such as Excel. Figure 2 shows an example of the event of manually drawing the pie graph in the MTB7.
Figure 2
The Event of Creating a Pie Graph
(Bilen, 2017, p. 221).
Figure 2 shows that the request was to indicate the data about the quantity of fruits by associating them with percentages and the angle of the relevant slice. Then, it is requested that the slices be drawn using a protractor and colored to show the fruit quantities. The MTB7 included the following explanation for the task of creating a pie graph (T6) in line with the instructions in the event:
“… the ratio of each data to all data is calculated and the relevant slices are marked in the pie graph. These slices are indicated through central angles or percentages.” (Bilen, 2014, p. 222).
While creating a pie graph using a computer program, the users enter the data into the cells in the same line or column in the Excel file, and click on the “pie” under the “Add” tab and then the relevant button under the relevant 2-D or 3-D section. (Bilen, 2017, p. 222). The same technique is also used to create a bar graph. However, while creating a bar graph using
technology, all of the data should be selected and bar buttons are used (Cırıtcı et al., 2017, p. 256).
Manual drawings of bar graphs are explained with examples in the MTB5 and MTB6. In the examples, the bar graphs are created by i) drawing horizontal and vertical axes; ii) naming the axes based on the variables; iii) scaling the axes with numeric data et equal intervals; iv) drawing columns vertical to the axis with the data groups, at equal intervals, and at the height equal to the frequency of the relevant data group; v) drawing adjacent columns with different colors or patterns and indicating the variables represented by the colors or patterns if a dual bar graph is created; vi) and naming the graph appropriately (Cırıtcı et al., 2017; Güven, 2017). In addition, the columns can be drawn vertically or horizontally, which goal that users can change the axes while creating bar graphs.
The reviewed documents indicate that line graphs are created by drawing horizontal and vertical axes, naming the axes based on the variables in the frequency table, writing the relevant variable values on the axes, determining the junction points of the values on the vertical and horizontal axes, and connecting these points consecutively. In the reviewed documents, the line drawn by connecting the points consecutively starting from the first point connected all of the junction points of the variable values in the axes. A linear graph was created using the technique for the task of creating a line graph, which shows the continuously increasing or decreasing, or fixed data. Function graphs are also regarded as line graphs (Altun, 2016). In this regard, a linear graph drawn for the data with linear relationships is also considered a line graph. The technique of connecting the consecutive points that represent the data (τ8) is used in the reviewed documents to create both graphs. However, differences exist between line graphs and linear graphs. For example, line graphs have breaking points, while linear graphs have a straight line. In addition, one of the variables may have non-numerical values in line graphs, whereas both variables have numerical values in linear graphs.
The reviewed documents include various instructions regarding the task of creating a histogram (T8). In these documents, first the number of the groups of data is determined and the group size is calculated. It is reported that to calculate the group size, the ratio of the interval to the number of selected groups should be lower than the group size; and the following inequality is included:
Then, the data groups allocated based on the natural number values for group sizes and the table formed by organizing the numbers of data in the groups are used to create a histogram (Üstündağ Pektaş, 2017). In the histogram examples in these documents, the numbers of groups are selected optionally, the group intervals are calculated by subtracting the smallest value from the biggest value, and zigzag is used for the intervals without data.
The documents explained the techniques used to create graphs with the definitions and appropriate uses of graphs. The technology explaining the techniques used for the types of tasks in the mathematical organization of graphic creation is indicated as the (θ2) “definitions and appropriate uses of graphs.” The reviewed documents define graphs as:
“Pie graphs visualize the data of a research by appropriately dividing a circle into slices.” (Bilen, 2017, p. 222).
“Line graphs are created by marking the junction points of the research data on the horizontal and vertical axes and connecting these points to each other with lines.” (Bilen, 2017, p. 228).
“Bar graphs have two types: bar graphs and histograms. Two vertical axes are used in both graphs: the values or categories of the variables on one axis and the values pertaining to
the variables on the other axis... Bar graphs can be used for discrete variables.” (Baykul, 2014, p. 487).
“Histogram means the classification of the changes in a data array and showing the distribution of these changes through bars.” (Üstündağ Pektaş, 2017, p. 289).
The definitions of graphs include information on how to create a graphic and where they can be used. These definitions indicate that data values or distributions are shown through columns, slices and lines.
The literature shows that the theories of the mathematical organization of graphic creation are closely related to the theories of the organization of graphic reading and interpretation. In this regard, Cheveland and McGill (1984) suggested the narrower-scoped Main Perceptual Tasks (Θ2) have to test the Theory of Graph Comprehension suggested by Pinker (1990). These tasks were classified as “position with the same scale, unjustified position, height-direction-angle, area, volume-curvature, shading, and color vividness.” Height-direction-angle, volume-curvature and shading-color vividness were addressed together in the tasks (Cheveland and McGill, 1984). Perceptual tasks are the components of different graph types.
Different types of graphs have similar structural components (Friel, Curcio and Bright, 2001). The first structural component (Θ3) is the graph’s frame, which provide information about the way of assessment and the assessed information. A graph’s frame consists of axis, scale, grid, symbol, and so on. The frames of the analyzed bar and line graphs consist of L-shaped axes. Pie graphs have polar coordinates instead of axes (Friel, Curcio and Bright, 2001). In polar coordinates, a point’s location is identified by its directional distance and angle to the origin (r,θ) (Thomas, Weir and Hass, 2010). Bar and line graphs have axes while pie graphs do not have axes as their frames. The second common component of graphs is the determinants within the frame. The determinants are lines in line graphs, columns in bar graphs, and central angles or percentages that show the quantity of the areas in pie graphs. The third common component is the labels. The guides, which indicate the variables represented by the axis names, graph names, colors or patterns that name the data scaled on the axes, are used for information transfer in graphs. The last common component is the graphs’ background. Backgrounds include the colors, grids, images, etc. added to the graphs. While every graph has a frame, determinant, label and background, each graph has a specific language. American Statistical Association (1915) developed a 17-item common standard to provide a general perspective for graph creation (Θ4). These standards include information about coordinate system, starting point, scale, axis features, and so on.
Except for these standards, NCTM (2000) emphasized that the required information should be collected and showed to answer the research questions in the standards of data analysis and probability. Students are asked to represent the data using concrete figures, images and graphs; to use different graphs such as tables, line graphs, bar graphs, and lines drawn with points, to present data; to recognize the differences in the representation of categorical and numeric data; and to select, create and use appropriate graphs for graph presentation including histograms, box diagrams, and scatter diagrams. The importance of the type, appropriateness, and whether the data are categorical or numeric, for graph presentation has been emphasized. The curricula also state that graphs should be created in a way to avoid misinterpretations and appropriate for the data (MoNE, 2013, 2017).
Mathematical organization of making appropriate conversions between graphics (MO3)
The mathematical organization of making appropriate conversions between graphics (MO3) includes the tasks of; T9. Conversion of bar graphs into other graphs appropriate for
the data, T10. Conversion of pie graphs into other graphs appropriate for the data, and T11. Conversion of line graphs into other graphs appropriate for the data. The reviewed documents include no tasks for transformation among histogram and other graph types. Therefore, appropriate conversion among histogram and other graphs is not included in the organization. The task of conversion of bar graphs into other graphs appropriate for the data (T9) is fulfilled using the techniques to create a pie graph upon the required angle, area percentage and proportion calculations (τ10) or to create a line graph by determining the points that represent the data on the axes and consecutively connecting these points to each other (τ11); the task of conversion of pie graphs into other graphs appropriate for the data (T10) is fulfilled using the techniques to create a bar graph by placing the variable values of the relevant data groups on the axes and drawing columns at the height equal to the frequency of these data groups (τ12) or to create a line graph by determining the points that represent the relevant data on the axes and consecutively connecting these points to each other (τ11); and the task of conversion line graphs into other graphs appropriate for the data (T11) is fulfilled using the τ11 or τ12 techniques. These techniques are indicated as follows in praxiological components: In the reviewed documents, conversions are made among bar, pie and line graphs using these techniques. Although the documents include appropriate conversions among bar pie and line graphs, a graph cannot be transformed into all graph types. For example, bar graphs use categorical data while line graphs use continuous data. The phrase “relevant data” is used while determining the techniques considering the data types.
Figure 3 shows the example given in the MTB7 for the task of conversion of pie graphs into other graphs appropriate for the data (T10) within the scope of the mathematical organization of making appropriate conversions between graphics.
(Bilen, 2017, p. 239, 240).
In Figure 3, a pie graph, a bar graph and a line graph were created for the same data set. The bar and line graphs are similar in terms of their axes and the data on them, and the columns’ height are the same as the junction points in the line graph. It is explained that pie graph can be used to determine the share of years in the total export, bar graph can be used to compare the quantities of export in years, and line graph can be used to see the increases or decreases in the export quantity.
For the organization of making appropriate conversions between graphics (MO3), the aims of showing the changes, making comparisons or determining the proportions are considered to select the graph type. The reviewed documents indicate that line graphs are useful to compare the changes (increase or decrease) in a certain period and the changed values; bar graphs are useful to compare different data types; and pie graphs are useful to compare the parts of a whole data set with each other and with the entire data set (Altun, 2016; Baykul, 2014; Bilen, 2017; Üstündağ Pektaş, 2017). Regarding the intended uses of the graphs, the documents generally focused on the aim of comparison. All of the three graph types (bar, pie, and line) can be used to compare data. In this case, the students should determine the appropriate graph type for the obtained data. The features of the data are as important as the intended use of the graphs when selecting the graph type. Bar and pie graphs use grouped (categorical) and discrete data, and line graphs use continuous numeric data (Baykul, 2014; Van de Walle, Karp and BayWilliams, 2010).
Bar, pie and line graphs are created for the tasks of making appropriate conversions between graphics. The theoretical part of the task of graphic creation may explain how to make appropriate conversions. This implies that the mathematical organization of appropriate conversions between graphics (MO3) has common theoretical components (technology, theory, etc.) with the mathematical organization of graphic creation (MO2). The theories of the organization of making appropriate conversions between graphics include the definitions and proper uses of the graphs (θ2), technology and the theory of main perceptual tasks (Θ2), structural components of the graphs (Θ3), common standards (Θ4), and the NCTM standards.
Analysis of the praxiological components (Task type (T), Technique (τ), Technology (Q), and Theory (Θ)) that constitute the content of the three mathematical organizations identified in the study and the relationships between these components show that a single mathematical organization that comprise all mathematical organizations does not exist.
However, the organization of graphic creation is related to other organizations. The graph type should be determined according to the data, the variables should be associated with each other and placed in the graph, the graph should be created using cognitive and psycho-motor skills, and accurateness of the graph should be assessed. In this regard, it can be concluded that the organization of graphic creation (MO2), which requires almost all mathematical skills, form a basis for the organizations of graph reading and interpretation (MO1) and making appropriate conversions between graphics (MO3). In addition, the praxiological components other than the task types included in the organization of making appropriate conversions between graphics can be explained by the organization of graphic creation. This indicates that the most general mathematical organization is the organization of graphic creation.
Discussion, Conclusion and Recommendations
This study provides the definitions of graphs as a teaching subject in the STMEM institution. During the document review, the characteristics of institutional recognitions are analyzed through ecological and praxiological approaches. Ecological approach identifies the place of graphs in the institution; in other words, their habitat and function (niche). The reviewed documents show that graphs are used in the fields learning of numbers and operations, algebra, and data processing; the subjects of ratio and proportion, percentage, slope, equations and inequalities, systems of equations, function, statistics and probability in these fields; mathematical literacy, technological tools in graph teaching, problem-solving, communication, association, and psycho-motor skills. In the identified habitats, graphs function as a goal, a tool, and both. In this regard, graphs are used as a tool to create a frequency/tally table, calculate the intervals/means/mode/medians, associate the line graphs with slopes, determine whether two quantities in the graph are in proportion to each other, calculate the proportionality constant, determine the solution set of the system of linear equations, and calculate the area of the zone limited by lines; as an goal to show and interpret the data on bar graphs, pie graphs, line graphs and histograms, and make appropriate conversions of these graphics into each other; and as both an goal and a tool to improve the problem-solving, association, communication and psycho-motor skills, present the data with linear relationships and interpret these graphs, and associate these graphs with algebraic presentation. In addition, the 2013 and 2017 mathematics teaching curricula updated in line with social and cultural needs (Chevallard, 1991) have been analyzed and differences have been revealed.
Within the scope of praxiological approach, the task types of the graphs, the techniques used to fulfill these task types, the technologies that explain these techniques, and the theories that explain and defend these technologies have been determined to form the mathematical organizations. In line with the reviewed documents, three mathematical organizations have been identified with a total of 11 task types: Graphic reading and interpretation (MO1), Graphic creation (MO2), and making appropriate conversions between graphics (MO3). The mathematical organization of graphic reading and interpretation (MO1) includes four task types within the scope of the relevant institution. Column heights are calculated (τ1) to obtain information from bar graphs (T1); the slices’ area is proportionally calculated using central angles or percentages (τ2) to obtain information from pie graphs (T2); a certain point’s values on the horizontal and vertical axes is determined (τ3) to obtain information from line graphs (T3); and column heights and widths are calculated (τ4) to obtain information from histograms (T4). The literature explains the technologies (θ1) of the graph presentations using these techniques through the cognitive skills of external recognition, internal recognition, and perception of correspondence (Bertin, 1967). Pinker
(1990) explains and defends this technology through the Theory of Graph Comprehension (Θ1).
In the organization of graphic creation, bar graphs are created (T5) by drawing rectangles at the height equal to the frequency of the data groups (τ5) and using technology (τ6); pie graphs are created (T6) by the (τ6) technique and slicing the circle based on central angles or percentages in proportion to the frequency of the data groups (τ7); line graphs are created (T7) by connecting the consecutive junction points that represent the data (τ8); and histograms are created (T8) by showing the data groups through adjacent columns at certain intervals (τ9). Definitions and appropriate uses of graphs explain these techniques and constitute the technology (θ2), and main perceptual tasks (Θ2), structural components of graphs (Θ3), common standards (Θ4), and the NCTM standards (Θ5) explain and defend this technology.
The organization of making appropriate conversions between graphics has three task types. The task of conversion of bar graphs into other graphs appropriate for the data (T9) is fulfilled using the techniques to create a pie graph upon the required angle, area percentage and proportion calculations (τ10) or to create a line graph by determining the points that represent the data on the axes and consecutively connecting these points to each other (τ11); the task of conversion pie graphs into other graphs appropriate for the data (T10) is fulfilled using the techniques to create a bar graph by placing the variable values of the relevant data groups on the axes and drawing columns at the height equal to the frequency of these data groups (τ12) or the (τ11) technique; and the task of conversion of line graphs into other graphs appropriate for the data (T11) is fulfilled using the (τ10) or (τ12) techniques. Creation of bar, pie and line graphs using the techniques in the organization of making appropriate conversions between graphics is explained by the technologies and theories identified in the organization of graphic creation. This implies that the organizations of graphic creation and making appropriate conversions between graphics are the local organizations with the same technology and theory.
The information structures differentiated from academic information based on the institutional needs within the scope of the didactic transformation of information are not the simplified forms of academic information (Artigue & Winslow, 2010). Therefore, the information of graphs, discussed as a teaching subject in the study, should be addressed together with its theory. However, the component of theory has been provided from the literature while the components of task type, technique and technology have been produced for through the reviewed documents the mathematical organizations that institutionally define the information of graph. In this regard, theories that form the basis of the teaching subject can be included in the documents regarding mathematics education which will guide teachers in the didactic period. This may enable teachers to have an in-depth and holistic view (Cohen, McLaughlin & Talbert, 1993). In parallel, teachers may achieve a more effective and consistent teaching process, knowing what to do for what reason in the classroom (Skemp, 1976).
Ecological and praxiological analysis of the documents used for teaching, which include the information of graphs as a teaching subject, has revealed the institutional recognitions in the relevant institution. Ecological and praxiological approaches enable the theoretical and practical analysis of the institutional recognitions within the teaching and learning process of graphs. In addition, they provide a large framework for the duties and responsibilities of both the teacher and the learner regarding information throughout the educational process. This enables the assessment of the didactic process, as well as teaching activities, in terms of information, learners and teachers (Chevallard, 1991), while revealing the institutional recognition. Studies on teaching mathematical information during mathematics education
should analyze the information in relation to the institution. These studies will provide different perspectives to the learning-teaching activities that focus on the interdisciplinary approach, which addresses the interactions between the didactic, mathematics, epistemology, or education disciplines of information teaching. The results of such studies conducted on mathematics education will contribute to the improvement of learning.
References
Altun, M. (2016). Teaching mathematics in secondary schools (5th, 6th, 7th and 8th graders) (16th Edition). Bursa: Aktüel.
American Statistical Association. (1915). Joint committee on standards for graphic presentation. Publications of the American Statistical Association, 14(112), 790-797. Artigue, M., & Winsløw, C. (2010). International comparativestudies on mathematics
education: A view point from the anthropological theory of didactics. Recherches en
Didactiques des Mathématiques, 30(1), 47-82.
Baykul, Y. (2014). Teaching mathematics in secondary schools (2nd Edition). Ankara: Pegem.
Bertin. J. (1967). Semiologie graphique: Les diagrammes-les reseaux-les cartes. The Hague: Mouton.
Bilen, O. (2017). Secondary school mathematics textbook 7. Ankara: Gizem Publishing, ISBN: 978-975-7000-79-2.
Bosch, M., & Gascón, J. (2006). Twenty-five years of the didactic transposition. ICMI
Bulletin, 58, 51-65.
Brousseau, G. (2002). Theory of didactical situations in mathematics. N. Balacheff, M. Cooper, R. Sutherland, & V. Warfield (Eds. & Trans.). Dordrecht, The Netherlands: Kluwer Academic.
Cai, J., & Lester, F. K. (2005). Solution representations and pedagogical representations in Chinese and US classrooms. The Journal of Mathematical Behavior, 24(3), 221-237. Chevallard, Y. (1991). La transposition didactique – du savoir savant au savoir enseigné
(first edition, 1985). Grenoble: La Pensée Sauvage.
Chevallard, Y. (1992). A theoretical approach to curricula. Journal fuer
Mathematik-Didaktik, 13(2-3), 215-230.
Chevallard, Y., & Sensevy, G. (2014). Anthropological approaches in mathematics education, French perspectives. In Encyclopedia of Mathematics Education (pp. 38-43). Springer Netherlands.
Chevallard, Y., Bosch, M., & Kim, S. (2015). What is a theory according to the anthropological theory of the didactic?. In CERME 9-Ninth Congress of the European
Society for Research in Mathematics Education (pp. 2614-2620).
Cırıtcı, H., Gönen, İ., Kavas, D., Özarslan, M., Pekcan, N. & Şahin, M. (2017). Secondary
school mathematics textbook 5. İstanbul: Bilnet.
Cleveland, W. S., & McGill, R. (1984). Graphical perception: Theory, experimentation, and application to the development of graphical methods. Journal of the American
statistical association, 79(387), 531-554.
Cohen, D. K., McLaughlin, M., & Talbert, J. (1993). Teaching for understanding: Challenges for practice, research and policy.
Duval, R. (1999). Representation, Vision and Visualization: Cognitive Functions in Mathematical Thinking. Basic Issues for Learning (ERIC Documentation Reproduction Service No. ED 466 379).