A Proof-of-Concept Wearable Photoplethysmography
Sensor-Node for Near Real-Time Pulse Transit Time
Measurements
*Kenan Ça÷rı Hırlak, *Zübeyr Furkan Eryılmaz,
Makbule Kübra Korkmaz
Department of Electrical and Electronics Engineering Bilkent University, Ankara, Turkey
Hakan Töreyin
Department of Electrical and Computer Engineering San Diego State University, San Diego, CA
[email protected] Abstract— Use of pulse transit time for estimating blood
pressure is a promising method that could potentially address the pressing need for an unobtrusive and continuous blood pressure measurement technique. In this paper, we present a novel wearable smart sensor-node system that captures and transmits the distal timing information of pulse waves to a remote location for near real-time pulse transit time measurements. The proof-of-concept system monitors photoplethysmography signals captured from finger, identifies the foot-points of the waveforms, and transmits the timing information of the foot-points to a receiver over a free-space optical channel. Measurements from one healthy subject show that the average time difference between the distal timing information received in near real-time and calculated off-line is 34±6.2 ms. Supplied by a single 5 V power supply, the proof-of-concept system consumes 190 mW.
Keywords—free-space optical communication; photoplethysmography; physical computation; pulse transit time; ubiquitous blood pressure monitoring.
I. INTRODUCTION
Blood pressure (BP) is an important predictor of cardiovascular diseases. Particularly, abnormally high BP (hypertension), reduces the blood delivered to heart that might lead to serious consequences including heart failure, heart attack, stroke in brain, and chronic kidney problems [1]. Therefore, continuous/continual BP monitoring is of utmost importance to diagnose hypertension timely and tune the treatment to control BP. However, current BP measurement methods prevent continuous and unobtrusive BP monitoring. For instance, auscultation and oscillometry necessitate use of cuffs and each BP measurement takes long (~20 sec). Furthermore, techniques enabling continuous BP monitoring are either invasive (e.g., catheterization) or obtrusive (e.g., volume clamping, tonometry). To address the need, recent research efforts have focused on predicting BP based on the velocity of blood pulse wave propagating along the vasculature, where the underlying principle is that an increase in BP translates into a decrease in pulse transit time (PTT) - the time it takes a pulse wave to cross two points on an artery (i.e., proximal and distal points) [2]. A useful signal for measuring pulse wave timing is photoplethysmography (PPG). In fact, in monitoring PTT, majority of the research has been based on transmission-mode
PPG signals, for its simple hardware and high signal-quality in patients as well as healthy populations [2]. In those studies, PTT calculations were often performed offline and mostly required use of numerical analysis software run on stationary hardware by measuring the delay between proximal and distal waveforms recorded concurrently [2, 3]. Although that approach ensures precise measurement of proximal and distal timing of pulse waves and therefore the PTT, a key issue that remains to be addressed relates to near real-time calculation of PTT in an ultimate wearable BP-measurement system.
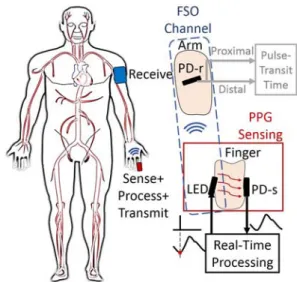
Accordingly, we present a proof-of-concept wearable discrete-design sensor-node that senses PPG signal from the fingertip and achieves processing and transmission of the physiologically-relevant temporal information to a receiver located at a distance, thereby enabling near real-time PTT calculation at the receiver end (Fig. 1). For energy- and area-efficiency, the system innovatively shares one infrared (IR) emitter to illuminate the finger for PPG sensing and transmit the
*Co-first authors: Kenan Ça÷rı Hırlak and Zübeyr Furkan Eryılmaz H. Töreyin was with the Department of Electrical and Electronics Engineering, Bilkent University, Ankara, Turkey. He is now with the Department of Electrical and Computer Engineering, San Diego State University, San Diego, CA 92182.
Fig. 1. A sense, process, and transceiver system measures photoplethysmography (PPG) signal, detects PPG foot-points in near real-time, and transmits the temporal information of foot-points to a receiver located at a distance; for pulse transit time measurements at the receiver site. The system shares a light-emitting-diode (LED) for both illuminating the finger for PPG sensing and data transfer over a free-space optical (FSO) channel.
data to the receiver over a free-space optical (FSO) channel. The feature critical for PTT calculation, namely foot-point, is detected by a custom computation-electronics in hardware. The system incorporates two separate photodiodes (PDs) for PPG sensing and receiving the temporal information of the PPG foot-point.
The paper is organized as follows. In Section II system-level design considerations and an overview of the system are presented. The system sub-blocks are detailed in Section III. In Section IV, measurement results are followed by a discussion. The paper is concluded in Section V.
II. PPG SENSOR-NODE OVERVIEW
A. Power and Area Considerations
To decrease the system complexity and the power consumption, the system was designed to share a single LED for both PPG sensing and FSO communication. In addition, the system incorporates a physical computation circuit performing near real-time detection of the distal timing of pulse waves. As such, the need for large computational, memory, communication, and power resources that would have been needed for processing the whole PPG waveform is eliminated.
B. LED and PD Selection
The selection of IR wavelength was made considering the needs of both PPG sensing and data transmission; IR enables PPG measurements from deeper arteries compared to red/green light [4], and the noise contribution of ambient (visible) light on the communication channel is reduced significantly in the IR (particularly above 800 nm) range. To meet another critical design performance, namely enhancing the communication range, a high light-intensity, narrow spectral-bandwith (40 nm) IR (850 nm center wavelength) LED with wide half-intensity beam-angle (110˚) OD-250 LED (Opto Diode Corp., Camarillo, CA) was used in the system. Because of the short rise and fall
times of the LED (i.e., ~tens of ns), it is possible to keep the power-hungry transmission pulses very short (~10 μs), which improves the power consumption. To match the LED’s spectral output while suppressing the undesired light spectrum and increase the chances of reception through line-of-sight as well as reflections from objects around, wide-angle (120˚) 870 nm center-wavelength BPV22NF (Vishay Intertechnology, Malvern, PA) PDs having daylight filter are used for sensing PPG and receiving pulses over the FSO channel.
C. Finger-Clip Design
The finger-clip was designed to firmly grasp the finger and detect PPG under ambient daylight conditions while not compromising the FSO pulse transmission. To meet the needs, a flexible finger-sprint has been modified to embody both the LED and the sense PD, PD-s. For data transmission, an aperture window has been provided at the tip of the finger-clip. For propagation of the IR pulse through the window while ensuring sufficient shining on the finger, the LED is attached to the sprint at an angle of 45˚.
D. System
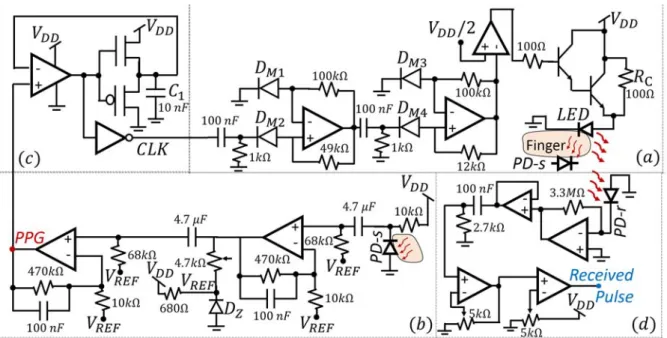
The proof-of-concept PPG sensor-node consists of LED drive, PPG sensing, physical computation, and FSO receiver (RX) blocks (Fig. 2) and operates from single 5 V supply. Depending on the LED drive circuit’s (Fig. 2(a)) current magnitude, the system enters either sense (low current) or data transmission (high current) mode. When in the sense mode, the PPG sense and physical computation circuitry (Fig. 2(b-c)) capture the PPG waveforms and generate inverted-pulses at the onset of the PPG foot-points, respectively. The LED drive circuit (Fig. 2(a)) converts the inverted-pulses to short-duration current pulses across the LED to transmit the pulses to the FSO receiver (Fig. 2(d)). The system components are detailed in the following section.
III. PPG SENSOR-NODE SUB-BLOCKS
A. LED Drive Block
The core of the LED drive block is a Darlington pair that can generate high current required for communication (Fig. 2(a)). When the input (base voltage) is low, the RC ensures a constant
low current (~35 mA) through the LED and when the input is high, short burst of high amplitude current (~1A, 10 μs) is provided to the LED by the Darlington pair. The circuitry generating the pulse was designed to resolve a feedback problem causing high-frequency oscillations: A pulse generated for the FSO receiver PD, namely PD-r, is also received by the PD-s, which leads to generation of undesired pulses through the feedback loop formed by the LED drive block, PD-s, and the physical computation circuitry. To address this issue, the pulse was generated through two monostable multivibrators (MMs) (Fig. 3). The MM-1 enters the quasi-stable state at the falling edge of its input, CLK, and generates a ~100 μs inverted-pulse. Similarly, the MM-2 enters the quasi-stable state at the falling edge of the output of MM-1, and generates a 10 μs inverted-pulse, which is inverted at a comparator before fed to the Darlington pair. Note that, the long quasi-stable state duration of MM-1 (~100 μs) ensures that the feedback loop remains broken during and after the LED is driven by the 10 μs pulse.
B. PPG Sensing Block
The PPG sensing block consists of the PD-s operated in photoconductive mode for highly linear-response; and the circuitry designed to (i) provide sufficiently-high variable-gain, (ii) filter high-frequency noise and dc component of the PPG, and (iii) prevent signal distortion. Therefore, a distributed (two-stage) variable-gain (Amax=67.2 dB) BPF (f-3dB,HPF=0.5 Hz and f -3dB,LPF=3.4 Hz) amplifier was designed. The VREF=1.65 V is
generated using a Zener-diode voltage-regulator (Fig. 2(b)).
C. Physical Computation Block
The physical-computation circuit is a hysteretic differentiator (Fig. 2(c)) that amplifies the large changes in the 1st time derivative of PPG signal while suppressing the small changes [5]. The amplification is achieved by a rail-to-rail single supply LMC6482 Op-Amp (Texas Instruments, Dallas, TX). The non-linear behavior of the current through the capacitor C1
(10 nF) for noise-immune operation is achieved by a non-inverting NMOS-PMOS stage implemented using ALD1103 matched N-P MOS pair (Advanced Linear Devices, Sunnyvale, CA). An inverter converts the output of the hysteretic differentiator into a clock, CLK, which captures timestamps of foot-points on falling edge.
D. FSO Receiver (RX) Block
The first stage of the FSO receiver is the PD-r operated in the photovoltaic mode to minimize the dark current and therefore improve the SNR. The current across the PD-r is converted into voltage by a transimpedance stage (G=3.3M V/A). The following stages include a HPF stage suppressing the dc component to maximize the output swing, a variable-gain amplifier (VGA) ensuring sufficient amplification, and a variable-threshold comparator generating a pulse at the output while improving the minimum detectable signal by the receiver.
IV. MEASUREMENTS AND DISCUSSION
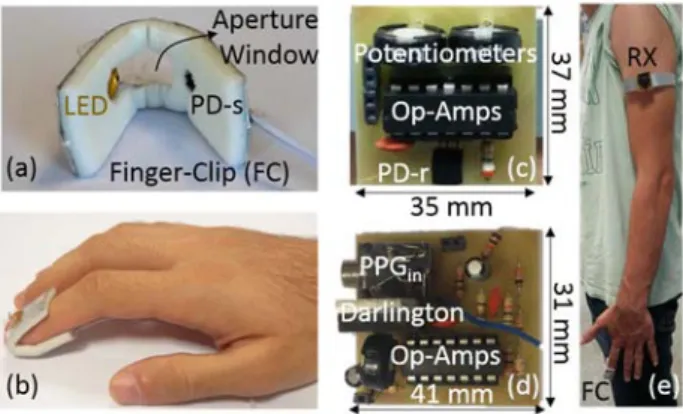
To validate the proof-of-concept PPG sensor-node, measurements were taken from each sub-block and the overall system. The hardware components of the system and a healthy subject wearing the wearable components are shown in Fig. 4. For data acquisition, 10 kSa/s sampling rate DSO-X 2002A oscilloscopes (Agilent Technologies, Santa Clara, CA) were used. The data were replotted on MATLAB for visualization purposes.
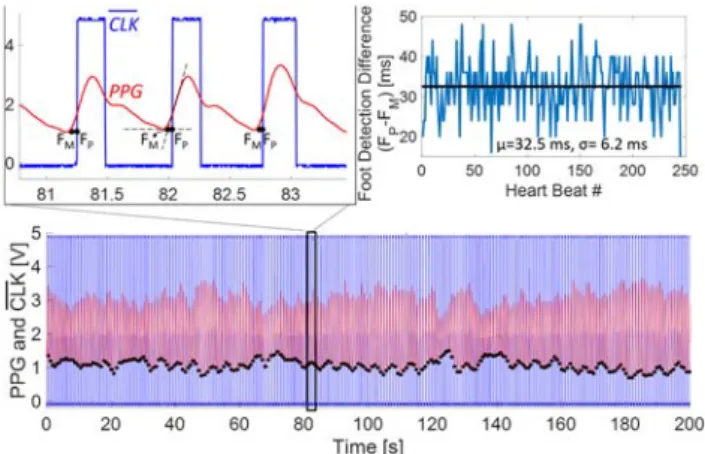
The PPG sensing and physical computation block measurements taken from a healthy subject are shown in Fig. 5. The foot-points detected near real-time by the processor and off-line using MATLAB are marked on the PPG waveforms and denoted as FP and FM, respectively. The FM points were detected
using the intersecting tangent method [2]. The average time difference between FP and FM for all heart-beats over the course
of a 200 s PPG measurement, is 32.5 ms±6.2 ms.
Delay measurements of the sensor-node were performed for the MMs (i.e., delay from CLK to PulseT, namely dCP) and the
FSO channel (Fig. 6) (i.e., delay from PulseT to PulseR, namely
dTR) separately. For 25 measurements, dCP and dTR values were
consistently measured as dCP=1.5 ms and dTR=13 μs,
respectively. The measurements also show that distance between the FC and the RX does not affect the dTR (Fig. 6).
The end-to-end measurements were performed when the distance between the FC and the RX was 25 cm. Four PPG waveforms, and their corresponding transmitted and received
Fig. 4. PPG sensor-node hardware components. (a) Finger-clip (FC). (b) The FC when worn on a finger. (c) The FSO receiver (RX) PCB. (d) The PPG sense and the LED drive circuit are implemented on the same PCB. The physical computation circuitry implemented on a breadboard is not shown. (e) The lateral view of a subject wearing the FC and the RX. Note that the subject flexes the finger for ease of visibility of the FC.
Fig. 3. Two monostable multivibrators (MMs) with different quasi-stable state durations, PDI and PDII, are designed to break the feedback loop
pulses are shown in Fig. 7. The abrupt change in the LED current for data transmission distorts the PPG signal for ~ 250 ms. The distortion begins with a notch, namely FSO notch, which is synchronous with the LED current pulse. It should be noted that, the distortion length is much shorter than a typical PPG period and therefore does not interfere with the detection of the next foot-point.
The FSO channel was evaluated by measuring the SNR of the VGA output of the RX for a range of distances between the FC and RX (Fig. 8(a)). In addition, SNR for four combinations of FC and RX locations on the body, and three body positions (Fig. 8(b)) were also measured from a healthy subject. All SNR measurements were above the minimum SNR required for pulse generation at the output of the RX (i.e., ~20 dB).
When supplied by a single-supply 5 V, the total power consumption of the proof-of-concept system was measured as 190 mW, where 90% of the power was consumed by the PPG sense circuitry. In other words, the proposed PPG sensor-node adds critical functionality (i.e., near real-time processing and communication) to a PPG sensor while increasing the power budget only by 11%. Furthermore, the power consumption could potentially be improved significantly if a fully-custom integrated-circuit approach is followed. The measurements indicate that unobstructed direct line of sight between the LED and the PD-r improves the SNR of the received signal. However, in some cases reflections from walls, floor, or other objects suffice to obtain an SNR>20 dB. Measurements also show that, the delay between the PPG foot-point and the received pulse is highly deterministic (~34 ms±6.2 ms) and therefore can be compensated for by a computation element at the RX end.
V. CONCLUSION
In this study, a proof-of-concept wearable PPG sensor-node enabling near real-time PTT measurements is presented. The system shares a single LED for PPG sensing and communication. The timing information is determined in near real-time by a physical computation circuitry. Initial results on foot-point detection by the PPG sensor-node match well with results obtained offline using MATLAB. Results also reveal that it is possible to convey the foot-point timing information across different body parts over a free-space optical communication
channel. We envision these findings laying a foundation for innovative and integrative approaches in biosignal sensor nodes of the next-generation body-sensor networks.
ACKNOWLEDGMENT
The authors thank Ufuk Tufan for help with PCB fabrication. REFERENCES
[1] A. V. Chobanian et al, “The seventh report of the joint national committee on prevention, detection, evaluation, and treatment of high blood pressure: The JNC 7 report,” J. Am. Med. Assoc., vol. 289, no. 19, pp. 2560–2572, May 2003.
[2] R. Mukkamala et al., “Toward ubiquitous blood pressure monitoring via pulse transit time: Theory and practice,” IEEE Trans. Biomed. Eng., vol. 62, no. 8, pp. 1879–1901, Aug. 2015.
[3] M. Gao et al., “Improved pulse wave velocity estimation using an arterial tube-loadmodel,” IEEE Trans. Biomed. Eng., vol. 61, no. 3, pp. 848–858, Mar. 2014.
[4] J. Spigulis et al., "Simultaneous recording of skin blood pulsations at different vascular depths by multiwavelength photoplethysmography,"
Applied optics, vol. 46, pp. 1754-1759, 2007.
[5] C. Mead, Analog VLSI and Neural Systems, pp. 173-178, 1989, Addison-Wesley.
Fig. 5. Physical computation circuit measurements. PPG; ܥܮܭതതതതതത; foot-points identified by the physical computation circuit and MATLAB, FP and FM;
respectively; are shown for 200 s measurements from a healthy subject.
Fig. 6. FSO channel delay measurements. Delay between the pulses transmitted, PulseT, and received, PulseR, is dTR=13 μs for both when the
distance between the LED and the PD-r is 1 m (blue) and 1.5 m (black).
Fig. 7. End-to-end measurements of the PPG sense-node show the PPG signal, transmitted pulse, PulseT, and the received pulse, PulseR.
Fig. 8. FSO channel SNR measurements. (a) Received signal SNR decreases as channel distance increases. (b) SNR for different FC and RX positions when a subject is standing, sitting, and in supine position. On human figures, the FC and the RX locations are marked with red and blue dots, respectively.