Kahramanmaras Sutcu Imam University
Journal of Engineering Sciences
Geliş Tarihi : 17.09.2019 Received Date : 17.09.2019
Kabul Tarihi :29.01.2020 Accepted Date : 29.01.2020
P25 METODU İLE KAHRAMANMARAŞ YAPI STOĞUNUN İNCELENMESİ
INVESTIGATION OF KAHRAMANMARAS BUILDING STOCK BY P25
RAPID EVALUATION METHOD
Ö. Alper ERŞAHAN1(ORCID: 0000-0002-2934-2878)
Mehmet Metin KÖSE1* (ORCID: 0000-0002-7462-1577)
Sıla AVĞIN1(ORCID: 0000-0003-4102-7747)
1 Kahramanmaraş Sütçü İmam Üniversitesi, İnşaat Mühendisliği Bölümü, Kahramanmaraş, Türkiye
*Sorumlu Yazar / Corresponding Author:Mehmet Metin KÖSE, [email protected]
ÖZET
Bu çalışmada Kahramanmaraş ilindeki yapı stoğunun hızlı değerlendirme yöntemi ile incelenmesi amaçlanmıştır. Kısa sürede birçok yapının deprem güvenliği hakkında bilgi sahibi olmak amacıyla yapı stoğunun incelenmesi hızlı değerlendirme yöntemlerinden biri olan P25 hızlı değerlendirme yöntemi ile yapılmıştır. Kahramanmaraş ilinde bulunan kamu binalarından ve özel binalardan ildeki bütün binaları temsil edecek şekilde 342 adet bina seçilmiştir. İncelemede binaların 100 üzerinden puanlamaya tabi tutarak 25 puanın altındaki binalar çok riskli gruba; 25 ila 35 puan arasındaki binalar, ayrıntılı inceleme bandında; 35 puandan yüksek binalar az riskli grupta değerlendirilmiştir. İncelenen 342 adet binadan 100 tanesi çok riskli grupta 121 tanesi ayrıntılı inceleme bandında 121 tanesi az riskli grupta çıkmıştır.
Anahtar Kelimeler: Kahramanmaraş yapı stoğu, hızlı değerlendirme, P25 metodu ABSTRACT
In this study, it is aimed to examine the building stock in Kahramanmaras province by rapid evaluation method. In order to have knowledge of the earthquake safety of many buildings in a short period of time, the building stock was inspected by P25 rapid evaluation method which is one of the rapid evaluation methods.342 buildings are selected from public and private buildings in Kahramanmaras province to represent all buildings in the city. In the survey, the buildings were scored over 100 points, buildings blow 25 points entered a very risky group, buildings between 25 and 35 points buildings were assessed in the detailed examination band, above 35 points buildings were evaluated in the low risk group. Of the 342 buildings examined, 100 were in the high-risk group; 121 were in the detailed examination band and 121 were in the low-risk group.
Keywords: Kahramanmaras building stock, rapid evaluation, P25 method INTRODUCTION
Although conventional failure analysis methods are reliable, they are not economical and fast due to time-consuming calculations. In recent years, with the advantage of technological advances in the investigation of seismic movements, research on rapid evaluation methods has increased. The applicability of rapid evaluation methods has been tested ın recent earthquakes and they have been used to evaluate the existing building stocks. Several rapid evaluation methods have been developed nationally and internationally. The ATC-21 (Applied Technology Council) Rapid Visual Screening of Buildings for Potential Seismic Hazards is one of the first pioneers of the developed methods in earthquake engineering in US. The aim of this method is to have information about the earthquake safety of structures in a short time and to determine the structures which are not resistant to earthquake effect and can be damaged during earthquake. Thus, the existing building stock will be scanned quickly and it will be ensured that the buildings are safe enough to require secondary and detailed investigation (Tüysüz, 2007).
The Canadian seismic survey method is the first stage of a multi-stage investigation proposed in accordance with the guidelines published by the Canadian National Research Association. A numerical preliminary assessment of the earthquake risk of each building is determined. The success of this method, which takes many factors into account, is directly dependent on accurate and reliable data collection by qualified individuals. In case of uncertainties, conservative values should be chosen to remain on the safe side.
The Japanese Seismic Index Method can be applied as a rapid evaluation method to reinforced concrete building type structures with structural system consisting of frame, shear wall-frame or shear walls only. It is used for the rapid estimation of earthquake reliability of reinforced concrete buildings. This method is not recommended for use in buildings over 30 years of age and buildings with severe physical defects, low material strength or unusual structural system (JBDPA, 1990). Earthquake Safety Screening Method (ESSM) was obtained by adapting the Japanese Seismic Index Method to the structures of different damage levels after the 1992 Erzincan, 1998 Adana-Ceyhan and 1999 Marmara and Düzce earthquakes according to ABBYHY’98. As a result of the studies, it was concluded that ESSM can be used in structures up to six floors (Boduroğlu, 2007).
In order to determine the earthquake safety of buildings, a study has been conducted on the comparison of the results of DURTES computer software developed by Istanbul University Civil Engineering Department (Öztorun, 2002, Öztorun, 2004). In this study, firstly the appropriate information required for the evaluation of the buildings was determined on a mathematical basis and a questionnaire containing this information was prepared. Required information in this questionnaire are filled on-site and then transferred to the computer software called DURTES. The characteristics such as the earthquake load to which the buildings will be exposed, the earthquake load they can carry and the strength are determined very easily.
In a study conducted by Hassan and Sözen, the data of 46 buildings damaged after the 1992 Erzincan Earthquake was used. At the end of the study, index boundaries were determined according to cross-sectional areas of the column and infill walls in order to classify the buildings as “total collapse”, “heavily damaged”, “moderately damaged” or “lightly damaged”. (Hassan 1997). In another study developed by Sucuoglu, the building risk ranking can be made with the method called Screening Method from the Street with a small number of parameters that can be observed from outside without entering into 1-6 story reinforced concrete buildings (Sucuoğlu, 2007).
The earthquake risk evaluation for consulate buildings in some Eastern and Western European countries was made by Çelik et al. This method, which was prepared in accordance with the principles published by the Canadian National Research Association, differs from many other screening methods because it can be applied to structures with different type of structural systems. It is aimed to conduct a detailed analysis of buildings in terms of seismic risk according to the specifications using the seismic priority index (SPI) obtained by summing the structural index (SI) and the non-structural index (NSI). (Çelik, 2007)
In a study conducted by A. Yakut et al., masonry and reinforced concrete types buildings were taken into consideration because they are the most commonly used structural systems. (Ruby, 2012). The developed method involves the application of parameters obtained from outside observation or from inside of the buildings to 1-7 story reinforced concrete structures. These parameters can be listed as structural system, number of floors, building position, weak and soft floor, vertical and horizontal irregularities, heavy front hangers, adjacent building, short column, topography, soil type. Analytical studies were conducted on the method and the validity of the method was accepted. (Dogan, 2012).
P25 Rapid Evaluation Method is another metholodgy to evaluate seismic risk of the reinforced concrete buildings rapidly and reliably (Bal, 2007). Rather than determining damage levels of buildings, many parameters are considered in the method which aims to determine the buildings as “safe” or “unsafe” to prevent loss of life. The decision is made about the building according to the P-result score. If the result is below the limit value and the building is classified as “unsafe” if the result is above the limit value the building is classified as “safe”. Calibration of the method was carried out on 289 real buildings exposed to earthquakes and 22 new buildings designed according to 2007 Turkish Building Earthquake Code. The reliability of the method has been scientifically demonstrated by the fact that the result scores of 17 collapsed buildings are below the limit score. (Bal et al., 2007).
In this study, it is aimed to determine the status of the building stock of Kahramanmaraş by P25 Rapid Evaluation method. P25 Rapid Evaluation Method was applied to 42 official and 300 private buildings to determine failure risk of buildings during earthquakes.
P25 rapid evaluation method
Preliminary studies of this method was started with the research of Tezcan (Tezcan, 2005) with ‘Zero Life Loss’ project and developed with the support of TUBITAK. This method has been tested on 323 buildings damaged in earthquakes in Turkey at different times (Bal et al., 2008). Very successful results have been achieved by applying P25 Method on 23 undamaged, moderately damaged or collapsed buildings affected by previous earthquakes. 19 buildings exposed to Golcuk earthquake (Mw = 7.4), 1 building exposed to Bingöl earthquake (Ms = 6.4) and 3 buildings exposed to Adana earthquake (Mw = 6.3) were used as examples. The results were also compared with the peak displacements, impact/capacity ratios of the sample buildings. Thus, It has been shown that buildings which were scored according to certain parameters can be divided into two groups with P = 35 line and buildings that have a risk of collapse can be seperated from the others. (Gulay et al., 2008).
In the final version of the P25 method, seven different evaluation points representing the risk of seven different failures, primarily P1, P2, ..., P7, are calculated instead of a single collapse score. Then, the building result score “P” is calculated by taking into account the interaction of these seven different collapse points. In the application of the method, the importance of the building, the degree of seismicity of the region, live load coefficient and the topography of the land are corrected with a multiplier. P performance score range from 1 to 100 (from worst to best) is obtained and information about the collapse potential of the building is determined (Bal, 2012),(Kutanis,Işık,2013). The procedures to be followed during the implementation of the P25 Rapid Evaluation Method are described in the following sections.
Necessary investigations
Each building should be represented by a suitable coding so that its information can be easily accessed at any time. For this purpose, the name of the building, open address, construction year and the number of floors are processed as an identification information. Static and architectural projects of the building should be examined in order to apply P25 Method. If buildings do not have a static and architectural projects or they cannot be found, the position and dimensions of the structural system and infill walls should be determined by performing an architectural survey. On-site inspections, especially the ground and/or basement floors, which are called as critical floors, should be observed and the suitability of the structural system to the project should be checked, as well as their dimensions and reinforcement conditions (reinforcement diameters, transverse reinforcement spacing and corrosion condition). (Gulay, 2008)
Effective floor area and critical floor selection
Since all calculations in the P25 method are based on the critical floor and the one above it, the critical floor should be determined. The critical floor is generally taken as the ground floor, but in some cases, the basement floor can be taken as a critical floor in a building with a basement floor. In order to select the basement as a critical floor, there should be no shear wall or low percentage of shear wall that basement floor cannot be considered as rigid. The infill walls should have at least one contact with one of the reinforced concrete columns or should fill the frame in the structural system. Since the windows in infill walls will create discontinuity, they are marked in the architectural plan depending on whether the window is in the middle or in the corner of the infill wall. (Bal, 2007). The effective floor area is the smallest rectangle in which the building's ground floor area is located. The ground floor plan of the building is located in the cartesian system and the edge lengths a and b of the smallest rectangle are found. The effective floor area and floor inertia moments are then calculated in the x and y directions:
e
A
ab
(1) 3 12 x a b I I y ab312 (2)𝑪𝒂
cross-section index components
Cross-sectional areas, moment of inertia and indices of cross-sectional area, moment of inertia of columns, shear walls, infill walls in the critical floor are calculated. Area index is the ratio of column, shear wall and fill wall areas to effective floor area. Since this ratio is based on the effective areas of the elements in both directions, it will give different results for the accepted x and y directions in the cartesian system where the building is located. Area indices
C
AXand CAY: , 52(10 )
ef x Ax eA
C
A
(3) , 52(10 )
ef y Ay eA
C
A
(4) , ( ) ef x c sx m c wx A A A E E A (5) , ( ) ef y c sy m c wy A A A E E A (6)where
A
c,A
sxandA
wxare the sum of cross-sectional areas of the columns, reinforced concrete shear walls and infill walls on the critical floor,E
mE
cis the ratio of infill wall elasticity modulus to concrete elasticity modulus equal to 0.15.When the smaller of these area indices is taken as the minimum and the larger one is taken as maximum component, a weighted average index ıs calculated for the resultant area index (Bal, 2007):
,min min( ) A Ax Ay C C C CA,max max(C CAx Ay) (7) 2 2 ,min ,max
(0.87
)
(0.5
)
A A AC
C
C
(8)In Equation 8, the coefficients 0.87 and 0.50 are the trigonometric coefficients obtained according to the assumption that the earthquake is at an angle of 30° to the weakness direction of the building.
Resultant of
𝑪
𝑰moment of inertia index
The CIx and
C
Iymoment of inertia indices in the x and y directions of the columns, shear walls and infill walls in the critical floor and the resultant Inertia Moment Index are calculated as:, 5 0.2
2(10 )(
f x)
Ix xI
C
I
(9) , 5 0.2 2(10 )( f y) Iy y I C I (10) , ( ) m ef x cx sx wx c E I I I I E (11) , ( ) m ef y cy sy wy c E I I I I E (12) ,min min( , ) I Ix Iy C C C (13),max max( , ) I Ix Iy C C C (14) 2 2 ,min ,max
(0.87
)
(0.5
)
I I IC
C
C
(15)whereIcx,Icy= Total moment of inertia of columns in critical floor in x and y directions, Isx,Isy= Total moment
inertia of shear walls in critical floor in x and y directions, Iwx,Iwy= Total moment of inertia moments of infill walls in critical floor in x and y directions and
C
I= The resultant inertia moment index.The resultant moment of inertia index is again calculated based on the assumption that the earthquake is at an angle of 30° to the weakness direction of the building.
𝑷
𝟎structural system score
The
P
0structural system score, which reflects the structural system characteristics of the building, is calculated by dividing the sum ofC
A Resultant Cross-sectional Area Index and theC
IResultant Inertia Moment Index by a parameterh
0, which depends on the total height of the building:0 0 (CA CI) P h (16) 2 0 0.6 39.6 13.4 h H H (17)
where
h
0 is a correction factor for building height. H is calculated based on the total height of the building measured from the critical floor.𝑷
𝟏basic structural score
The
P
0structural system score is a raw score based on the area and moment of inertia values of the reinforced concrete and masonry elements, and the value ofh
0. TheP
1 basic structural score of the structure is obtained by multiplying thisP
0 raw score with certain correction coefficients. These correction coefficients are determined according to various irregularities of the structure, material properties, soil and foundation type.14 1 0 1 i i f
P
h
(18)where; coefficients having effects on the irregularities of structures. The basic structural score of
P
1 is obtained by multiplying these values with the Po score consecutively.𝑷
𝟐short column score
Short column is a column whose length is less than the length of the other columns in the building and it is expected to fail in brittle shear failure. In previous studies such as FEMA 154 (1988); Gülkan and Yakut, (1994); Sucuoglu and Yazgan, (2003), the short column factor was taken into account while calculating the building performance score and weighting factors ranging from 0.11 to 0.44 out of 1 are used for the short column (Inel and Ozmen, 2006). However, besides the determination of the presence of short column, it is also important to determine the ratio of short column length to floor height (i.e. how short the column is) and to what extent they are present in the floor (Gülay 2008).
𝑷
𝟑soft story and weak story score
The ground floor of many buildings is weakened and become the focal point of damage due to the fact that the height of the ground floor is higher than height of normal floor for various purposes and/or absence of the masonry infill walls, which have a significant contribution to the horizontal strength of the building, on the ground floor.
P
3 Soft story and weak story score, which represent this weakness, is determined by Equation 19:0.6 1 3
100
i a r ih
P
r r
h
(19) , , 1 1 ef i a ef i A r A (20) , , 1 1 ef i r ef i I r I (21)where
h
i andh
i1story height of the critical floor and the floor above the critical floor,r
a andr
r in Equations 20 and 21 show the ratios of the column, shear walls and infill walls of the critical floor and the floor above it in terms of effective area and effective moment of inertia:r
a andr
r values are averaged separately for the x and y directions.𝑷
𝟒overhangs and frame discontinuity score
Heavy overhangs on the ground floor, which are widely used in our country, cause mass irregularity in the building, move the earthquake moment arm upwards and form frame discontinuity by shifting the beam axes between the exterior columns. In a study conducted by Bal and Özdemir (2006), it was found that this type of irregularity caused strength loss between 4% and 54% in buildings.
𝑷
𝟓collision score
The P5-collision score represents the collision risk of two adjacent buildings. In these studies, it was determined that the building at the end of the adjacent building series is very risky. In addition, due to the principle of energy conservation, it can be seen from the previous earthquakes that the buildings adjacent to each other but having different periods due to their heights and weights have high risk. (Athanasiadou, 1994, Tezcan 1996). Collision is called central collision if the line joining the center of gravity of the two adjacent buildings passes through the middle of the common line where the two buildings will collide, otherwise it is called eccentric collision.
𝑷
𝟔liquefaction potential
It is important that the soil characteristics should be determined before any rapid or more detailed evaluation of the buildings. Liquefaction potential is determined as low, medium and high depending on various soil parameters. Determination of the liquefaction potential is described by YOUD et al. (2001) and Tezcan et al. (2004). P6 liquefaction potential score is taken as 100 on soils without liquefaction potential.
𝑷
𝟕soil movements score
It should be determined whether any of the four different kinds of ground movements can ocur such as large settlements, lateral dispersion, landslide and retaining wall collapse.
Correction factors
α correction factors
The
P
min score is the smallest (representing the highest risk) to be selected among the sevenP
i failure risk points.min
P
score must also be corrected with a correction factor α according to the characteristics of the building and its location. The correction factor α is calculated by Equation 22 considering building importance coefficient I, effective acceleration coefficient A0, live load multiplier n and topographic location coefficient t. The nominalvalue of the topographic t coefficient is equal to 1.0. This coefficient is equal to 0.85 if the building is located on a hill and this coefficient is equal to 0.7 if the building is located on a steep slope.
0 1 1 (1.4 ) 0.4 0.88 a A t I n (22)
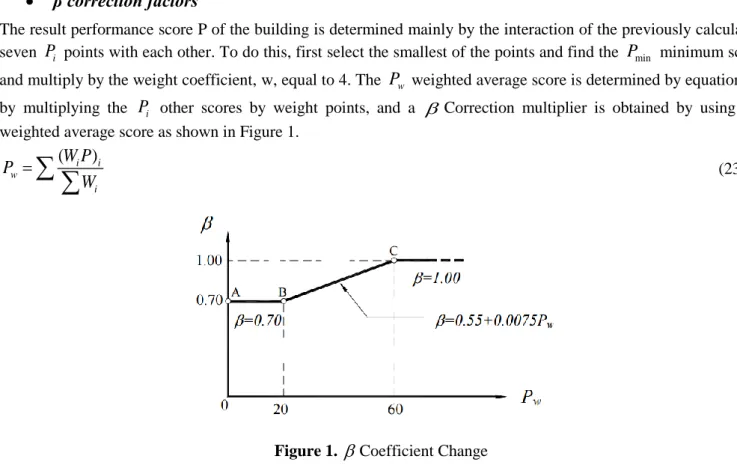
β correction factors
The result performance score P of the building is determined mainly by the interaction of the previously calculated seven
P
i points with each other. To do this, first select the smallest of the points and find theP
min minimum score and multiply by the weight coefficient, w, equal to 4. TheP
w weighted average score is determined by equation 23 by multiplying theP
i other scores by weight points, and a
Correction multiplier is obtained by using the weighted average score as shown in Figure 1.(
i)
i w iW P
P
W
(23)Figure 1.
Coefficient ChangeCalculation of correction factors
After completing the aforementioned steps, another correction step is taken into account for 25 correction factors. These correction factors are determined by taking the positive and negative aspects of the building into the account.
P score
The result score P, which determines the performance of the building, is calculated using the a and
correction factors as shown below;min
P
P
(24)where
P
min is the smallest of the sevenP
i evaluation points. With the result P score, it will be possible to evaluate whether the building has a risk of total collapse or a more detailed evaluation is required.The structures evaluated according to the P25 method are defined in one of the three regions described below according to the P-Result score:
Zone 1 (Low risk band)
P
35
: The probability of a total collapse is low, or it is unlikely to collapse and cause loss of life, so it is not a high priority to evaluate the building in detail. It is assumed that the buildings will get lighter (or moderate) damage than the buildings in other two zones. It is, of course, impossible to make a prediction of the future damage of the buildings in this region. However, this zone is relatively the best zone in terms of the potential for damage and can be described as the zone with the lowest probability of total collapse. Zone 2 (Detailed evaluation band) 35 > 𝑃 > 25: This zone is a zone of uncertainty. Since it is not possible to determine whether the buildings in this zone will collapse and cause loss of lives, a more detailed seismic evaluation is needed to eliminate these uncertainties. After detailed seismic evaluation some of the building will be included in the Zone 1 but some of the buildings will be transferred to Zone 3. In cases where a large number of buildings will be evaluated and uncertainty will increase, technical considerations, financial constraints and risk-taking will determine the width of this zone. This is because this zone is directly related to cost.
Zone 3 (High risk band) 𝑃 ≤ 25: The probability of collapse of buildings in this region is high enough that it does not require a second and more detailed evaluation. Based on the information that the buildings with this zone score were completely destroyed in the real earthquake, the buildings in this zone will be either emptied and demolished or refortified immediately. One of the main objectives of the ‘Zero Life Loss’ project and the P25 Rapid Evaluation Method is the rapid removal of buildings falling into this zone.
FIELD STUDY
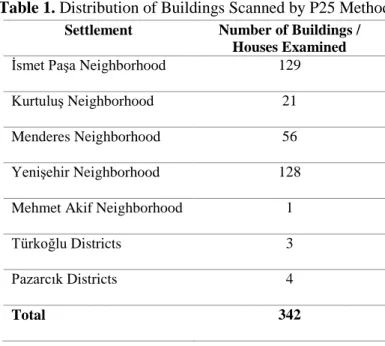
In this case study, evaluation of building stock in centrum and districts of Kahramanmaraş were done by P25 Rapid Evaluation Method. 342 of the official and private buildings in 5 neighborhood and 2 districts given in the Table 1 were evaluated. In this study, buildings with 25 points or below were evaluated in the “High Risk” group and buildings with 35 points or above were evaluated in the “Low Risk” group.
Table 1. Distribution of Buildings Scanned by P25 Method
Settlement Number of Buildings /
Houses Examined
İsmet Paşa Neighborhood 129
Kurtuluş Neighborhood 21
Menderes Neighborhood 56
Yenişehir Neighborhood 128
Mehmet Akif Neighborhood 1
Türkoğlu Districts 3
Pazarcık Districts 4
Total 342
The geological map for the field study was given in Figure 2. The possible liquefaction status of the region is theoretically determined by considering the ground characteristics and groundwater levels in this map. In the studied area, there are generally loose slope debris in the form of a cone of gravel, sand and clay units, and alluvial units consisting of sandy silty clay and occasionally gravel units. Groundwater level varies between 5-6.5 m in this
region. When ground properties and groundwater conditions are taken into consideration, liquefaction risk is observed in the region.
Figure 2. Geological map and groundwater status of the study area and its vicinity (DSİ, 2018)
Method
During the evaluation preparation stage, firstly the relevant Governorate, District Governorate and Municipality were informed the purpose of the study and the importance and necessity of evaluating the building stock with P25 Rapid Evaluation Method was explained.
After obtaining the necessary permission and approval from the institutions and related organizations, a research team consisting of 8 people was established by assigning two people from the institutions with civil engineers. The research team was informed about the P25 Rapid Evaluation Method and its application in the field. After the training, information forms prepared for the buildings were introduced. Contact information of building managers was taken and information meetings were held within the scope of a plan in the field. Participation of building managers in the study was ensured and measurement days were shared within the scope of the work plan. After the consensus was reached on the work plan prepared with the study team, the task distribution was made and the studies were started.
Results
Considering all the results obtained, the results of the buildings in the field were scored out of 100 and the buildings with 25 points and lower were assigned to the high risk group, the buildings with points between 25 and 35 were assigned to the detailed evaluation band and the buildings with 35 points and above were assigned to low risk group.
In total 342 buildings were evaluated. 100 buildings were in the high-risk group, 121 buildings were in the detailed evaluation band and 121 buildings were in the low-risk group. The distribution of the Public and Private buildings was given in Table 2. When the average results of public and private buildings are considered, these results represent average condition of the building stock in Kahramanmaraş Province.
Table 2. The Distribution of the Public and Private Buildings
Number of buildings in the high-risk group
P<25
Number of buildings in detailed evaluation band
25<P<35
Number of buildings in the low-risk group
P>35
Kamu binaları 21 12 9
Özel binalar 79 109 112
Toplam 100 121 121
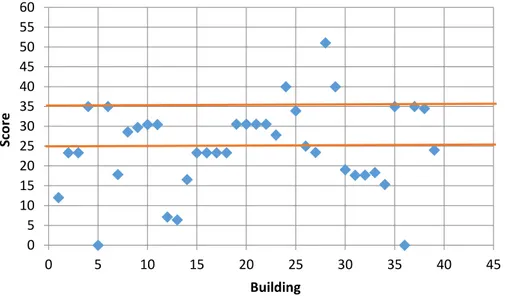
42 public buildings were evaluated in total. 21 buildings with P value less than 25 were in high-risk zone, 12 buildings with P value between 25 and 35 were in detailed evaluation zone and 9 buildings with P value greater than 35 were in low-risk zone as shown Figure 3.
Figure 3. Score of Public Buildings
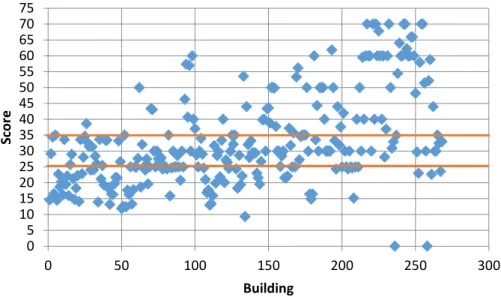
In the same manner, 300 private buildings were evaluated in total. 79 buildings with P value less than 25 were in high-risk zone, 109 buildings with P value between 25 and 35 were in detailed evaluation zone and 112 buildings with P value greater than 35 were in low-risk zone, as shown Figure 4.
0 5 10 15 20 25 30 35 40 45 50 55 60 0 5 10 15 20 25 30 35 40 45 Sc o re Building
Figure 4. Score of Private Buildings
When the buildings were classified according to neighborhoods as shown Table 3, it is found that 50 buildings in İsmetpaşa neighborhoods, 12 buildings in Kurtuluş neighborhoods, 17 building in Menderes neighborhoods, 18 buildings in Yenişehir neighborhoods, 1 building in M.Akif neighborhoods, 1 building in Türkoğlu district and 1 building in Pazarcık district had P value less than 25 so 100 buildings in total were in high-risk zone. It is also found that 54 buildings in İsmetpaşa neighborhoods, 8 buildings in Kurtuluş neighborhoods, 24 building in Menderes neighborhoods, 32 buildings in Yenişehir neighborhoods, 2 building in Türkoğlu district and 1 building in Pazarcık district had P value between 25 and 35 so 121 buildings in total were in detailed evaluation zone. Finally, it is found that 25 buildings in İsmetpaşa neighborhoods, 1 building in Kurtuluş neighborhoods, 15 buildings in Menderes neighborhoods, 78 buildings in Yenişehir neighborhoods and 2 building in Pazarcık district had P value greater than 35 so 121 buildings in total were in low-risk zone.
Table 3. Distribution of P25 Score by Location
Status of Buildings Number of
Buildings in Very Risky Band P<25 Number of Buildings in Detailed Review Band 25>P<35 Number of Buildings in Low Risk Band P>35 İsmetpaşa Neighborhoods 50 54 25 Kurtuluş Neighborhoods 12 8 1 Menderes Neighborhoods 17 24 15 Yenişehir Neighborhoods 18 32 78 M.Akif Neighborhoods 1 - - Türkoğlu 1 2 - Pazarcık 1 1 2
RESULT AND RECOMMENDATIONS
In this study, the earthquake scores of 342 reinforced concrete structures in Kahramanmaraş Province were investigated by P25 Scoring Method. It was found that 35% of the buildings did not have any risk of collapse, 35% of the buildings were in the detailed examination band, and 30% of the buildings were at risk of collapse. In this study, the buildings were examined in two groups as public and private buildings. 50% of the public buildings were at risk of collapse, 29% of the public buildings were in the detailed examination band and 21% of the public
0 5 10 15 20 25 30 35 40 45 50 55 60 65 70 75 0 50 100 150 200 250 300 Sc o re Building
buildings did not have any risk of collapse. In private buildings, %26 of the buildings were at risk of collapse, %36 of the buildings were in the detailed examination band and %38 of the buildings did not have any risk of collapse. As a result of these studies;
One third of the buildings were in the Detailed Examination Band, which reveals the necessity to carry out studies for more detailed results.
In calculating the “P Performance Scores”, the effect of 14 correction factors is taken into consideration. It was observed that 14 correction factors affect the earthquake behavior of the buildings.
The P25 Rapid Evaluation Method discussed in this study gives quite accurate results. However, as in all empirical methods, there is a margin of error in this method. It is necessary to try this method by increasing the number of sample buildings in order to keep this error margin to a minimum.
As a result, it is necessary to quickly determine whether the performance of existing buildings in our country is adequate according to the current earthquake regulation.
REFERENCE
ATC-21 : Applied Technology Council. Federal Emergency Management Agency. Washington DC.
Athanassiadou C J, Penelis G G, and Kappos A J (1994) “Seismic Response of Adjacent Buildings with Similar or Different Dynamic Chracteristics”, Earthquake Spectra, 10(2):293-317.
Bal, İ. E., Ozdemir, Z. (2006) “The Adverse Effects of Perimeter Frame Discontinuity on Earthquake Response of RC Buildings”, 7th International Congress on Advances in Civil Engineering, October 11-13, 2006, Istanbul, Turkey.
Bal, İ.et al., 2007. “P25 Rapid Screening Method to Determine the Collpase Vulnerability of Reinforced Concrete Buildings ”Sixth National Conference on Earthquake Engineering, 16-20 October 2007 Istanbul, Turkey.
Bal İ and et al., 2008. A New Approach For The Prelımınary Seısmıc Assessment Of Rc Buıldıngs: P25 Scorıng Method, The 14 th World Conference on Earthquake Engineering October 12-17, 2008, Beijing, China.
Boduroğlu, M. Hasan et al., 2007 “'' A Screening Method for Evaluating Existing Structures '' Sixth National Conference on Earthquake Engineering .16-20 October 2007, Istanbul. 10p.
Celik O. C., İlki A., Yalcın C., Yüksel E., October 2007 “An Experience on Rapid Assessment of Earthquake Risk of Different Type Buildings in Eastern and Western European Countries ”Sixth National Conference on Earthquake Engineering, Istanbul.
Dogan, Meltem, 2012. P25 and Durtes Pre-evaluation Methods and Application to Damaged Buildings in 1999 Düzce Earthquake, Master Thesis. Istanbul Technical University, Institute of Science and Technology, Istanbul.213p.
Devlet Su İşleri (DSİ) 20. Bölge Müdürlüğü, Jeoteknik Hizmetler ve YAS Şube Müdürlüğü, Kahramanmaraş FEMA 154, 1988. Rapid Visal Screening of Buildings for Potential Seismic Hazards. A Handbook, Federal Emergency Management Agency, Washington.
Gulay, Gulten et al., 2008, Calibration of P25 Scoring Method Developed for Earthquake Safety of Buildings and Pilot Zone Application, TUBITAK Project (106M278), Istanbul, 129p.
Hassan, Ahmed F. and Sozen, Mete A., Seismic Vulnerability Assessment of Low-Rise Buildings in Regions with Infrequent Earthquakes, ACI Structural Journal, January - February 1997. 31-39,
Işık E., Kutanis M., 2013 “Bitlis İlindeki Betonarme Binaların P25 Hızlı Tarama Yöntemi ile Değerlendirilmesi” BAÜ Fen Bilim Enstitü Dergisi 21-29p.
İnel M., Bilgin H., Ozmen H. B., May 2006 “Performance Evaluation of Existing Public Buildings "TMH - Turkey Engineering News / Issue 444-4445, 4- 5.17p
Japan Building Disaster Prevention Association, 1990, “Standart For Evaluation of Seismic Capacity of Existing Reinforced Concrete Buildings”, Tokyo. 8s.
Oztorun N. K., vd. 2004 “Integration of Durtes and General Purpose Finite Elements with Expert Computer Program for Rapid Detection of Structures’’ İMO Seventeenth Technical Congress and Exhibition.13s.
P. Gulkan, A. Yakut, H. Sucuoğlu, M. S. Yucemen, E. Çıtıpıtıoglu, Damage Detection Form for Engineering Structures, Earthquake Engineering Research Center, ODTU, Ankara, (1994).
Sucuoglu H and Yazgan U (2003) “Simple Survey Procedures for Seismic Risk Assessment in Urban Building Stocks”
Wasti ST, Ozcebe G (ed.) of Seismic Assessment and Rehabilitation of Existing Buildings, Earth and Environmental Sciences, (29): 97-118.
Sucuoglu H., October 2007 “Determination of Earthquake Risks in Urban Building Stocks by Street Scanning Method ”Sixth National Conference on Earthquake Engineering, Istanbul
Tezcan S., Bal İ. E., Ozdemir Z., Kucuk F., September 2005 “How to provide “zero Kay loss of life in earthquake?”
Construction Site Construction Machinery and Architecture Magazine, Number: 232, Pg: 108-112.
Yakut A., 2012 “Rapid Seismic Assessment Procedures for Turkish Building Stock” Seismic Engineering Research Infrastructures for European Synergies, Series Workshop Role of Research Infrastructures in Seismic Rehabilitation, February 2012, Istanbul.65p
Youd T L, Iddriss I M, Andrus R D, Arango I, Castro G, Christian J T, Dobry R, Liam Finn W D, Harder L F, Hynes M E, Ishihara K, Koester J P, Liao S S C, Marcuson II W F, Martin G R, Mitchell J K, Moriwaki Y, Power M S, Robertson P K, Seed R B, and Sotokoe K H (2001) “Liquefaction Resistance of Soils: Summary Report from the 1996 NCEER and 1998 NCEER/NSF Workshops on Evaluation of Liquefaction Resistance of Soils”, Journal of Geotechnical and Geoenvironmental Engineering, 127(10):817-833.
Tuysuz, Selim, 2007. Determination of Breakdown Risk of Reinforced Concrete Buildings by Rapid Assessment Methods: P25 Scoring Method, Master Thesis. Istanbul Technical University, Institute of Science and Technology, Istanbul.120p.