DRUG BIT CUTTING TRACE IMAGE COLOURS AND CUTTING FORCE FLUCTUATION RELATION
1Mehmet Kemal GÖKAY, 2Arif Emre DURSUN
1Selcuk University, Faculty of Engineering, Mining Engineering Department, Campus, KONYA 2Selcuk University, Vocational School of Technical Sciences, Property Protection and Safety, Campus, KONYA
1[email protected], 2[email protected]
(Geliş/Received: 16.06.2016; Kabul/Accepted in Revised Form: 29.09.2016)
ABSTRACT: Rock cutting is developing area in mining and tunnelling sectors. In order to open an
excavation inside or surface of the rock masses, they should be dig up to obtain required engineered volume. Beside the conventional blasting methods result in total breakage of the selected parts of rock masses, rock cutting machineries are used in some engineering projects which they have cutting bits to trim the rock masses into small chips. Drag bits, as a type, is one of the bit kinds which researchers have analysed for its design parameters for different rock masses. When rock bit cutting performances are under consideration, laboratory cutting tests are performed and rocks are cut with different bit profiles to evaluate its design parameters. In these researches cutting traces have mostly been photographed for test file data. It was realised here in this research and analyzed some of these images for their colour properties. Different coloured sectors were determined along the selected cutting trace images which were compared also with the cutting force records of the related cutting tests. The colour distribution and colour difference areas of the trace images were then analysed with the cutting actions and rock mass features. The resultant enhanced coloured images and cutting forces fluctuation data obtained during cutting tests of drag bits showed that colour analysed can also be the indicators of cutting performance if they are carefully appraised.
Key Words: Rock cutting tests, Cutting traces, Drag bits cutting traces, Colour analyses, Colour analyses of rock
cutting trace images.
Kama Keskinin Oluşturduğu İzlerdeki Renkler ve Kesme Sırasında Ölçülen Kesme Kuvvetiyle İlişkisi
ÖZ: Maden ve tünel kazı aşamalarında, kaya kesme çalışmaları üzerinde araştırma yapılan konular
arasındadır. Kayaçların içinde veya üzerinde herhangi bir mühendislik uygulaması için bir boşluk oluşturulacaksa, orada kaya kütlesinin parçalara ayrılarak boşaltılması gerekecektir. Kayaçları istenen boyutlara göre tamamen parçalayarak kazılması işlemlerini içeren klasik patlatma-yükleme-taşıma sistemine karşılık kazıcı makinelerin keski uçlarıyla kayayı çentikleyerek sürekli kazması ve otomatik olarak yüklemesine bağlı mekanizasyon sistemleri de geliştirilmiştir. Bu uygulamalarda kullanılan keski uçlarının hangi kaya kütlelerinde daha verimli olduğunun araştırılması uçların tasarım parametrelerinin belirlenmesinde önemlidir. Bu çalışmalarda, keski izlerinin fotoğrafları veri olarak arşivlenen sonuçlardandır. Bu araştırma kapsamında, kama keski uçlarının kullanıldığı kesme deneylerinde ortaya çıkan keski izleri üzerinde renk analizleri yapılmıştır. Keski izlerinde belirlenen renk öbeklenmeleriyle, bu kesme deneyleri sırasında ölçülen kesme kuvveti değişimleri karşılaştırılarak değerlendirilmiştir. Ölçülen ve grafiği çizilen kesme kuvveti değişimleriyle, keski izlerinde belirlenen renk farklılıklarının belirli ölçüde uyum içinde olduğu ve keski izlerinde belirlenecek renk öbeklenme ve kodlamalarının kesme performansı hakkında fikir verebileceği değerlendirmesi yapılmıştır.
Anahtar Kelimeler: Kaya kesme deneyleri, Keski izleri, Kama keski izi, Renk analizi, Keski izlerinde renk analizi.
INTRODUCTION
Rock cutting machines have been used for many purposes in underground and surface excavation purposes. Types of excavators are varied according to the jobs they have been produced for. Some of them are manufactured for mine gallery (or tunnel) excavations for soft rock materials, some other types might be produced for hard rock excavation environments. There are excavation machines also for coal and soft clay seams for faster mining operations. These machines have been equipped with cutting bits which can be drag, point-attack, disk, roller or button in types. Cutting bits’ performances have been explored in last 30 years to produce more effective bits for different rock types. Since rock masses are different in each mining and tunnelling project sites, cutting machines and their projected bits are advised to be analysed in detail before giving any decision about rock cutting operations (Gokay and Dursun, 2013). When cutting tests are concerned, the cutting force and specific energy for selected rock samples should be determined for each rock excavation projects. These parameters are main design parameters which researchers are concentrated on. In these researches, the traces which were created during the rock cutting tests were usually examined for their appearances if they have any clue about the cutting performances. The plain photographs of cutting traces were obtained and filed for test data archives. This has been common application nowadays which engineering firms follow. The study performed here, concentrates on these cutting trace images, photographs. They were analysed by common photographic pixel analysers like Photoshop software program to produce any unseen evidences, clues, on them by naked eyes. It was determined that photographs of the selected drag bit cutting tests have their own colour clues, sectors, for the researchers. Fresh rock-chip fracturing and rock breakage due to existing micro cracks in rock masses have different image properties and they were determined from the trace images after colour enhancement works were performed in this work. Digital colour coding of the drag bit cutting traces and applied cutting force differentiations have then been compared to understand the significance of the detected dissimilar coloured sectors, along these traces.
Performance of the mechanical cutting is highly depending on the cutting bits. There are two main types of cutting bits; drag and disk types. Disk type bits are generally used for full face tunnel excavation machines. Chisel or drag types of bits on the other hand are used at roadheaders, coal ploughs, coal face cutting machines, continuous miners and tunnel excavation equipments. Since drag bits are economic to be produced and in some circumstances, they are good in performance for certain rock cutting conditions, they are preferred to be used more widely. They are made up from tungsten carbide and cobalt allays to get very strong in mechanical behaviour together with high temperature resistance. These two properties are very important in rock cutting. Due to friction between bits and rock surfaces along the cutting traces, working temperatures of bits are risen up to very high levels. Beside, cutting bits are under influence of high stresses during cutting. Because mechanical power supplied by cutting machine is concentrated on a few rock bits to break the rock masses into numerous chips.
According to Roxborough (1973) tungsten carbide and cobalt powder size distribution should be very similar to get high quality cutting bits. Drag bits should also have high impact resistance and high hardness. During raw materials' composition arrangements in drag bit production, if cobalt amount (percentage in the mixture) is decided to be increased the resultant bit hardness is lower, but bit's strength is higher.
Figure 1. Drag bit's design parameters
Fc
Fn
Fn
n
In order to obtain hardest cutting bits, cobalt percentage in raw material before their production should be arranged to 10-15%. Cutting performance of the drag bits are also influenced by their shapes and dimensions. Design factors influencing rock cutting performance of the drag bits are shown in Fig.1 and they are: rake angle, (α), clearance angle (β), cutting depth (d), normal force (Fn) and shear, cutting, force (Fc). When the shape of drag bit is changed with differentiating α and β angles separately, required cutting force (Fc) is also varied for different normal force (Fn) conditions. First methodological explanation in mechanics of cutting was given by Merchant (1945). Merchant defined required cutting force (Fc) in metallic material cutting operation as a dependable function of shear strength, bit's rake angle, bit's cleaning angle and depth of cut. After almost 40 years later, Evans (1984) produced new approach for coal cutting procedures. Evans preferred to use tensile strength instead of shear strength of coal to calculate required cutting force, (Fc). There are a few more approaches to calculate related cutting force, (Fc), in these criteria, researchers facilitated the rock cutting test parameters and rock material properties together (Dursun, 2012).
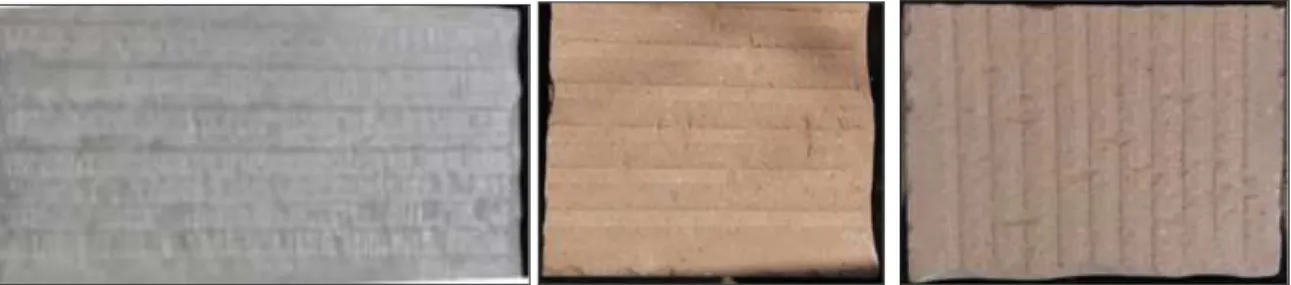
Figure 2. Cutting traces obtained on rock slaps during rock cutting tests. Each trace represents separate
tests which might be performed to search different cutting parameters
Rock cutting tests have usually been performed in laboratories by especial test apparatus. Beside the main test data, cutting traces on the tested rock surfaces are also the results of these tests and examples of them can be seen in Fig.2. Image colour analyses performed according to colour differences detected along the photographs of cutting traces were main study here. When the photographs of the traces were compared together with the cutting force, (Fc), graphics, it is important to point out some categorized features. Colour distributions along each trace were different in characters so colour map obtained of each trace was considered like a fingerprint of that trace. In most of the cases, naked eyes can not recognise all the coloured zones along the cutting traces. Photographic image analyses on the other hand showed that colour differentiation areas which were determined on the selected traces strictly coincided with cutting performance. Rock and coal cutting are mostly performed by drag bits and "fractured hard rock material breakage" or "softer rock material cutting" achievements are detected during the cutting tests which produce selectable colour differences on their cutting traces.
ROCK CUTTING TEST EQUIPMENT FOR MARBLE SLAPS
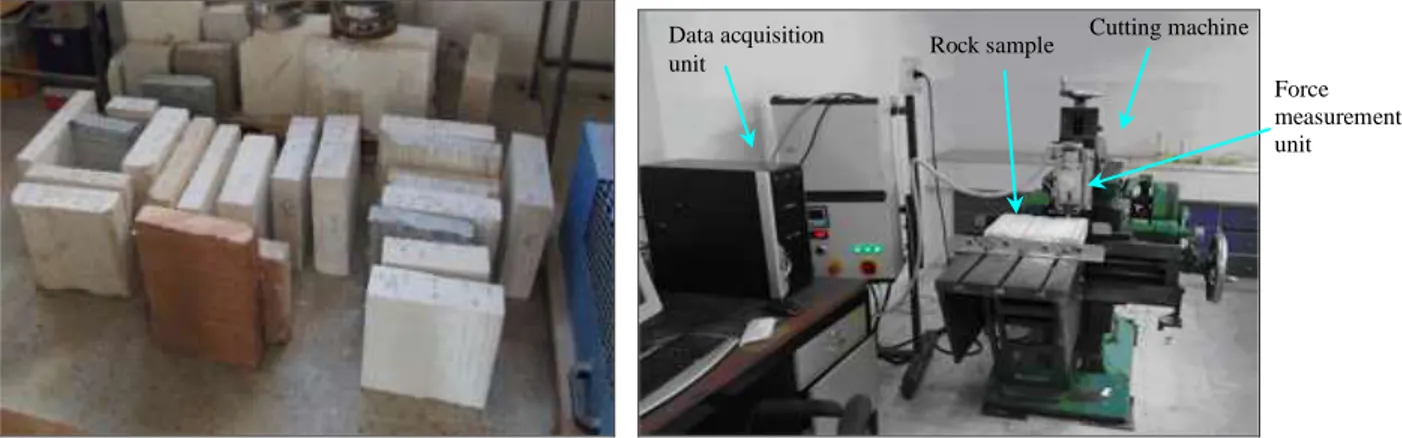
Rock cutting tests in this study were performed by drag bits in Mining Engineering laboratory of Selcuk University (Konya-Turkey) to calculate specific cutting energy for the selected rock samples (Fig.3). Rock cutting research was executed by Dursun (2012) and rock samples were tested one by one for their specific energy calculations. The research was organized according to international standards given by McFeat-Smith and Fowell (1977). This standard describes the small scale cutting test sets. Rock samples were blocked in the laboratory before the cutting tests to suit test equipment (Fig.3 and 4). Rock samples' dimensions were 30x30x10 cm. Tests were repeated for each cutting trace over the selected rock sample surfaces with the same drag bit (rake and clearance angle were unchanged) for the same cutting depth. After attaching drag bit to the test equipment, cutting depth was arranged through test equipment mechanisms. Rock cutting test equipment were then used to apply normal (Fn) and cutting
forces (Fc) to attached drag bit where these forces had been measured (Fig.4) separately and saved automatically (Fig.3) through force measurement unit.
Figure 3. Rock slaps and cutting test equipment used during rock cutting tests (Mining Engineering
Department, Selcuk University, Konya, turkey), (Dursun, 2012)
Figure 4. Drag bit attached to test equipment and cutting traces obtained during the tests (Dursun, 2012)
Cutting machine shown in Fig.3 was a commonly used metal cutting machine in mechanics warehouses and it was modified for rock cutting test purposes in Selcuk University. This machine was selected because of its high electric motor power (4 kW) and its heavy & strong body structure. It has cutting arm which has a stroke up to 450 mm which is enough to test 300 mm long rock samples. Vibration at cutting machine and its cutting arm were carefully observed during this research for its influences on the performed tests. Since the machine was selected heavy enough for the selected rock samples and selected rock cutting depths were chosen accordingly, machine body vibration was fixed in a minimum level which was not influencing the cutting tests. When the rock samples were put on sample holder plate, this plate was moved with test sample by means of a gear mechanism to get left-right and up-down movements. These movements helped the researchers to arrange predetermined, planned, positions for the tests. Before each cutting test, drag bit horizontal position was arranged for next cutting trace and bit's vertical position was arranged for selected cutting depth. Test equipment used here (Fig.3) had a data acquisition unit which had its own electronic control parts together with computer. These parts were selected especially to suit very short cutting test periods (1-3 sec.). This unit collected test data, 1000 times per second, including; normal force (Fn), cutting force (Fc), voltage (V) and electric current (A) values. Drag bit used in the tests were attached to cutting machine together with a special attachment (Fig.4). This holder was directly connected to force measuring apparatus. During the tests here, 12.7 mm wide tungsten carbide drag bits were used.
Cutting machine Force measurement unit Rock sample Data acquisition unit Force measurement unit Chisel bit holder Chisel bit cutting traces
ROCK COLOURS, TRACE COLOUR SECTORS AND CUTTING FORCE FLUCTUATION
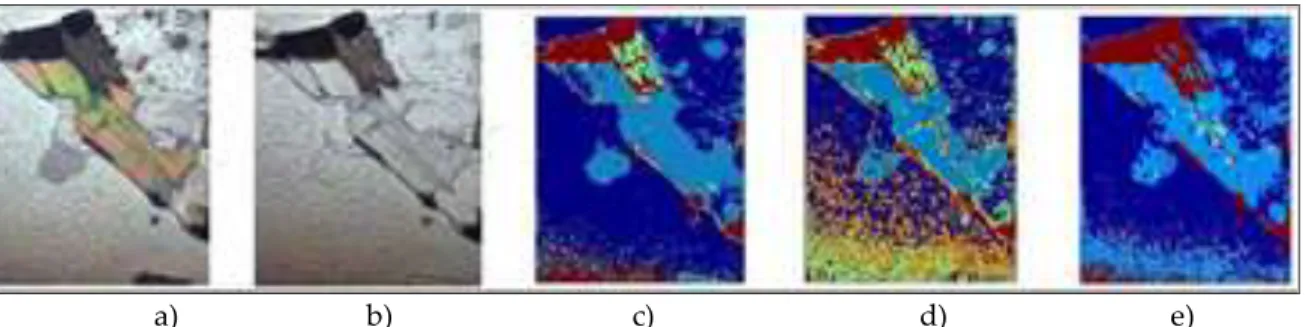
Differences in rock colours have been used to recognise the rock minerals through colour charts. Moreover, digital colour recognition apparatus have been used to identify solid materials' surface colours in more equipped way. Especial optical and electronic lens, cameras, especial lighting and computers are used in this machine image capturing technology and well documented in colour photography science and technology literature. Defects in human eyes (colour blinding, eye related problems, etc.) and repeatability of digital image analyses cause to research on rock surface colour recognition as well. Gokay and Uzdemir (1999) supplied a digital image evaluation work for marble surface colour identification and then the research has been expanded by the studies of; Gundogdu and Gokay (1999), Gokay and Gundogdu (2000; 2001; 2007). Surface colours of rocks have long been considered as one of the factors influencing the project in monumental buildings' restoration works. Pascua et.al (1999) determined the colour of construction material to use in restoration works to care for their original appearance. Concha-Lozano, et.al. (2013) for example performed visual tests to determine colour range of the replacement stones in monument repair works. By this way they selected stones which are aesthetically compatible. Fonseca (2012) on the other hand worked for properties of bricks and ceramic roof cover plates including their colours as well. Similar studies have been performed for colour changing of building stones due to micro-organisms and air pollutions in cities. Akkoyun et.al. (2013) studied on a computer program to obtain natural rocks' surface colour properties. They performed field studies on Orosei limestone (Sardegna, Italy). They produced statistical colour data for the selected limestone sample surfaces. In similar way Souse and Goncalves (2013) used colour analyses as well to distinguish the rock surface polishing states. In micro scale analyses, Baykan et al. (2010) used digitized images of thin rock sections to identify rock minerals. They concluded that results of colour analyses (Fig.5) performed by using a "Lab colour space" (L.a.b) system (Hunter, 1948) were similar to the outputs of "RGB colour model" (Poynton, 2003), but they were better than HSV results ( "Hue, Saturation, Value" representation in cylindrical coordinate system, Joblove and Greenberg, 1978).
In mining, beside the colour of minerals, aesthetic appearances of some rock surfaces are also important for their marketing. Construction of any buildings or any repairmen projects of historical monuments might require natural dimensioning stones or plated rock slaps (limestone, marble, travertine, granite, etc.) in pre-described colours and textures. In natural stone business, brand marks of stones have been selected, named, according to their colours, colour-homogeneity and textures. In some cases, due to natural stone mining conditions, natural stone products have not been supplied as previously agreed on. The results have generally been cancellation of rock slaps orders by the project owners in these cases. Gundogdu and Gokay (2003) and Gokay and Dogan, (2006) produced methodologies to define digital rock colour homogeneity and volumetric rock colour description respectively to offer digital description of rock slap colours and rock colour homogeneity. Agreement on digital stone surface colours together with pre-described digital variations in colours and homogeneity were assumed helpful for natural stone miners and end users in their business.
a) b) c) d) e)
Figure 5. Thin section obtained from a rock sample was photographed and digitized to get following
images: a) Cross-polarized images, b) Plane-polarized images, c) Images in RGB, d) Images in HSV, e) Images in (L.a.b). (Baykan et.al. 2010)
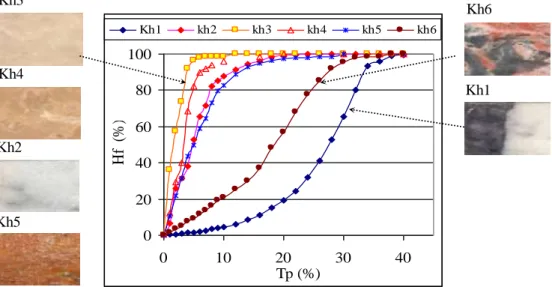
Rock surface colours, in-situ or fresh cut, demonstrate different colour features. Rock surface colours seem also different for polished or wet conditions. Rock surfaces; weathered or freshly cracked, dry or wet, polished or unpolished, are all appeared different in their photographs. These differences can also be intensified by using different lighting conditions (usage of different bulb types to get; daylight, Red, Green or Blue colour lighting). Gokay and Dogan, (2006) offered a barcode scheme to define rock surface appearances (Fig.6) includes mentioned colour features as well. Rocks, especially marble, travertine, granite, limestone slaps' surface have different colours. However, aesthetic point of view, colour distribution, homogeneity, on selected rock surface is also influencing factor on their marketing (Gokay, 2003). Therefore colour homogeneity of natural rock surface was researched to define their homogeneity. Gokay and Gundogdu, (2007) proposed colour homogeneity test (Fig.7) for rock slap surface colour distributions. Colour differences in selected surface area were analysed in this work pixel by pixel to determine unexpected change of digital colour value. Neighbouring pixels on rock surface image which had their own colour values were main starting points to analyse total colour homogeneity.
0 50 100 150 200 250 1 2 3 4 5 6 Görüntü durumu R enk de ğe ri
n_R n-G n-B k-R k-G k-B m-R m-G m-B y-R y-G y-B
Figure 6. Natural rock surface identification, coloured-barcode for Rosa-Beta granite (Gokay and Dogan,
2006). (Image obtained under following situation and lighting; 1.dry-front, 2. dry-back, 3. wet-front, 4. wet-back, 5. wet-break surface, 6. dry-break surface, n: normal day lighting, k: red lighting, m: blue
lighting, y: green lighting)
Figure 7. Colour homogeneity (Hf) description together with its tolerance percentage value (Tp) for the
selected marble images, (Gokay and Gundogdu, 2007) Kh1 Kh6 Kh3 Kh4 Kh2 Kh5 0 20 40 60 80 100 0 10 20 30 40 Tp (%) H f (% ) Kh1 kh2 kh3 kh4 kh5 kh6
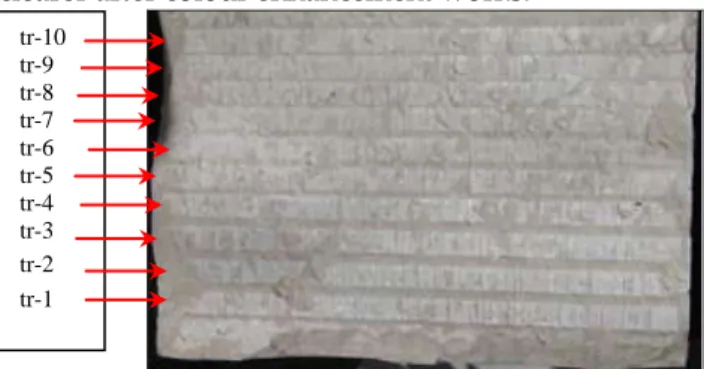
By using similar colour analyses, colour distribution along the rock cutting traces was explored in this research digitally to differentiate their colour zones. Drag bits’ rock cutting tests usually produce traces similar to images shown in Fig. 8 & 11. Rock cutting test equipment shown in Fig.3 was used here to excavate these traces with its 12.7 mm wide drag bit (Fig.4). During the cutting test, different drag width and depth were also used to understand their influence in rock cutting mechanism. Each cutting test was started at left side of the blocked rock samples and the gaps between neighbouring traces were arranged to 8 mm. Each rock cutting test was performed in very short period of time (about 1-3 second) and trace obtained in each test about 250 mm long. When the digital images of each trace were analysed one by one, separate coloured zones were recognised. Results of colour analyses performed for white marble cutting traces (trace 3 and 5) were illustrated in Fig. 9 and 10. Original photograph of each trace under inspection was given at the top of these figures. After obtaining original images of traces, they were processed by Photoshop programme to enhance their RGB colour bands separately to extra-graded their appearance. Enhanced image of traces have revealed more clearly the coloured zones. Since rock cutting test equipment measured and saved the cutting force, (Fc), fluctuation during test period, it can be graphed as seen in Fig. 9,10,12 and 13. These graphs present cutting force, (Fc), differentiation in total testing time (1-3 second). Maximum and minimum cutting force fluctuations can also be noticed on these graphs after illustrating the average value line on each graph. Maximum force values here stand for cutting difficulties during test period. In other words, drag bit applied more cutting force, (Fc), at these points to overcome and crack the rock barrier in front. Cutting force, (Fc), graph shapes are look like a kind of zigzag, crisscross, that means cutting force had always been in changing state, there was no stable time period for this variable. When trace of each drag bit cuts was controlled in detail, there were some spots along the traces where they looked like more shadowy, shiny, etc. After deciding digital colour analyses for cutting test traces, their digital images were taken carefully. Digital colour analyses showed also some differentiation in colours along the traces. Examples of these colour segregations can be seen in Fig.9, 10, 12 and 13. It was also recognized that there were related spots between coloured zones along cutting traces and cutting force (Fc) values. There were coloured zones detected for example along trace-3 for white marble (Fig.9) and they were circled for better illustration purposes. The position of circled coloured zones and low cutting force, (Fc), levels are coinciding here. Similar analyses were performed for red-tuff rock sample (Fig.11) and the resultant colour enhancements for selected cutting traces are given in Fig.12 and 13.
Enhanced coloured images of cutting traces have narrow (wideness : 2-3 mm) vertical coloured sectors interrupted with other coloured zones in some parts of traces. The trace lengths demonstrated in figures represent also the period of testing times. Trace width on the other hand represent the width of cut that is corresponding the width of drag bit (12.7 mm). Therefore vertical 2-3 mm coloured zones which were observed at some parts of traces represent "full contact cutting" of drag bit on that position of rock surface. Interruption in these “vertical thick line” type coloured zones are matched with the zigzag shape of cutting force, (Fc), graphics. Since drag bit's cutting action in hard rock has repetition of push, crack and relax periods, colour analyses of these traces have similar repetitive vertical colour bands which can be clearer after colour enhancement works.
Figure 8. Drag bit traces on white marble surface; 12.7 mm wide drag bit started the cutting from left
side of the specimen, (Cutting trace lengths were about 250 mm in average)
tr-10 tr-9 tr-8 tr-7 tr-6 tr-5 tr-4 tr-3 tr-2 tr-1
0 50 100 150 200 250 300 0 50 100 150 200 250 300 350
Sampling number (1,5 readings/ mm in average)
C ut tin g F orce (kg f)
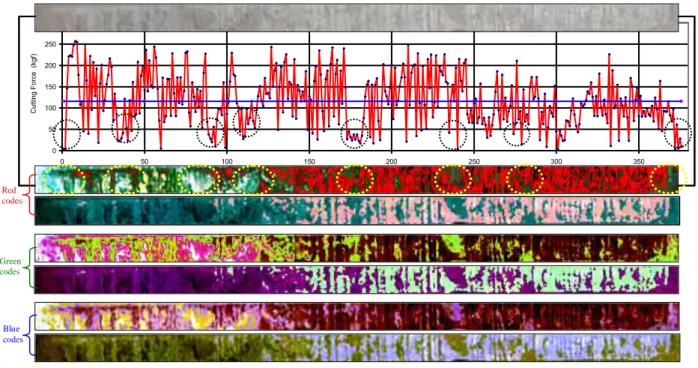
Figure 9. Cutting force fluctuation and colour zones, sectors which had been obtained during total time
of trace-3 cutting test of white marble, (First image at the top is original photograph of the trace-3. Other images are showing coloured sectors in Red, Green, Blue colour enhancement. The blue line in the
graphic is showing average cutting force value, 115.64 kgf, obtained from 376 test readings)
0 50 100 150 200 250 300 0 50 100 150 200 250 300 350 400 C ut ti ng f orc e (k gf )
Figure 10. Cutting force fluctuation and colour zones, sectors which had been obtained during total time
of trace-5 cutting test of white marble, (The blue line in the graphic is showing average cutting force value, 121.71 kgf, obtained from 401 test readings)
Close observation of cutting traces and rock sample textures directed the focus of this research on micro weaknesses of rock samples. Because, it was understood that rock sample's original weakness
Red codes Green codes Blue codes b c d e Red codes Green codes f g Blue codes
zones had required less power to chip away with respect to hard and crystalline parts of the same samples. These weakness zones may have their own colour differentiation with respect to original rock mass colours. Rock cutting action, in some cases, cleared away hard parts covering these zones. Moreover, due to cutting force applied to rock mass, micro fissures may connect to form larger chips to move away also. Cutting traces have certain clues of drag bit scraping actions and powdered surface traces. These traces may have also chipping away clues due to fissures, weakness zones or cleavages. They left different traces at the back due to cutting action. Micro scale rock weakness zones can be originated due to one of the following facts; micro fissures, cleavages, depositional micro scale layers, micro scale cracks due to primary rock stresses etc. If these micro discontinuities have groundwater in them, their appearances have been changed more quickly due to rock alterations.
Figure 11. Drag bit traces on red tuff surface; 12.7 mm wide drag bit started the cutting from
left side of the specimen
0 10 20 30 40 50 60 70 80 90 0 50 100 150 200 C ut tin g F or ce, F c, ( kgf )
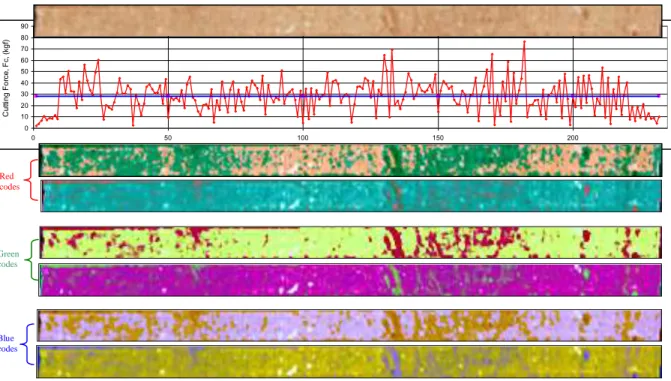
Figure 12. Cutting force fluctuation and colour zones, sectors which had been obtained during total time
of trace-2 cutting test of red tuff sample, (The blue line in the graphic is showing average cutting force value, 27.95 kgf, obtained from 232 test readings)
Red codes Green codes Blue codes tr-5 tr-4 tr-3 tr-2 tr-1
0 10 20 30 40 50 60 70 80 0 50 100 150 200 C ut tin g F or ce, F c, ( kgf )
Figure 13. Cutting force fluctuation and colour zones, sectors which had been obtained during total time
of trace-3 cutting test of red tuff sample, (The blue line in the graphic is showing average cutting force value, 26.63 kgf, obtained from 235 test readings)
Colour differentiation along digitized cutting trace images were evaluated to understand drag bit cutting mechanism by considering push-crack-relax periods together with weakness zones and micro fissures. Detected coloured sectors along the related cutting traces (Fig.9-10 and 12-13) and coinciding zones of cutting force, (Fc), levels are presented here by circular-elliptical marks drawn over the graphs. When the given images in these Figures were checked in detail, the effects of colour enhancements in Red, Green and Blue colour bands can be seen obviously. The features related with drag bit cutting action are become noticeable in those enhanced images. Original photographs, as seen at the top of these figures, are not comprehensible to realize all the aspects of cutting action. However improved images, two boosted images were given for each RGB colour bands, present the drag bit cutting action with more featured way. It was recognized that, coloured sectors which were detected along the cutting traces of the selected tests were representing different mechanical features happened during cutting action. So these sectors and cutting force, (Fc), fluctuations were evaluated to interpret drag bit cutting performance more logically. When the decision was given for which coloured zones were cut with low energy levels which are directly related with lower cutting forces, (Fc), requirement, cutting force fluctuation graph for each rock cutting test was then studied for average, lower and higher cutting force, (Fc), levels. The results obtained from this study were then used to compare the coloured sectors determined along the cutting traces. These comparisons leaded to understand the "easy cutting" or "difficult cutting" levels along the cutting traces. These levels are directly related with energy consumption in drag bit cutting tests performed. If the "difficult cutting" levels are high for a specific cutting tests, energy consumption and drag bit demolishing are expected high also. So if a cutting trace images has coloured zones representing "difficulties" in cutting, that may also used to indicate higher drag bit wear and higher energy consumption for the tested rock sample. Drag bits are used for different excavation machineries. When these machines (excavators, roadheaders, coal cutters etc.) are used to dig an orebody or country rocks, they leave many cutting traces on the rock face at the related workplaces. Taking full image of these traces and analyses with their colour differentiation may result in to understand "easy" or "difficult" in cutting position, levels, in that particular cutting operation.
Blue codes Green codes Red codes
CONCLUSION
Colour analyses have been used in rock colour evaluation and rock identification in earth science applications. Similarly, drag bit cutting traces on rock specimens of rock cutting tests were photographed digitally here and these images were enhanced in red-green-blue colour bands. Differentiated colour sectors along the traces were compared with cutting force, (Fc), fluctuation graphs obtained for related cutting tests. Resemblances were identified for "rock cutting force, (Fc), values" and "colour sectors along rock cutting traces". Coloured sectors in a single cutting trace can then be used to understand if the drag bit cutting consumes more/less energy compared to other cutting traces. This method may also be applied mining or other workplaces where excavators equipped with drag bits are used to trim rock masses. Colours obtained from their bit traces on working faces may also be analysed to understand their energy consumption.
REFERENCES
Akkoyun
, O.,Careddu
, N., Marras, G., 2013, "An Investigation of Colour Properties of Orosei
Limestones (Italy) by Using Computer Program
", Key Engineering Materials, Vol. 548, pp. 173-182.Baykan, N.A., Yılmaz, N., Kansun, G., 2010, "Case Study in Effects of Color Spaces for Mineral Identification", Scientific Research and Essays, Vol. 5 (11), pp. 1243-1253.
Concha-Lozano, N., Lafon, D. Sabiri, N., Gaudon,P., 2013, "Color Thresholds for Aesthetically Compatible Replacement of Stones on Monuments", Color Research & Application, Vol.
38 (5),
pp.
356–363.Dursun, A.E., 2012, Rock Cutting Properties of Limestone Rock Formations Located at NW Site of Konya city, (Konya sehir merkezinin KB’da yer alan kirectaslarinin kesilebilirligi), PhD Thesis, (Dissertation date: Dec.18th 2012) Selcuk University, Graduate School of Natural Science, Mining Engineering Department, Campus, Konya, Turkey, (in Turkish).
Evans, I., 1984, "Basic Mechanics of The Point Attack Pick", Colliery Guardian, May 1984, pp. 189-193. Fonseca, B.M.S., 2012,
Influencia do Nevoeiro Salino na Degradacao de Materiais Ceramicos
Aplicados em Construcoes
, MSc Thesis, Univ. Nova De Lisboa, Faculdade de Ciencias e Tecnologia, 165, Portugal.Gokay, M.K., Uzdemir, Ö., 1999, "Digital Classification of Marble Slap Surface Colours", (Mermer renklerinin sayisal olarak siniflandirilmasi), Journal of Konya Chambers of Industry, Vol. 30, pp.25-27, Konya, Turkey, (in Turkish).
Gokay, M.K., Gundogdu, I.B., 2000, "Colour Analyses and Application of Colour Analyses for Marble Slap Surfaces", (Renk analizi ve mermerlerde renk analizi uygulamalari), Journal of Stone World & Stone and Stone Technologies in Turkey, Vol. 17, pp. 90-96, Izmir, Turkey, (in Turkish).
Gokay, M.K., Gundogdu, I.B., 2001, "Classification of Marble Colour by Using Digital Analyses and Usage of This Method in Marble Cutting and Dimensioning Factories", (Mermer renklerinin sayisal analiz yoluyla siniflandirilmasi ve mermer isleme tesislerindeki kullanilabilirligi), Mining Journal, (Madencilik Dergisi), Mining Engineering Chambers of Turkey, Vol. 40, (2-3-4), pp.3-10, Ankara, Turkey, (in Turkish).
Gokay, M.K., 2003, "Evaluation of Marble Colour Homogeneity", (Mermer renk homojenliginin sayisal degerlendirilmesi), Journal of Stone World & Stone and Stone Technologies in Turkey, Vol. 34, pp.160-173, Izmir, Turkey, (in Turkish).
Gokay, M.K., Dogan, K., 2006, " Identification of Colours for Marble Mass", (Mermerlerde hacimsel renk
dagiliminin arastirilmasi). 5th Marble Symposium of Turkey, (T
ürkiye V. Mermer
Sempozyumu, ed. Ersoy, M.).
Mining Engineering Chambers of Turkey,MERSEM-2006,
2-3 February 2006, pp. 131-140, Afyon, Turkey,
(in Turkish).Gokay, M.K., Gundogdu, I.B., 2007, "Colour Identification of Some Turkish Marbles", Construction and Building Material, Vol. 22, 7, July 2008, pp. 1342-1349.
Gokay, M.K., Dursun A.E., 2013, "Usage of Boom Type Roadheader for Tuffitic Rock Masses in Nevsehir Region in Turkey", (Nevsehir bölgesi tüflerinin kazisinda kollu galeri acma makinelerinin kullanilabilirliginin arastirilmasi), Selcuk University, Journal of Engineering, Science & Technology, SUJEST, Vol. 1 (1), ISSN: 2147-9364 (Electronic), pp. 13-18, (in Turkish).
Gundogdu, I.B., Gokay, M.K., 1999, "Digital Image Analysis of Marble Slap Surface", (Mermerlerin sayisal goruntu analizleri), 10th Engineering Week of Turkey, S.Demirel University, Isparta, Turkey, 20-23 October 1999, (in Turkish).
Gundogdu, I.B., Gokay, M.K., 2003, "Colour Homogeneity of Marble Slap Surface- Digital Analyses of Natural Marble Slap Surface Motifs", (Mermer yüzey rengindeki homojenlik, mermer desenlerinin sayisal incelenmesi), 4th Marble Symposium of Turkey, (T
ürkiye IV. Mermer
Sempozyumu).
Mining Engineering Chambers of Turkey,MERSEM-2003, Afyon,
Turkey, pp.231-242, 18-19 December 2003,
(in Turkish).Hunter, R.S., 1948, "Photoelectric Color-difference Meter", JOSA, V38, N7, 661.
(Proceedings of the Winter Meeting of the Optical Society of America).Joblove, G. H., Greenberg, D., 1978, "
Color Spaces for Computer Graphics", Computer Graphics
, Vol.12 (3), pp. 20–25, Doi
:10.1145/965139.807362
.Merchant, M. E., 1945, "Basic Mechanics of Metal Cutting Process", Journal of Applied Mechanics, Vol. 11, A-168.
McFeat-Smith, I., Fowell R.J., 1977, "Correlation of Rock Properties and the Cutting Performance of Tunnelling Machines", Proceedings of a Conference on Rock Engineering, CORE-UK, Conference organized jointly by the British Geotechnical Society and Deparment of Mining Engineering, The University of Newcastle upon Tyne, UK, pp. 581-602.
Pascua, N.G., Sanchez de Rojas, M.I., Frias, M., 1999, "
Measurement of Colour in Different Construction Materials. The restoration in sandstone buildings", Materiales de Construccion, Vol. 49, 253, Doi:10.3989/mc.1999.v49.i253.455Poynton, C.A., 2003, Digital Video and HDTV: Algorithms and Interfaces, Morgan Kaufmann, USA,
ISBN
1-55860-792-7
Roxborough, F.F., 1973, "Cutting Rock with Picks", The Mining Engineer, Jun1973, pp. 445-452.
Sousa, L., Goncalves, B., 2013, "Differences in the Quality of Polishing Between Sound and Weathered Granites", Environmental Earth Sciences, Vol. 69 (4), pp. 1347-1359.