A NOVEL APPROACH TO HEART ATTACK PREDICTION IMPROVEMENT VIA EXTREME LEARNING MACHINES CLASSIFIER INTEGRATED WITH DATA RESAMPLING STRATEGY
Ahmet SAYGILI
Tekirdağ Namık Kemal University, Computer Engineering Department, Tekirdağ, TURKEY
(Geliş/Received: 18.06.2019; Kabul/Accepted in Revised Form: 22.07.2020)
ABSTRACT: The heart attack is a disorder that is frequently seen in low-income countries and causes the death of many people. Cardiologists benefit from electrocardiography (ECG) tests to determine this condition. Supervised classification algorithms are frequently used and provide very successful results in computer-aided diagnostic systems. In this study, a new approach to predict a heart attack is proposed for classification via extreme learning machines (ELM) integrated with the resampling strategy. This study aims to reveal a new diagnostic system that will increase the success of current studies. The study has three basic steps. In order to determine the features that will ensure the system’s optimized operation, firstly, the ReliefF feature selection method was applied to the data set, and then, the system was modeled by different classifiers via resampling. Besides, the as-proposed approach was applied to the breast cancer data to test the accuracy of the current system. The as-obtained results from both Statlog (heart disease) and the breast cancer data were seemed to be more successful than the studies in the literature. Thus, the as-proposed system reveals a successful and effective approach that can be applied in clinical data sets. Keywords: Data resampling, heart attack prediction, feature selection methods, Statlog data set
VERİ YENİDEN ÖRNEKLEME STRATEJİSİ İLE BÜTÜNLEŞTİRİLMİŞ AŞIRI ÖĞRENME MAKİNELERİ SINIFLAYICILARI İLE KALP KRİZİ TAHMİNLERİNİN İYİLEŞTİRİLMESİ İÇİN
YENİ BİR YAKLAŞIM
ÖZ: Kalp krizi düşük gelirli ülkelerde sık görülen ve birçok insanın ölümüne neden olan bir hastalıktır. Kardiyologlar bu durumu belirlemek için elektrokardiyografi (EKG) testlerinden yararlanırlar. Denetimli sınıflandırma algoritmaları, bilgisayar destekli tanılama sistemlerinde sıklıkla kullanılır ve çok başarılı sonuçlar verir. Bu çalışmada, kalp krizini öngörmede yeniden örnekleme stratejisiyle bütünleşmiş aşırı öğrenme makineleri (ELM) ile yapılan sınıflandırma için yeni bir yaklaşım önerilmiştir. Bu çalışmanın amacı, güncel çalışmaların başarısını artıracak yeni bir tanı sistemi ortaya koymaktır. Çalışmanın üç temel adımı vardır. İlk aşamada, ReliefF özellik seçim yöntemi veri setine uygulanır ve sistemin en iyi şekilde çalışmasını sağlayacak özellikler belirlenir. Daha sonra sistem yeniden örnekleme ile farklı sınıflandırıcılarla modellenmiştir. Ek olarak, önerilen yaklaşım meme kanseri verilerine uygulanmış ve mevcut sistemin doğruluğu test edilmiştir. Hem Statlog (kalp krizi) hem de meme kanseri verilerinin sonuçları literatürdeki çalışmalardan daha başarılı sonuçlar vermiştir. Böylece, önerilen sistem, klinik veri setlerinde uygulanabilecek başarılı ve etkili bir yaklaşım ortaya koymaktadır.
1. INTRODUCTION
Cardiovascular Disease (CVD) is the #1 cause of death worldwide. In 2016, 17.9 million people died of CVDs (Organization, 2017). Heart attacks and strokes are the main causes of 85% of these deaths. More than three-quarters of CVD deaths occur in low- and middle-income countries (Organization, 2017).
The computerized systems started to be used along with clinical methods to achieve better results in health services. Therefore, data such as patient information, medical diagnosis, and medical images were recorded (Spekowius et al., 2006). Then, the decision support systems were created by machine learning methods that process these data. In computer-aided diagnosis, such large data sets are analyzed and relevant studies are carried out to support medical professionals in their decisions. Numerous studies have been conducted, especially in the detection of both heart diseases (Buscema et al., 2013; R. Das et al., 2009; Dewan et al., 2015; Duch et al., 2001; Helmy et al., 2009; Kahramanli et al., 2008; Karabulut et al., 2012; Xiao Liu et al., 2017; Long et al., 2015; Nahar et al., 2013; Özşen et al., 2008; Polat et al., 2009; Subbulakshmi et al., 2012; Şahan et al., 2005; Takci, 2018; S.-j. Wang et al., 2009; Yilmaz et al., 2014) and breast cancer (Karabatak, 2015; Karabatak et al., 2009; Xiaoming Liu et al., 2015; Saygılı, 2018; P. Wang et al., 2016).
The Statlog data set was used in this study. There are many studies performed with the Statlog (Heart Disease) data set obtained from the UCI Machine Learning Community ("
UCI Machine Learning Repository, Statlog (Heart) Data Set "), i.e. Duch et al. used the k-Nearest Neighbor (k-NN) method integrated with the Euclid and Manhattan distances, feature space mapping, and separable split value algorithms in their study on the Statlog data set. The highest success rate obtained from this study was 85.6% (Duch et al., 2001). Şahan et al. aimed to increase the classification success by eliminating the features that have a negative impact on the data set by using the Attribute Weighted Artificial Immune System (AWAIS) method in 2005. They have achieved an accuracy rate of 82.59% in their study (Şahan et al., 2005). Özşen and Güneş used the Euclidean and Manhattan distances and hybrid similarity measures in their study to classify the Statlog data set. They achieved 83.95% success rate (Özşen et al., 2008). Kahramanlı and Allahverdi created a hybrid neural network by using both the Artificial Neural Networks (ANN) and the Fuzzy Neural Networks together, and obtained 86.8% accuracy value in their study (Kahramanli et al., 2008). Polat and Güneş proposed a method called the f-Score Feature Selection (KFFS), in their study. The highest accuracy rate on Statlog data sets they obtained, by combining the KFFS and Support Vector Machines (SVM) classifier, was 83.70% (Polat et al., 2009). In 2009, Helmy and Rasheed classified five different data sets with four different classification methods. As a result of this study, the highest success rate they achieved for a Statlog data set was determined as 85.24% by using Extreme Learning Machines (ELM) method (Helmy et al., 2009). Wang et al. reported that there was no comprehensive empirical research in SVM that is compared with an ANN or Decision Tree. For this reason, they analyzed the SVM method with four different grouping techniques, i.e. Bagging, AdaBoost, Arc-X4, and Modified AdaBoost. They used 20 real-world data sets from the UCI repository, and they achieved a success rate of 83.48% in the training samples, and 83.37% of the test samples for the Statlog data set (S.-j. Wang et al., 2009).
Subbulakshmi et al. presented an effective algorithm via ELM on the Statlog data set (Subbulakshmi et al., 2012). Buscema et al. achieved a success rate of 84.14% by using the TWIST algorithm in their study in 2013, in which ELM was used for classification purposes (Buscema et al., 2013). Karabulut and İbrikçi have established a decision support system with a 91.20% success rate to help with the coronary artery disease decisions (Karabulut et al., 2012). Yilmaz et al. used the Modified k-Means Algorithm on a cluster-based data preparation system to eliminate both the noisy and inconsistent data. The classification process was carried out by using SVM on three different data sets obtained from the UCI database. Here, the classification success rate they achieved for the Statlog data set was 97.87% (Yilmaz et al., 2014). Liu et al. tried to identify heart diseases by using hybrid classification methods. The success rate of their study was 92.59% (Xiao Liu et al., 2017). Takci has achieved 84.81% success rate in his study by using the SVM method with many feature extraction methods and classifiers. In this study, it was stated that it would be beneficial to conduct the classification by using different feature extraction methods (Takci, 2018).
In current study, mainly a three-stage algorithm, during which; (i) the best features were firstly selected via different feature extraction methods, and then (ii) the resampling strategy was used, and finally (iii) the as-obtained samples were modeled by using both ELM and other classifiers that are commonly used in the literature to develop a computer-based diagnostic system to increase the overall classification success rate of heart attack disease. It has been observed that both the feature selection and the resampling strategy contributed to the performance improvement. Also, the proposed method for the Statlog Heart Attack data set was applied in the Wisconsin Diagnostic Breast Cancer (WDBC) data set to confirm the success of the system in our study.
The second part of our study includes materials and methods, experimental studies in the third chapter, discussion, and conclusions in the fourth chapter. The fifth and last section contains the results. 2. MATERIALS AND METHODS
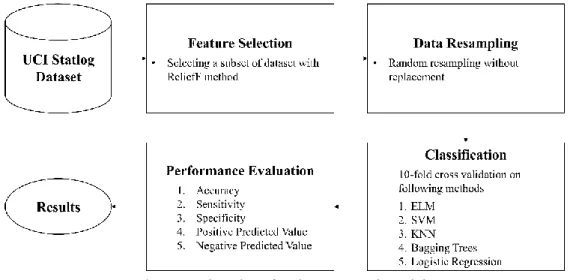
The machine-learning methods have been frequently used in computer-aided diagnostic systems in recent years. In our study, many and different machine learning methods were used. Here, the carried-out work consists of three steps, i.e. the feature selection, data resampling, and classification. The flow chart of these steps is shown in Figure 1. As shown in Figure 1, these steps were applied to heart attack data. The same method was also applied to the WDBC data set to evaluate the success of the proposed method. The results obtained for both data sets will be given under the title of experimental studies.
Figure 1. Flowchart for the proposed model
The ELM, SVM, k-NN, Linear Regression, Bagging Trees algorithms were used for the classification while the features were selected by a ReliefF feature selection method with random resampling without replacement strategy. The WEKA tool was used for feature selection. The success obtained by different feature selection methods in WEKA was examined and the ReliefF method was chosen because of them being the most successful method. The WEKA does not have an ELM classifier. For this reason, four other methods (SVM, k-NN, Linear Regression, Bagging Trees algorithms) were used to determine the feature selection method. The classification process was performed in the MATLAB environment. In the classification stage, five different classification methods were used as mentioned above. Four of these methods are frequently used in other studies. ELM method has been successful in many studies conducted in different fields in recent years. Based on these successful results, the ELM method was also included in the classifiers used in our study. The five different performance metrics were used for performance measurement of the classification process: accuracy, sensitivity, specificity, Positive Predicted Value (PPV), and Negative Predicted Value (NPV) shown in Figure1. The details of this three-step process that we applied in the ongoing titles will be given.
2.1. Feature Selection
Today, the amount of data used for data mining and machine learning has increased considerably in all areas. This increase led scientists to discover information from data. Such information obtained from large data sets is beneficial in many different areas. However, the increase in data has also increased the amount of noisy and complex data, as well. This large increase in data is also thought to trigger the inefficiency in both memory and time. On the other hand, it is foreseen that all the data in the data sets cannot provide meaningful information. Therefore, feature selection is required to remove unrelated input properties (Guyon et al., 2003). Feature selection not only reduces the computational complexity but also improves learning accuracy and intelligibility of outputs (Freeman et al., 2015). Achieving successful results is closely related to the selection of both right features and the use of right methods. There is a large amount of data, especially in the field of medicine. In this process, machine-learning methods are frequently used in recent years.
Feature selection methods can be classified as the wrapper-based and the filter-based methods (S. Das, 2001). The wrapper-based methods measure the usefulness of classifier-based features. In contrast, the filter-based methods select features that are measured by univariate statistics rather than the cross-validation performance, i.e. the appropriateness of features. Therefore, the wrapper-based methods mainly solve the real problem, but they are also more expensive compared to the filter-based methods, in terms of calculation.
The ReliefF method used in this study is one of the most widely used and effective algorithms among the filter-based feature selection methods. This method provides a very simple, but effective procedure for estimating the quality of properties in problems with dependencies between features (Robnik-Šikonja et al., 2003). ReliefF selects a random instance xj, then searches for two nearest neighbors: one from the
same class, called nearest hit H, and the other from the other class, called nearest miss M. Weights (W[k]) for each feature (k) are updated depending on their values for xj , M and H; and then, the weight assigned
to every feature is a (each training instance) real value in the range [−1; 1]. The pseudocode of this method is as shown in Figure 2.
ReliefF Algorithm
Input: for each training instance a vector of attribute values and the class value Output: the vector W of estimations of the qualities of attributes
set all weights W[k]=0.0; for j=1 to n do begin
select an instance randomly xj
find nearest hit H and nearest miss M for k=1 to a do
W[k]= W[k]- diff(k, xj, H)/n+diff(k, xj, M)/n
End
Figure 2. The pseudocode for the ReliefF algorithm (Chen et al., 2009)
Here, the diff (k, I1, I2,) function calculates the difference between the k attribute values of the I1 and I2
samples. For numerical attributes, it is defined as:
𝑑𝑖𝑓𝑓(𝐴, 𝐼1, 𝐼2) = |𝑣𝑎𝑙𝑢𝑒(𝐴, 𝐼1− 𝑣𝑎𝑙𝑢𝑒 (𝐴, 𝐼2)| 𝑚𝑎𝑥(𝐴) − 𝑚𝑖𝑛(𝐴)
This function is also used in the distance between the samples to find the nearest neighbors. In this process, it can be assumed that the total distance is the sum of the distances above all features (Manhattan distance). The idea behind the Relieff algorithm process can be intuitively explained as follows. On the one hand, different values of the k property between xj and M mean that this k features tends to separate
two instances with different class labels; in this case, the feature has a desired discriminatory effect, thereby increasing the quality estimate W [k]. On the other hand, if k shows different values for xj and H,
W [k] will decrease because the k attribute tends to lead to separate samples from the same class. The entire
process is repeated n times, where n can be defined by the user. At the end of the iterative process, the W vector will take on a structure that represents the ability of the features to separate instances of different classes and keep instances of the same class close together (Chen et al., 2009).
2.2. Data Resampling
Resampling is a set of methods used to reconfigure sample data sets, including both the training sets and the validation sets. It can provide different sets of samples that are more useful for the learning process. The real-world data sets can have a non-uniform class distribution, as in the Statlog data set, which can significantly affect a classifier's performance during the training phase.
In random resampling, there are two approaches, namely with/out replacement, to random selection. The difference between these two approaches is about the sampling strategy’s replacement when a sample can be selected more than once (Mitra et al., 1984). In random resampling without replacement, each sample in the data set has the chance to be selected equally, i.e. the selected sample cannot be reselected. However, in random resampling with replacement, it is possible to repeatedly select each sample with an equal chance of selection.
2.3. Classification
In this study, the ELM method was used in the classification stage and its success was compared with SVM, k-NN, linear regression, bagging trees algorithms. The relevant results will be given under the title of experimental studies. At this stage, the ELM method, which is frequently preferred in recent years, will be briefly explained.
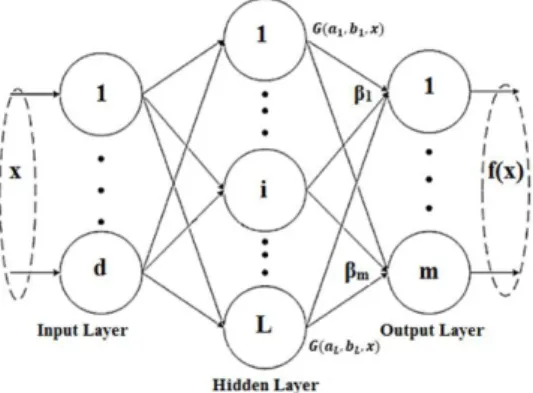
A feed-forward neural network is an artificial neural network (ANN), in which, the process moves only in the forward direction from the input nodes to the output nodes. The single-layer feed-forward neural network (SLFNs) is one of the simplest kinds of neural networks, which consists of a single layer of output nodes (the inputs are fed directly to the outputs via series of weights). As for the ELM, which is also an SLFNs model, the input weights are randomly determined, while the output weights are determined analytically(G.-B. Huang et al., 2004, 2006). The method’s process steps are shown in Figure 3.
Figure 3. The ELM Network Scheme The output function of ELM is
fL(x) = ∑L βihi(x) = h(x)β
i=1 (1)
where β = [β1, … , βL]T is the vector of the output weights between the hidden layer of L nodes and
the output node, and h(x) is the output vector of the hidden layer h(x) = [G(a1, b1, x), … , G(aL, bL, x)] where
G(a,b,x) is a nonlinear piecewise continuous function. In this study, the sigmoid activation function was selected due to its widespread use in the literature.
where x is an input sample, a is the weight, and b is the bias value from the input layers to the hidden layers. {a, b} pair is randomly generated. The ELM minimizes the training error as well as the output weights’ norms(G.-B. Huang et al., 2004, 2006). Minimize:‖Hβ − T‖2 and ‖β‖ where H is the hidden-layer output matrix; H = [ h1(x1) ⋯ hL(x1) ⋮ ⋱ ⋮ h1(xN) ⋯ hL(xN) ] (3)
Here, instead of the standard optimization method, the minimal norm least square method was used in the original implementation of the ELM (G. B. Huang et al., 2012).
β = H†T, (4)
where T is the label matrix, and H† is the Moore-Penrose generalized inverse of the hidden layer output matrix H= [hT(x1),…, hT(xN)]T for N training samples. One of the methods to calculate Moore-Penrose generalized inverse of a matrix is the orthogonal projection method: H†= (HTH)−1HT. One can
add a regularization value C to the diagonal of HTH. The solution tends to have better generalization performance as follows (G. B. Huang et al., 2012);
fL(x) = h(x) (I
C+ H
TH)−1HTT (5)
3. EXPERIMENTAL STUDIES
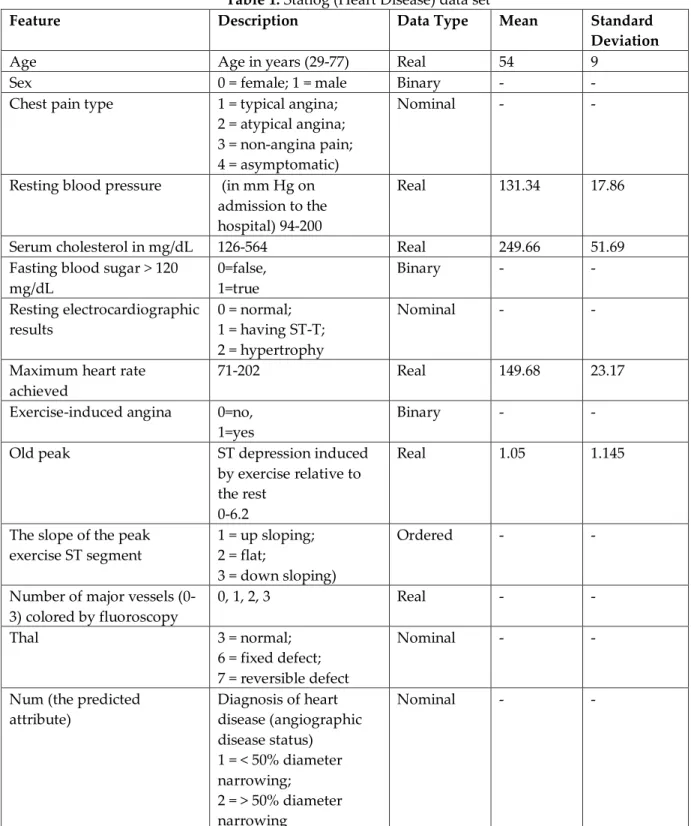
UCI Statlog (Heart disease) data were used in our study. The data set consists of 270 different samples, 13 different features, and 1 class label is shown in Table 1. 13 different features in the data are selected from 76 different features.
Table 1. Statlog (Heart Disease) data set
Feature Description Data Type Mean Standard
Deviation
Age Age in years (29-77) Real 54 9
Sex 0 = female; 1 = male Binary - -
Chest pain type 1 = typical angina; 2 = atypical angina; 3 = non-angina pain; 4 = asymptomatic)
Nominal - -
Resting blood pressure (in mm Hg on admission to the hospital) 94-200
Real 131.34 17.86
Serum cholesterol in mg/dL 126-564 Real 249.66 51.69
Fasting blood sugar > 120 mg/dL 0=false, 1=true Binary - - Resting electrocardiographic results 0 = normal; 1 = having ST-T; 2 = hypertrophy Nominal - -
Maximum heart rate achieved
71-202 Real 149.68 23.17
Exercise-induced angina 0=no, 1=yes
Binary - -
Old peak ST depression induced
by exercise relative to the rest
0-6.2
Real 1.05 1.145
The slope of the peak exercise ST segment
1 = up sloping; 2 = flat;
3 = down sloping)
Ordered - -
Number of major vessels (0-3) colored by fluoroscopy 0, 1, 2, 3 Real - - Thal 3 = normal; 6 = fixed defect; 7 = reversible defect Nominal - -
Num (the predicted attribute) Diagnosis of heart disease (angiographic disease status) 1 = < 50% diameter narrowing; 2 = > 50% diameter narrowing Nominal - -
Our study consists of three stages: feature selection, data resampling, and classification. The ReliefF method is used in feature selection. The WEKA tool was used for feature selection. The WEKA does not have an ELM classifier. For this reason, four other methods (SVM, k-NN, linear regression, bagging trees algorithms) were used to determine the feature selection method. The classification achievements obtained by different feature selection methods in WEKA were examined and the ReliefF method was chosen as the most successful method. Following the application of ReliefF feature selection method, features “Age”, “Sex”, “Chest pain type”, “Resting blood pressure”, “Old peak”, “The slope of the peak exercise ST-segment”, “Number of major vessels (0-3) colored by fluoroscopy”, “Thal” were selected.
The other data set used in this study is the Wisconsin Diagnostic Breast Cancer data set consisting of 569 samples and 32 features in the UCI Machine Learning store. Some of the features included in the data set are; radius, texture, perimeter, smoothness, concavity, concave points, etc. 212 were malignant (Malignant) and 357 were benign (Benign) of the 569 breast cancer data in the data set. One of the features is a class tag and one is an ID variable. First, the ID feature within 32 features has been manually removed. Because ID is just a sequence number used to show examples. Then, The ReliefF method was also applied to the breast cancer data set. Following the application of ReliefF feature selection method to the breast cancer data, features, “symmetry worst”, “concave points se”, “smoothness mean”, “texture se”, “fractal dimension worst”, “compactness se”, “symmetry mean”, “fractal dimension se”, “concavity se” were removed. Thus, 22 features were selected by the ReliefF feature selection method. After the feature selection, the resampling method described in the previous section is applied to the data set. In our study, random resampling without replacement method was preferred. This method is chosen because each sample has an equal number of chances.
The classification process was performed in the MATLAB program. In the classification stage, five different classification methods are used. Four of these five different methods are frequently used in many studies. However, the ELM method has gained popularity in recent years. ELM method has been successful in many studies conducted in different fields. Based on these successful results, the ELM method was also included in the classifiers used in our study. As expected, the most successful results were obtained by the ELM method. Therefore, it is thought that it will be beneficial to provide technical details of this method. With this in mind, in Chapter 2, instead of giving technical details of all classifiers, only the technical details of the ELM method are given. Instead of the technical details of other classical classifiers, only the parameters used for that method are given (Table 2).
As shown in Figure 1, five different performance metrics were used for performance measurement of the classification process: accuracy, sensitivity, specificity, Positive Predicted Value (PPV) and Negative Predicted Value (NPV). The formulas of these metrics are shown below. In the formulas, TP shows True positive, TN true negative, FP false positive, and FN false negative.
Accuracy = TP+TN (TP+TN+FP+FN)
(6)
Sensitivity = TP (TP+FN)
(7) Specificity = TN (TN+FP)
(8) PPV = TP (TP+FP)
(9) NPV = TN (TN+FN)
(10)
The parameters of the methods used in the classification stage are shown in Table 2. The parameters of the classification methods were determined experimentally. For example, for the ELM method, the number of hidden layers is tested with 256, 512, 1024, 2048, and 4096 values and the most suitable hidden layer number is determined to be 1024. Similarly, in the k-NN method, the number of k is tested with 1, 3, 5, 7, 9 values and the distance metric is tested with Euclidean and Manhattan. The most suitable distance metric was found to be Euclidean while the most suitable k number was 1.
Table 2. Parameters of the classification methods
ELM Activation Function: Sigmoid
Hidden Nodes: 1024
SVM Kernel Function: Gaussian
Kernel Scale: 0.61
k-NN Number of Neighbors: 1
Distance Metric: Euclidean
Bagging Trees
Ensemble Method: Bag
Learner Type: Decision Tree Number of Learners: 30
Logistic Regression Default parameters
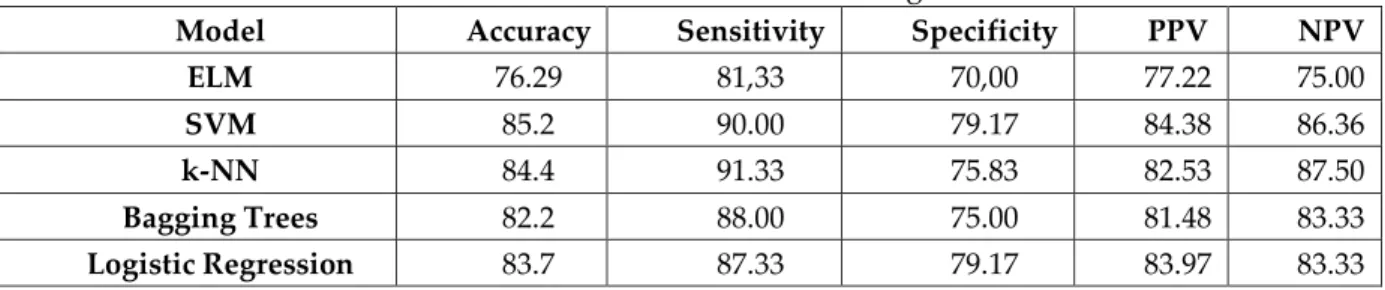
Firstly, the classification process was carried out on the raw data set. Table 3 shows the results obtained after applying the classification process to the raw data set without feature selection and resampling operation. The highest accuracy rate obtained after grading the raw data set was 85.2% with the SVM method. When Table 3 is examined, it is seen that sensitivity values are higher than other metrics. For example, the highest accuracy rate was obtained as 85.2% with the SVM method and the sensitivity value of the same method was 90%. Sensitivity means "the percentage of sick people who are correctly identified". Therefore, it can be said that the model proposed in our study comes to the fore in labeling the patients as patients.
Table 3. Success rates of the raw Statlog data set
Model Accuracy Sensitivity Specificity PPV NPV
ELM 76.29 81,33 70,00 77.22 75.00
SVM 85.2 90.00 79.17 84.38 86.36
k-NN 84.4 91.33 75.83 82.53 87.50
Bagging Trees 82.2 88.00 75.00 81.48 83.33
Logistic Regression 83.7 87.33 79.17 83.97 83.33
After obtaining the results with the raw data set, the feature selection was made by the ReliefF method. Then the classification process was performed. Table 4 shows the results obtained after this process. It is observed that the feature selection which is seen in Table 4 increases the success of the system. The highest classification rate was 87.41% by the ELM method.
Table 4. Success rates after feature selection
Model Accuracy Sensitivity Specificity PPV NPV
ELM 87.41 85.33 90.00 91.43 83.08
SVM 85.9 91.33 79.17 84.57 87.96
k-NN 84.4 93.33 73.33 81.40 89.80
Bagging Trees 82.2 86.00 77.50 82.69 81.58
Logistic Regression 84.8 88.67 80.00 84.71 84.96
In the last experiment, firstly, feature selection, then resampling process was applied to the data set. As can be seen from Table 5, resample operation significantly increased classification success. In the
previous experiment, the highest success was 87% and now it was 98.89%. Table 5 shows the results obtained according to different metrics.
Table 5. Success rates after feature selection and resampling
Model Accuracy Sensitivity Specificity PPV NPV
ELM 98.89 100 97.27 98.16 100
SVM 89.3 87.33 91.67 81.76 85.27
k-NN 91.9 96.00 86.67 96.00 94.55
Bagging Trees 91.1 91.33 90.83 95.14 89.34
Logistic Regression 81.9 86.67 75.83 81.76 81.98
When Table 5 is examined, we see that the sensitivity value is 100% for the ELM method, which gives the highest accuracy. This means that all patients with heart disease are correctly diagnosed. The specificity value of the ELM method is 97.27%. It is seen that the specificity value which shows the correct diagnosis rate in patients without heart disease is relatively lower than the sensitivity value. It can be said from this that the rate of accurate diagnosis of those with heart disease is higher than the rate of accurate diagnosis of those without heart disease.
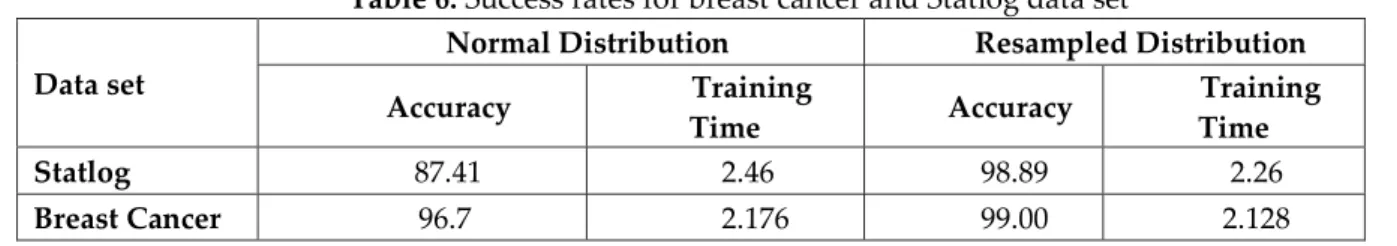
To understand the success of the model we applied, we also trained the breast cancer data set with the same model. And the results are given in Table 6 which shows the accuracy rates of data sets with normal distribution and resampled distribution. Resampling seems to increase success in both breast cancer and the Statlog data set.
Table 6. Success rates for breast cancer and Statlog data set Data set
Normal Distribution Resampled Distribution Accuracy Training Time Accuracy Training Time Statlog 87.41 2.46 98.89 2.26 Breast Cancer 96.7 2.176 99.00 2.128
4. RESULT AND DISCUSSIONS
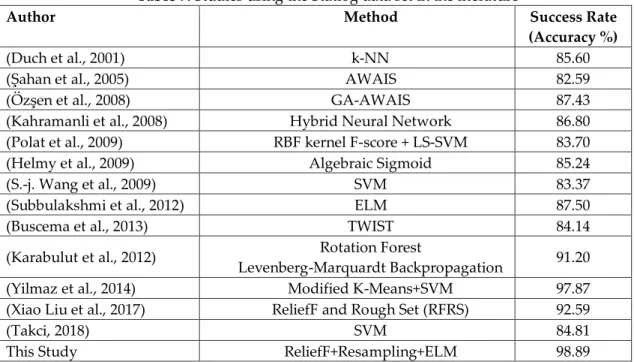
Several studies have been performed using the Statlog data set. The first of these studies was used in the same data set was published in 2001. The success of this study by Duch et al. was 85.6% (Duch et al., 2001). Many more studies were conducted in the following years. These studies are shown in Table 7. When the studies in the literature are examined, it is possible to see that the usual classification methods such as SVM and k-NN are used and successful results are obtained.
Table 7. Studies using the Statlog data set in the literature
Author Method Success Rate
(Accuracy %)
(Duch et al., 2001) k-NN 85.60
(Şahan et al., 2005) AWAIS 82.59
(Özşen et al., 2008) GA-AWAIS 87.43
(Kahramanli et al., 2008) Hybrid Neural Network 86.80
(Polat et al., 2009) RBF kernel F-score + LS-SVM 83.70
(Helmy et al., 2009) Algebraic Sigmoid 85.24
(S.-j. Wang et al., 2009) SVM 83.37
(Subbulakshmi et al., 2012) ELM 87.50
(Buscema et al., 2013) TWIST 84.14
(Karabulut et al., 2012) Rotation Forest
Levenberg-Marquardt Backpropagation 91.20
(Yilmaz et al., 2014) Modified K-Means+SVM 97.87
(Xiao Liu et al., 2017) ReliefF and Rough Set (RFRS) 92.59
(Takci, 2018) SVM 84.81
This Study ReliefF+Resampling+ELM 98.89
As can be seen from Table 7, the most successful result before our study belongs to the study carried out by Yılmaz et al. (Yilmaz et al., 2014). With our model, this success has been slightly improved and has been 98.89%. Determining the most successful one among the different feature selections and resampling the data on it has led to an increase in success.
Figure 4. The success rates, according to the feature selection and resampling operations In order to see the effect of both feature selection and the resampling methods on the success, a column graph seen in Figure 4 was formed. As can be seen from the graph, the feature selection and the resampling increased the success in almost all methods. Only logistic regression procedures did not contribute positively to the results. It can be seen that especially the operations in ELM, k-NN, and Bagging Tree methods increased the success.
0 10 20 30 40 50 60 70 80 90 100
ELM SVM KNN Bagging Trees Logistic
Regression Ac cu rac y Classification Method
5. CONCLUSIONS
The medical industry includes a large unprocessed data set. The processing of this data and the discovery of information from the data allow for early diagnosis and treatment of many diseases. Machine learning techniques can be used in the diagnostic systems in the analysis of raw data. A heart attack is one of the main causes of death. Therefore, early diagnosis of these diseases is of vital importance.
In this study, various machine learning methods were applied to predict a heart attack. The achievements of these methods were applied to the Statlog heart attack data set. It was also applied to the Breast cancer data set and it was questioned whether the system was successful or not. The results obtained were compared with the other studies in the literature and it was shown that the current applied system yielded more successful results. In particular, the success of resampling in data sets with an unbalanced distribution has been demonstrated in this study. The success of ELM in resampled data is also shown in Tables 5 and 6. As in other studies in this field, two of the most successful methods have been k-NN and bagging methods. In the data sets with regular distribution, the increase in the success of both methods is noteworthy. The biggest deficiency of our study is that the data sets used are not large enough. In future studies, we aim to test the existing methods by creating larger data sets.
We have various predictions to carry our work to a more advanced level. In particular, the system used in this study can be implemented in large-scale real-world data sets and the scope can be extended. A variety of procedures can be applied to the application of different techniques in the prediction of a heart attack. Also, it is predicted that the success of the system can be increased by using different methods or hybrid methods.
6. REFERENCES
Buscema, M., Breda, M., & Lodwick, W., 2013, Training With Input Selection and Testing (TWIST) algorithm: a significant advance in pattern recognition performance of machine learning, Journal
of Intelligent Learning Systems and Applications, 5(1), 29.
Chen, J. Y., & Lonardi, S. 2009, Biological data mining: CRC Press.
Das, R., Turkoglu, I., & Sengur, A., 2009, Effective diagnosis of heart disease through neural networks ensembles, Expert Systems with Applications, 36(4), 7675-7680.
Das, S., 2001, Filters, wrappers and a boosting-based hybrid for feature selection, Paper presented at the Icml. Dewan, A., & Sharma, M., 2015, Prediction of heart disease using a hybrid technique in data mining classification,
Paper presented at the Computing for Sustainable Global Development (INDIACom), 2015 2nd International Conference on.
Duch, W., Adamczak, R., & Grabczewski, K., 2001, A new methodology of extraction, optimization and application of crisp and fuzzy logical rules, IEEE Transactions on Neural Networks, 12(2), 277-306. Freeman, C., Kulić, D., & Basir, O., 2015, An evaluation of classifier-specific filter measure performance
for feature selection, Pattern Recognition, 48(5), 1812-1826.
Guyon, I., & Elisseeff, A., 2003, An introduction to variable and feature selection, Journal of machine learning
research, 3(Mar), 1157-1182.
Helmy, T., & Rasheed, Z., 2009, Multi-category bioinformatics dataset classification using extreme learning
machine, Paper presented at the Evolutionary Computation, 2009. CEC'09. IEEE Congress on.
Huang, G.-B., Zhu, Q.-Y., & Siew, C.-K., 2004, Extreme learning machine: a new learning scheme of feedforward neural networks, Neural Networks, 2004., 2, 985-990.
Huang, G.-B., Zhu, Q.-Y., & Siew, C.-K., 2006, Extreme learning machine: theory and applications,
Neurocomputing, 70(1-3), 489-501.
Huang, G. B., Zhou, H., Ding, X., & Zhang, R., 2012, Extreme Learning Machine for Regression and Multiclass Classification, IEEE Transactions on Systems, Man, and Cybernetics, Part B (Cybernetics),
42(2), 513-529. doi:10.1109/TSMCB.2011.2168604
Kahramanli, H., & Allahverdi, N., 2008, Design of a hybrid system for the diabetes and heart diseases,
Karabatak, M., 2015, A new classifier for breast cancer detection based on Naïve Bayesian, Measurement,
72, 32-36.
Karabatak, M., & Ince, M. C., 2009, An expert system for detection of breast cancer based on association rules and neural network, Expert Systems with Applications, 36(2), 3465-3469.
Karabulut, E. M., & İbrikçi, T., 2012, Effective diagnosis of coronary artery disease using the rotation forest ensemble method, Journal of medical systems, 36(5), 3011-3018.
Liu, X., Wang, X., Su, Q., Zhang, M., Zhu, Y., Wang, Q., & Wang, Q., 2017, A hybrid classification system for heart disease diagnosis based on the rfrs method, Computational and mathematical methods in
medicine, 2017.
Liu, X., & Zeng, Z., 2015, A new automatic mass detection method for breast cancer with false positive reduction, Neurocomputing, 152, 388-402.
Long, N. C., Meesad, P., & Unger, H., 2015, A highly accurate firefly based algorithm for heart disease prediction, Expert Systems with Applications, 42(21), 8221-8231.
Mitra, S., & Pathak, P., 1984, The nature of simple random sampling, The Annals of Statistics, 1536-1542. Nahar, J., Imam, T., Tickle, K. S., & Chen, Y.-P. P., 2013, Computational intelligence for heart disease
diagnosis: A medical knowledge driven approach, Expert Systems with Applications, 40(1), 96-104. Organization, W. H. 2017, Cardiovascular diseases (CVDs), Retrieved from
https://www.who.int/cardiovascular_diseases/en/
Özşen, S., & Güneş, S., 2008, Effect of feature-type in selecting distance measure for an artificial immune system as a pattern recognizer, Digital Signal Processing, 18(4), 635-645. doi:https://doi.org/10.1016/j.dsp.2007.08.004
Polat, K., & Güneş, S., 2009, A new feature selection method on classification of medical datasets: Kernel F-score feature selection, Expert Systems with Applications, 36(7), 10367-10373. doi:https://doi.org/10.1016/j.eswa.2009.01.041
Robnik-Šikonja, M., & Kononenko, I., 2003, Theoretical and empirical analysis of ReliefF and RReliefF,
Machine learning, 53(1-2), 23-69.
Saygılı, A., 2018, Classification and Diagnostic Prediction of Breast Cancers via Different Classifiers,
International Scientific and Vocational Studies Journal, 2(2), 48-56.
Spekowius, G., & Wendler, T. 2006, Advances in healthcare technology: shaping the future of medical care (Vol. 6): Springer Science & Business Media.
Subbulakshmi, C., Deepa, S., & Malathi, N., 2012, Extreme learning machine for two category data classification, Paper presented at the Advanced Communication Control and Computing Technologies (ICACCCT), 2012 IEEE International Conference on.
Şahan, S., Polat, K., Kodaz, H., & Güneş, S., 2005, The medical applications of attribute weighted artificial
immune system (AWAIS): diagnosis of heart and diabetes diseases, Paper presented at the International
Conference on Artificial Immune Systems.
Takci, H., 2018, Improvement of heart attack prediction by the feature selection methods, Turkish Journal
of Electrical Engineering & Computer Sciences, 26(1), 1-10.
UCI Machine Learning Repository, Statlog (Heart) Data Set Retrieved from http://archive.ics.uci.edu/ml/datasets/Statlog+%28Heart%29
Wang, P., Hu, X., Li, Y., Liu, Q., & Zhu, X., 2016, Automatic cell nuclei segmentation and classification of breast cancer histopathology images, Signal Processing, 122, 1-13.
Wang, S.-j., Mathew, A., Chen, Y., Xi, L.-f., Ma, L., & Lee, J., 2009, Empirical analysis of support vector machine ensemble classifiers, Expert Systems with Applications, 36(3, Part 2), 6466-6476. doi:https://doi.org/10.1016/j.eswa.2008.07.041
Yilmaz, N., Inan, O., & Uzer, M. S., 2014, A new data preparation method based on clustering algorithms for diagnosis systems of heart and diabetes diseases, Journal of medical systems, 38(5), 48.