Abstract
The objective of this study was to develop a reliable and cheap method to determine of milk urea nitrogen and compare some other instrumental methods. Two trials were conducted. In first trial, a milk urea nitrogen testing method was designed by modifying some methods developed for ammonia nitrogen testing method. Several studies were performed for the validation of method. By using standard solutions some applications such as determinability, recovery, repeatability, test of various analyzers and devices, limit of quantification were performed. Recovery of added urea averaged 99.38 %. In second trial, 105 individual milk samples from a dairy farm was analyzed for milk urea nitrogen by modified indophenol, infrared, and MiniFoodLab methods. The means of milk urea nitrogen obtained from three different methods were 23.87, 21.59, and 23.92 mg/dl, respectively. There was a positive correlation between modified indophenol and infrared methods.
Keywords: Milk urea nitrogen, Enzymatic Assay
Farklı Süt Üre Azotu Analiz Metotlarının Karşılaştırılması
Özet
Bu çalışmanın amacı süt üre azotu tayini için ekonomik ve güvenilir bir metodu geliştirmek ve bazı metotlarla karşılaştırmaktı. İki deneme halinde yürütüldü. Birinci denemede süt üre azotu analizi, amonyak ve üre analizi için geliştirilmiş bazı metotlar modifiye edilerek geliştirildi ve yöntemin doğrulanması ile ilgili çeşitli analizler yapıldı. Bu kapsamda standart eriyikler kullanılarak tespit edilebilirliği, geri alınabilirliği, süt örneklerinin tekrarlanabilirliği, değişik ölçümcülerin ve cihazların test edilmesi, tayin sınırının belirlenmesi gibi uygulamalar yapıldı. İlave edilen ürenin geri kazanımı % 99.38 idi. İkinci denemede bir çiftlikten elde edilen 105 adet bireysel süt örneği modifiye indofenol yöntemi, IR ölçüm yöntemi, MiniFoodLab ölçüm yöntemi ile üre azotu bakımından analiz edildi. Bu üç yöntemle elde edilen analiz sonuçları sırasıyla 23.87, 21.59 ve 23.92 mg/dl idi. Modifiye indofenol yöntemi ile IR yöntemi arasında orta seviyede pozitif bir korelasyon tespit edildi.
Anahtar sözcükler: Süt üre azotu, Enzimatik ölçüm
A Comparison of Different Analysis Methods for Milk Urea Nitrogen
Fatma İNAL
1Emel GÜRBÜZ
1Behiç COŞKUN
1Mustafa Selçuk ALATAŞ
1
1Selçuk Üniversitesi, Veteriner Fakültesi, Hayvan Besleme ve Beslenme Hastalıkları Anabilim Dalı, TR-42151 Konya
- TÜRKİYE
INTRODUCTION
While evaluating the nutritional status of a herd, the first points of consideration should be the rations and feedstuffs. The performance of an animal is the best indicator of feed quality. However, animal experiments are costly and in general, not preferred by the owners. Interpretation to a certain degree can be made through crude nutrient analysis. Another way of determining the nutritional status of cattle is to directly conduct blood tests, or in other words metabolic blood tests. However, taking blood from every animal and processing the obtained blood samples bring along some inconveniences. Monitoring herd health, milk yield and the components of milk, rather than conducting blood tests for every animal
is an effective method. For this purpose, milk yield and the levels of additives, fat, protein and urea of milk are monitored [1]. In order to determine the effectiveness of the
protein obtained through feed, either blood or milk urea nitrogen can be assessed. Yet, milk urea analysis (MUN) is more practical. The MUN level for Holstein dairy cattle milk is reported to be 13.7-14.0 mg/dl (10-18 mg/dl) in average. Individual MUN values, on the other hand, are considered to be normal within the range of 8-25 mg/dl [2-6].
There are several methods used for milk urea nitrogen determination. Milk urea nitrogen determination can be made from the color on the spectrophotometer by having urea directly or ammonia, as the decomposition product of urea, reaction with a reagent. In addition, milk urea level can be determined through IR spectrophotometric
İletişim (Correspondence)
+90 332 2232698
[email protected]measurement, on the basis of the amount of light absorbed at a given wavelength. Furthermore, there is the standard method where measurement can be made on the basis of pH difference [7] and methods similar to the standard
method [8] are used in milk urea nitrogen determination.
There are also devices specially developed for milk urea nitrogen measurement. MiniFoodLab is a practical MUN measurement device that can be used on the field. However, the number of samples that can be processed with it is fairly limited, and due to the fact that its reagents and ready-to-use cuvettes are imported, it is quite costly.
With devices running with the infrared method, numerous analyses can be conducted in a short period of time. However, the initial cost of such devices is very high, they require calibration in certain time intervals and inaccurate results may be obtained in cases where the number of milk samples is low. Researchers demonstrated that the IR method may inaccurately approximate high MUN as low and low MUN as high. Wet chemical method is superior to the IR method (primarily Foss 4000) in terms of accuracy, since it completely measures urea. The main problem is that it is a rather slow analysis method and requires separate equipments.
Peterson et al.[9] analyzed the milk samples obtained
from 100 Holstein dairy cattle through the use of CL-10, Skalar, Bentley, Foss 4000 and Foss 6000 equipments and reported that the respective recovery rates were 85, 95, 92, 47, and 95%, that there were differences among laboratories that used the same equipment, that the recovery decreased while the MUN level increased for Bentley and CL-10 equipments, that the recovery rate decreased with the increasing milk fat in Foss 6000, that the recovery rates obtained for the laboratories using Foss 4000 and Foss 6000 were inconsistent and therefore that with these systems the MUN results may be reported to be more or less than the actual values. Hanuṡ et al.[10]
determined recovery to be within quite wide ranges such as 258, 80-108, and 75-140% for the analyses conducted with the IR, standard and photometric methods.
In a similar study where Kohn et al.[11] compared
different equipment, it was determined that while the MUN results obtained through the Bentley, Foss 6000 and Skalar equipments were close to each other, quite different results were obtained from Foss 4000.
Luzzana and Giardino [8] developed a method for
measuring MUN on the basis of pH difference, determined the repeatability and recovery of the method as 0.85 and 99.4% respectively, and reported that the developed method is simple, accurate, fast and in harmony with the standard method. Wang et al.[12] compared 3 separate
methods by using Foss 4000, diacetyl monoxime and urea nitrogen kit, and reported that there were no difference among the results of MUN conducted on 50 samples of milk.
The purpose of the present project is to adapt a spectrophotometric method for analyzing urea nitrogen in milk, which is used in checking whether dairy cattle are adequately nourished in terms of protein and energy, and compare it to some existing methods.
MATERIAL and METHODS
The study was carried out in two trials. Trial 1
The MUN in this trial was conducted in line with ammonia and urea analysis in biological fluids as imple- mented by Weatherburn [13] and Chaney and Marbach [14],
with changes on urease enzyme [15] and the modified
indophenol method. Modifications of these methods; milk was replaced with serum or plasma, incubation temperatures and times, and enzyme concentration were changed.
Reagents, solutions: Reagent 1 (A1): 50 g phenol and 0.25 g sodium nitroprusside were dissolved with deionized water in a volumetric flask and diluted to 1.000 ml. Reagent 2 (A2): 25 g sodium hydroxide and 40 ml sodium hypochlorite (5.25 %) were put into a volumetric flask and diluted to 1.000 ml with deionized water. Enzyme solution: From the lyophilized urease enzyme preserved at +4°C (5 U/mg), 0.6 g was weighted and diluted to 100 ml (30 U/ml) with deionized water in volumetric flask. Standard solution: From the dried urea in the drying chamber, 0.8576 g was taken into volumetric flask, dissolved with deionized water and diluted to 1.000 ml (40 mg/dl). By taking varying amounts from the standard solution, solutions with varying nitrogen content were prepared.
Preparation of the standard curve: 100 µl urease solutions was put into spectro cuvettes, standard solutions containing 10 µl increasing concentrations of urea were added, the mixture was shaken and kept 10 min at 40°C temperature. Later on, the cuvettes were sealed and turned upside-down following the addition of 1 ml of A1 and A2. The preparation was kept 3 min at 55°C and the absorbances were read in spectrophotometer (Schimadzu UV 1240) against the blind sample that contained deionized water on 625 nm.
Preparation and analysis of milk: 100 µl urease solution was put into spectro cuvettes, supplemented with 10 µl homogenous milk sample heated at 40°C, mixed and kept for 10 min at 40°C. 1 ml A1 and 1 ml A2 were added, then the cuvettes were sealed and turned upside-down. After keeping the preparations 3 min at 55°C, absorbance was read in the same way.
Calculation of the results: The results were calculated on the basis of the regression equation obtained through the standard solutions.
Trial 2
The results of the analyses conducted with the modified indophenol method were compared with the results obtained from IR Foss device and the MiniFoodLab device that conducts spectrophotometric measurement.
As the analysis material, milk samples of approximately 80-100 ml were taken through sampling containers put into the milking system, during the milking of 105 cattle of varying levels of milk yield in a private establishment. In order to prevent the milk from getting spoiled, 2 tablets of bronopol (2-bromo-2-nitropropane-1,3 diol) were added. After the tablets were dissolved and the milk was turned upside-down for ensuring homogeneity, the milk was portioned and half of it was analyzed with the Foss FT120. The other half of the milk was analyzed in spectrophotometer with the modified indophenol method and with the MiniFoodLab MUN measurement device.
Statistical Analyses
In the evaluation of the data obtained from the study, paired t test, correlation - regression analyses were conducted [16].
RESULTS
Trial 1The standard deviation of the repeatability of the one of the standard solutions (2 mg/dl) as conducted by the same researcher, with the same equipment and with 10 iterations, was found out to be 0.083.
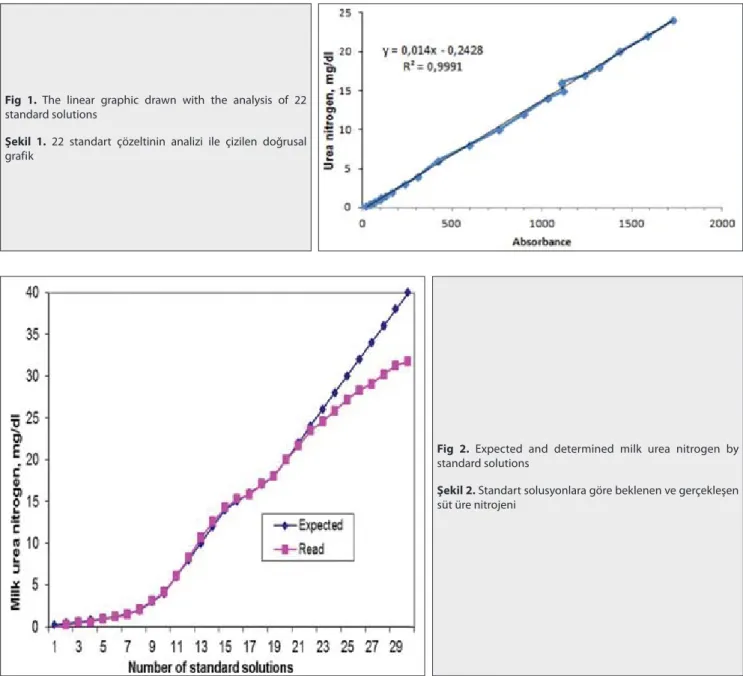
Fig. 1 presents the linear graphic obtained with the analysis 22 standard solutions and the regression equation. The result of readings for determinable ranges with standard solutions is shown in Fig. 2.
Fig 1. The linear graphic drawn with the analysis of 22
standard solutions
Şekil 1. 22 standart çözeltinin analizi ile çizilen doğrusal
grafik
Fig 2. Expected and determined milk urea nitrogen by
standard solutions
Şekil 2. Standart solusyonlara göre beklenen ve gerçekleşen
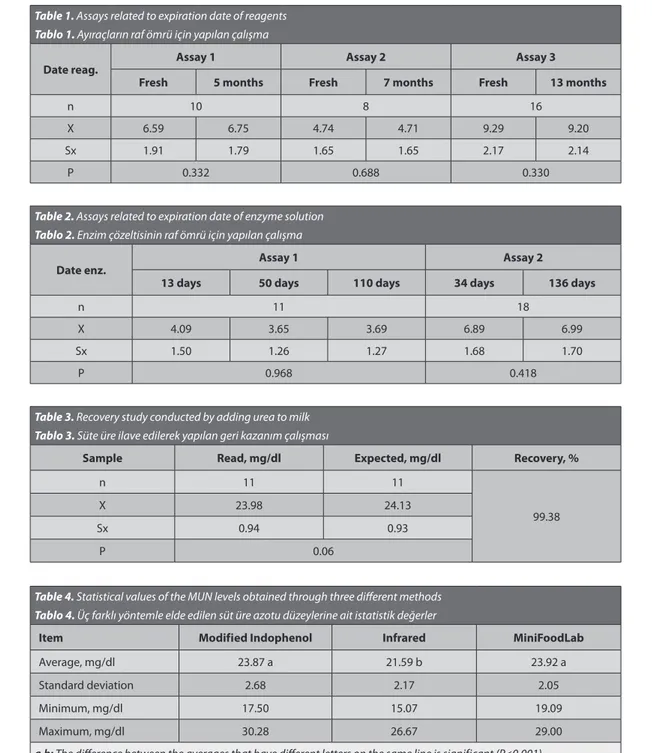
Table 1. Assays related to expiration date of reagents Tablo 1. Ayıraçların raf ömrü için yapılan çalışma
Date reag. Assay 1 Assay 2 Assay 3
Fresh 5 months Fresh 7 months Fresh 13 months
n 10 8 16
X 6.59 6.75 4.74 4.71 9.29 9.20
Sx 1.91 1.79 1.65 1.65 2.17 2.14
P 0.332 0.688 0.330
Table 2. Assays related to expiration date of enzyme solution Tablo 2. Enzim çözeltisinin raf ömrü için yapılan çalışma
Date enz. Assay 1 Assay 2
13 days 50 days 110 days 34 days 136 days
n 11 18
X 4.09 3.65 3.69 6.89 6.99
Sx 1.50 1.26 1.27 1.68 1.70
P 0.968 0.418
Table 3. Recovery study conducted by adding urea to milk Tablo 3. Süte üre ilave edilerek yapılan geri kazanım çalışması
Sample Read, mg/dl Expected, mg/dl Recovery, %
n 11 11
99.38
X 23.98 24.13
Sx 0.94 0.93
P 0.06
Table 4. Statistical values of the MUN levels obtained through three different methods Tablo 4. Üç farklı yöntemle elde edilen süt üre azotu düzeylerine ait istatistik değerler
Item Modified Indophenol Infrared MiniFoodLab
Average, mg/dl 23.87 a 21.59 b 23.92 a
Standard deviation 2.68 2.17 2.05
Minimum, mg/dl 17.50 15.07 19.09
Maximum, mg/dl 30.28 26.67 29.00
a,b: The difference between the averages that have different letters on the same line is significant (P<0.001)
Table 5. Linear regression equations for MUN conducted with different methods Tablo 5. Farklı metotlarla yapılan süt üre azotu analizi için linear regresyon denklemleri
Analysis Method Regression Equation R Significance
MI-IR 16.0360+0.2325xIR 0.29 * MI-MFL 25.8091-0.0791xMFL -IR-MI 16.2118+0.3550xMI 0.29 * IR-MFL 20.8623+0.1416xMFL -MFL-MI 27.1016-0.1349xMI -MFL-IR 17.8030+0.1581xIR
Statistical results of the expiration dates of the used reagents and enzyme solution are presented in Table 1 and Table 2.
Statistical analysis results of the recovery study conducted by adding certain levels of urea to a milk sample are presented in Table 3.
Trial 2
Distributions of the MUN levels determined at 105 samples through the modified indophenol (MI), infrared (IR) and MiniFoodLab (MFL) methods, statistical values and linear regression equations are presented in Table 4 and Table 5.
DISCUSSION
Trial 1In this trial, standard error of repeatability is 0.08 and the variation coefficient can be calculated as 4.10%. This value is within the 95% confidence limit. With an analysis method based on pH difference and with 0.85-1.50% variation coefficient, Luzzana and Giardino [8] found the
repeatability of the MUN measurement better than that found in the present study.
With the analysis of the solutions containing varying concentrations of urea, the linear regression equation was found out as Y = 0.014X-0.2428. Examining Fig. 1 shows that the majority (0.2-24 mg/dl) of the 22 standard solutions read is above the trendline. R2 = 0.9991. With the
method they implemented, also Luzzana and Giardino [8]
found a similar linearity and R value.
It was determined that a serial measurement consisting of the measurements of 25 different milk samples with iterations at 5 different times took about 90 min. From this, it was calculated that a single analysis took about 3 to 4 min. However, due to the fact that also standard solutions need to be analyzed every time when a milk sample is to be analyzed, it should be noted that a single analysis would take about 30 minutes with the addition of the waiting durations both with enzyme and reagents.
No significant difference could be found between the readings made on fresh and up to 13 months old reagents kept in the refrigerator, in order to determine the shelf life of the reagents used with the modified indophenol method. The important point here is that the Na hypochlorite contained in reagents should preserve its smell, or in other words its freshness. Na hypochlorite kept for long durations at room temperature loses its activity. Similarly, no difference could be found between the readings made on enzyme solutions kept in the refrigerator for 13, 34, 50, 110 and 136 days. However, Chaney and Marbach [14]
reported that while reagents could stay 60 days in a cold
and dark environment, enzyme solution could stay 30 days in a refrigerator. Having worked on a different enzymatic method, also Luzzana and Giardino [8] determined that
reagents can be preserved in refrigerator for 6 months. In the recovery study carried out by adding different amounts of urea to a milk sample, it was determined that the mean recovery rate was 99.38% and that there were no significant difference between the required and actually read MUN levels (P=0.06). With a method based on pH difference and similar to the standard method, also Luzzana and Giardino [8] found a recovery of 99.4%. In
analyses carried out with different automatic equipments, Peterson et al.[9] found a recovery rate of 30-64% with an
equipment and more that 85% with other equipments. In consequence of the readings made on 30 standard solutions with increasing concentrations up to 40 mg/dl, in order to determine the lowest and the highest MUN level that can be accurately determined with the method of analysis in question, the lowest and highest values were determined to be 0.6 and 24 mg/dl respectively (Fig. 2). These values are within the MUN values deemed normal for dairy cattle.
In other methods [13-15] which used in modification,
biological fluids have been studied, therefore it has not been discussed in here.
Trial 2
According to the MUN results of 105 milk samples analyzed through the modified indophenol, infrared and MiniFoodLab methods, the values obtained from the infrared method are significantly different than the values obtained with the other two methods (P<0.001). Agreement between the modified indophenol and MiniFoodLab method was assessed statistically.
Also Arunvipas et al.[17] determined a significant
difference between the results of the enzymatic method and the infrared method. Yet, on the contrary, Luzzana and Giardino [8] reported that the analysis results obtained
from the two different methods were consistent with each other. On the other hand, Peterson et al.[9] reported
that the MUN analysis results obtained from different models of the same IR equipment were inconsistent, and occasionally higher or lower than actual values can be obtained. Kohn et al.[11] found differences even between
different laboratories using the same IR equipments. In the present study, a significant correlation and a correlation coefficient of 0.29 (R2=0.083) was obtained
between the modified indophenol method and the infrared method. The regression equation was 16.0360+0.2325xIR for MI-IR and 16.2118+0.3550xMI for IR-MI. Hanuṡ et al.[10]
report either high or low correlations between the IR method and varying other photometric methods.
In conclusion, the modified indophenol method that was implemented within the scope of this study is a reliable, independent on foreign and cheaper method than others for determining milk urea nitrogen level. IR apparatus is more costly and requires calibrations regularly. MiniFoodLab apparatus is also costly and its reagents from abroad. However, reader person should be carefully at sampling and titrating. Reading range was found out to be between 0.6 and 24 mg/dl, and for reading higher levels dilution is required.
A medium level and positive correlation was determined between the modified indophenol method and the infrared method. However, there is no compatibility between these two methods. Similarly, none of the methods implemented in this study was compatible with any other.
REFERENCES
1. Eicher R: Evaluation of the metabolic and nutritional situation in dairy
herds: Diagnostic use of milk components. 23. World Buiatrics Congress, July 11-16 Canada, 2004.
2. Amaral-Phillips DM: Milk urea nitrogen - A nutritional evaluation tool?
http://afsdairy.ca.uky.edu/files/extension/nutrition/Milk_Urea_Nitrogen. pdf, Accessed: 10.04.2015.
3. Arunvipas P: Milk urea nitrogen: Quality control of testing, individual
cow factors, and correlations with bulk tank testing. A Thesis, Faculty of Veterinary Medicine University of Prince Edward Island, Canada, 2001.
4. Young A: Using milk fat and protein percentages to evaluate herd
nutrition and health. http://extension.usu.edu/dairy/files/uploads/htms/ fat_pro2.htm, Accessed: 10.4.2015.
5. Coskun B, Inal F, Gurbuz E, Polat ES, Alatas MS: The effects of
additional glycerol in different feed form on dairy cows. Kafkas Univ
Vet Fak Derg, 18, 115-120, 2012. DOI: 10.9775/kvfd.2011.5143
6. Coşkun B, İnal F, Gürbüz E, Balevi T, Şeker E: Geçiş dönemindeki
süt ineklerinde gliserol kullanımının etkileri. Eurasian J Vet Sci, 26, 2, 87- 92, 2010.
7. TS EN ISO 14637: Süt - ürea içeriği tayini - pH farkının kullanıldığı
enzimatik metot (referans metot). Türk Standardları Enstitüsü, Ankara, 2007.
8. Luzzana M, Giardino R: Urea determination in milk by a differential
pH technique. Lait, 79, 261-267, 1999. DOI: 10.1051/lait:1999221
9. Peterson AB, French KR, Russek-Cohen E, Kohn RA: Comparison of
analytical methods and the influence of milk components on milk urea nitrogen recovery. J Dairy Sci, 87, 1747-1750, 2004. DOI: 10.3168/jds. S0022-0302(04)73329-9
10. Hanuš O, Hering P, Frelich J, Jilek M, Genčurova V, Jedelska R:
Reliability of results of milk urea analysis by various methods using artificial milk control samples. Czech J Anim Sci, 53, 152-161, 2008.
11. Kohn RA, French KR, Russek-Cohen E: A comparison of instruments
and laboratories used to measure milk urea nitrogen in bulk-tank milk samples. J Dairy Sci, 87, 1848-1853, 2004. DOI: 10.3168/jds.S0022-0302(04)73342-1
12. Wang DW, Cao ZJ, Wang ZS, Huang WM, Li SL, Wang Y, Wen W, Shao HF: Comparison of determination methods for milk urea nitrogen.
China Dairy Cattle, 09 2010.
13. Weatherburn MW: Phenol-hypochlorite reaction for determination
of ammonia. Anal Chem, 39, 971-974. 1967. DOI: 10.1021/ac60252a045
14. Chaney AL, Marbach EP: Modified reagents for determination of
urea and ammonia. Clin Chem, 8 (2): 130-132, 1962.
15. Bressler LF, Steinbrink F: Stabilized phenol nitroprusside reagent
and analysis of nitrogen. United States Patent: 3, 769,172 Oct 30, 1973.
16. İnal Ş: Biyometri. Selçuk Üniversitesi Veteriner Fakültesi, Konya, 2005. 17. Arunvipas P, Vanleeuwen JA, Dohoo IR, Kefe GP: Evaluation of
the reliability and repeatability of automated milk urea nitrogen testing.