http://e-nrp.org
Effect of seasonal changes on nutritional status and biochemical
parameters in Turkish older adults
Nesli Ersoy1, İlker Taşçi2, Taner Özgürtaş3, Bekir Salih4, Hüseyin Doruk5 and Neslişah Rakicioğlu1§
1Hacettepe University, Faculty of Health Sciences, Department of Nutrition and Dietetics, Ankara 06100, Turkey 2University of Health sciences, Faculty of Medicine, Department of Internal Diseases, Ankara 06018, Turkey 3University of Health sciences, Faculty of Medicine, Department of Medical Biochemistry, Ankara 06018, Turkey 4Hacettepe University, Faculty of Science, Department of Chemistry, Ankara 06800, Turkey
5Başkent University, Faculty of Medicine, Department of Internal Diseases Geriatrics Subdivision, Ankara 06490, Turkey
BACKGROUND/OBJECTIVES: Available data suggest that seasonal changes may influence the nutritional status and overall health of elderly individuals. Therefore, this study was conducted to investigate the effects of seasonal changes and related factors on energy and nutrient intake of older adults.
SUBJECTS/METHODS: Individuals aged 65 years or over were prospectively enrolled in this single-center study (male: 11, female: 20). Data were collected between May 2013 and February 2014 during winter, spring, summer and autumn. Food consumption and biochemical parameters were taken during each season to assess the seasonal nutrition status of the elderly. Upon analysis of biochemical parameters (retinol, vitamin D and vitamin C), an high-performance liquid chromatography device was utilized whereas an Immulite 2000 device was utilized during analysis of serum folic acid and parathyroid hormone.
RESULTS: Fruit, fat, egg and bread consumption varied seasonally in males and females (P < 0.05). During winter, daily energy intake was found to be greater than in other seasons in males (557 kcal) and females (330 kcal) (P < 0.05). Additionally, carbohydrates, vegetable protein, n-3 fatty acid and sodium intake increased in winter, while the n-6/n-3 ratio increased in summer among males (P < 0.05). Dietary fiber and sodium intake in winter, vitamin C, iron and zinc intake in spring, and cholesterol, retinol, vitamin D and niacin intake in autumn were found to be higher in females when compared to other seasons (P < 0.05). Serum parathyroid hormone level was higher in winter, and vitamin D level was higher in autumn in both genders (P < 0.05). In males, blood folic acid level was higher in winter, while vitamin C level was higher in females, and there was no seasonal variation in retinol concentration (P < 0.05).
CONCLUSION: Food consumption and biochemical parameters showed significant seasonal variations in older adults. It is not clear if nutrition plans in older adults will benefit from consideration of seasonal changes in eating habits.
Nutrition Research and Practice 2018;12(4):315-323; https://doi.org/10.4162/nrp.2018.12.4.315; pISSN 1976-1457 eISSN 2005-6168 Keywords: Seasonal changes, nutritional status, biochemical parameters, older adults
INTRODUCTION
6)Physiological and psychological changes associated with old age influence the health of aging populations, as well as their food consumption and subsequent nutritional status [1]. Chronic diseases are also more prevalent in this population than in younger adults and are thought to impact food choices, healthy eating and nutrient intake. Older people are also susceptible to malnutrition because of pre-existing multiple chronic diseases. Seasonal variations in food consumption and associated physiological changes can differ because of the tendency to contract chronic diseases and the existence of multiple chronic diseases [2]. In previous studies, seasonal changes reportedly affected the emotional state, appetite (hormonal state), seasonal food manufacturing (especially fruits and
vegetable), food cost and consequently food consumption of people, but no specific data have been published regarding elderly individuals [3,4]. Variations in food consumption can be determined by measuring energy consumption and nutrition intake as well looking at as serum/plasma parameters to determine seasonal nutritional status [4]. However, there is limited evidence regarding seasonal changes, food accessibility, food choice and consumption among people of old age [3,4]. Therefore, it is important to evaluate nutritional status in the elderly who might be at higher risk of malnutrition [1, 6]. Thus, this study was conducted to investigate seasonal changes in energy intake in older adults and to explore the associated factors.
This study was supported by Hacettepe University Scientific Research Projects Coordination Unit (Project Number: H.Ü. B.A.B, 014.D07.401.001-378).
§Corresponding Author: Neslişah Rakıcıoğlu, Tel. 90-31-2305-1096, Fax. 90-31-2309-1310, Email. [email protected]
Received: April 18, 2018, Revised: June 27, 2018, Accepted: July 19, 2018
This is an Open Access article distributed under the terms of the Creative Commons Attribution Non-Commercial License (http://creativecommons.org/licenses/by-nc/3.0/) which permits unrestricted non-commercial use, distribution, and reproduction in any medium, provided the original work is properly cited.
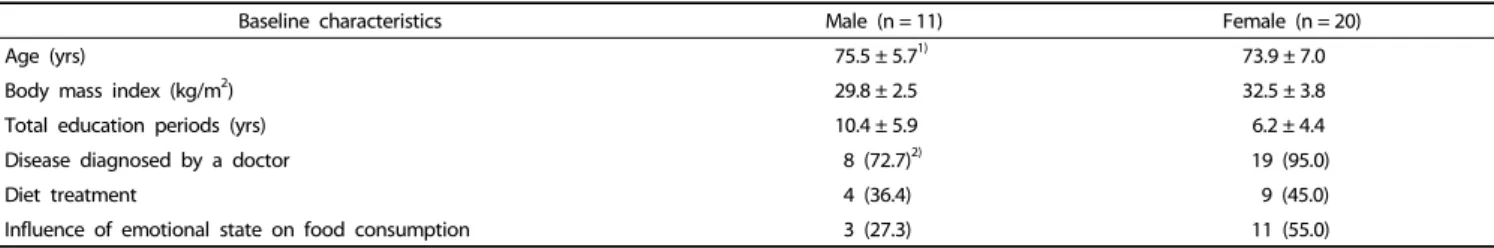
Baseline characteristics Male (n = 11) Female (n = 20)
Age (yrs) 75.5 ± 5.71) 73.9 ± 7.0
Body mass index (kg/m2) 29.8 ± 2.5 32.5 ± 3.8
Total education periods (yrs) 10.4 ± 5.9 6.2 ± 4.4
Disease diagnosed by a doctor 8 (72.7)2) 19 (95.0)
Diet treatment 4 (36.4) 9 (45.0)
Influence of emotional state on food consumption 3 (27.3) 11 (55.0)
1)Mean ± SD 2)n (%)
Table 1. General characteristics of older adults
SUBJECTS AND METHODS
Free living participants aged 65 years or over residing in Ankara province, Turkey were enrolled in this single center prospective study (male: 11, female: 20). Inclusion criteria were having sufficient cognitive and functional ability to adapt to and understand the study procedures (with cognitive tests), residing in the same region for at least the last three years, and willing to take part in the study. Participants were asked to sign the informed consent form and reminded that they could withdraw any time without citing any reasons.
Exclusion criteria were receiving hospital treatment (or being bed bound at home), having memory and speech disorders, cancer, traumatic disease (such as associated with an accident), swallowing disorders (such as dysphagia), difficulties in accessing and preparing food, receiving enteral/parenteral nutrition (at home or hospital), and taking vitamins and or mineral supplements. The study protocol was approved by the ethics committee of Gulhane Military Medical Academy, Turkey (Number: 13/1,648.4-1,242). Biochemical analyses were conducted under the project with the support of the Hacettepe University Scientific Researches Unit (Number: 2014/27-1).
Study procedures
The study ran between 15 May, 2013 and 30 November, 2014. Four seasonal periods planned for measurements were winter (January, February), spring (April, May), summer (July, August) and autumn (October, November).
At the start of the study and during follow-up periods (1 in 3 months), general information (education, disease and diet etc.) and co-morbidities were recorded along with anthropometric data [weight, height, body mass index (BMI)], individual food consumption and biochemical parameters [folic acid, parathyroid hormone (PTH), vitamin D, retinol and vitamin C] were recorded during the sampling periods. These biochemical parameters were selected, because they are commonly inadequate among Turkish elderly, which are related to food consumption, with the exception of vitamin D. All records and measurements were made by a single researcher, the data were anonymized, and no-one apart from the research team had access to the data.
Seasonal food consumption
During each seasonal period, food consumption was recorded on three consecutive days, including one weekend day, by researchers. BEBİS (Nutrition Information System) was used to calculate daily energy and nutrient intakes.
The Turkish recommended daily allowance (RDA) according
to age and gender [7] were used to determine the percentages of daily energy and nutrient intakes. Nutrient intake below two-thirds of the RDA (67%) was considered low.
Biochemical parameters
Following an overnight fast for at least 8 hours, venous blood samples were drawn at start of each period. All specimens were wrapped with aluminum foil and kept for 30-60 minutes at room temperature before being centrifuged at (2,000 × g 15 min at 4°C). Plasma and serum samples were kept at -80°C until assayed. All measurements were run in duplicate and the mean values were calculated. Retinol, Vitamin D and Vitamin C were measured by HPLC (High-performance liquid chromatography), and folic acid and PTH were measured using an Immulite 2,000 device (Siemens, Germany) [8-11].
Statistical analyses
All analyses were performed using the SPSS (PASW) 23.0 software (SPSS Inc, Chicago, Illinois). Continuous variables were presented as the means and standard deviation. Categorical data were presented as an absolute number and a percentage of the total. Non-normal distribution was tested by the Shapiro- Wilk test. Seasonal changes in numerical values were calculated by Friedman’s test and Wilcoxon Rank. The differences in qualitative data over different seasons were tested by the Cohran Q test, while McNemar test was used to determine which season caused any identified differences. Spearman correlation coefficients were calculated to test the relationship between nutrient intake and biochemical parameters. Statistical significance was tested at P < 0.05.
RESULTS
A total of 43 individuals were initially enrolled, but two passed away during the study and another ten withdrew consent. Among the 31 remaining subjects, 20 (65%) were female and the mean ages were 73.9 ± 7.0 and 75.5 ± 5.7 years for females and males, respectively. Additionally, the mean education years were 6.2 ± 4.4 years in females and 10.4 ± 5.9 years in males. The number of individuals with self-reported diseases was 19 in females and 8 in males. Additionally, nine females and four of males reported a current diet therapy for any reason (e.g., reducing diet, diabetes or cardiovascular system diseases). The mean BMI value was found to be 29.8 ± 2.5 kg/m2 and 32.5
± 3.8 kg/m2 in males and females, respectively. Additionally,
55% and 27.3% of female and male participants, respectively, reported that emotional state affected their food consumption.
Foods Ma le ( n = 11 ) Fe m al e ( n = 20) W int er S pr ing Su mm er Aut umn P-val ue W int er Sp rin g Su m m er A ut um n P-va lu e D ai ry 145 .5 ± 117. 8 1) 18 4. 1 ± 97. 5 17 8. 0 ± 82. 0 158. 8 ± 74 .2 0. 591 15 6. 7 ± 85. 0 201. 6 ± 90 .4 180. 0 ± 78 .0 159 .9 ± 86. 4 0. 32 3 M eat an d m eat-li ke fo od s M eat 58 .0 ± 44. 8 86. 1 ± 30. 8 66. 4 ± 57. 1 45. 5 ± 30 .7 0. 170 57 .6 ± 41. 7 75. 4 ± 49 .6 46. 7 ± 37 .1 46 .9 ± 38. 6 0. 23 8 Poul tr y 33 .7 ± 51. 4 11. 3 ± 23. 7 19. 7 ± 40. 1 27. 8 ± 44 .4 0. 363 15 .4 ± 31. 3 12. 0 ± 32 .8 7. 6 ± 12 .2 25 .1 ± 46. 8 0. 86 8 Fi sh 50 .9 ± 149. 7 1. 8 ± 6. 0 7. 0 ± 20. 1 10. 6 ± 18 .9 0. 529 9. 8 ± 25. 1 1. 0 ± 4. 5 13. 5 ± 33 .9 28 .0 ± 47. 5 0. 05 5 Egg 29 .0 ± 20 .8 15 .5 ± 20. 5 20. 7 ± 13. 4 31. 9 ± 12 .4 0. 119 35 .6 ± 29. 1 a, b 19. 0 ± 19 .8 c 20. 8 ± 13 .5 b, c 34 .2 ± 16. 5 a 0. 00 2 O ils ee d 23 .4 ± 18 .9 13 .4 ± 10. 6 15. 0 ± 13. 1 20. 3 ± 12 .3 0. 152 30 .9 ± 40. 7 28. 7 ± 48 .8 14. 5 ± 10 .0 24 .3 ± 28. 2 0. 81 2 Le gu m es 26 .1 ± 24 .2 17 .9 ± 18. 8 19. 8 ± 17. 7 11. 7 ± 12 .3 0. 641 19 .5 ± 22. 5 19. 0 ± 22 .1 10. 8 ± 14 .7 10 .9 ± 17. 4 0. 65 0 Br ea ds a nd ce re al s Br eads 130 .2 ± 128. 4 84. 6 ± 52. 3 96. 5 ± 39. 1 108. 7 ± 47 .8 0. 594 99 .4 ± 76. 4 a, b 72. 0 ± 40 .6 a 84. 8 ± 44 .7 a, b 98 .7 ± 58. 0 b 0. 00 8 Ce re al s 79 .5 ± 40. 0 51. 2 ± 28. 5 60. 7 ± 27. 5 44. 9 ± 32 .4 0. 161 61 .4 ± 35. 6 48. 9 ± 29 .9 60. 3 ± 48 .3 38 .2 ± 24. 2 0. 35 9 Pas ta 8 .4 ± 13 .1 13 .8 ± 18. 3 7. 3 ± 16. 2 11. 0 ± 18 .0 0. 364 8. 7 ± 16. 5 5. 0 ± 13 .7 8. 5 ± 12 .6 9. 4 ± 16. 7 0. 42 8 Ve ge tab le s a nd fru its Ve ge ta bl es 226 .0 ± 81. 7 36 4. 5 ± 171 .7 32 9. 0 ± 129 .8 252. 0 ± 18 1. 4 0. 126 20 0. 8 ± 120 .5 304. 8 ± 15 3. 0 298. 4 ± 15 8. 2 242 .5 ± 157. 3 0. 08 6 Fr ui ts 167 .1 ± 152. 1 a 13 9. 7 ± 124 .9 a 19 1. 6 ± 126 .3 a, b 295. 5 ± 20 8. 0 b 0. 025 22 1. 6 ± 170 .7 241. 1 ± 12 1. 9 208. 8 ± 13 3. 3 235 .8 ± 192. 5 0. 72 4 Tot al 393 .1 ± 198. 6 50 4. 2 ± 215 .1 52 0. 6 ± 209 .8 547. 5 ± 35 4. 4 0. 301 42 2. 4 ± 216 .9 545. 8 ± 16 9. 0 507. 1 ± 21 3. 8 478 .3 ± 293. 3 0. 05 9 Fa ts Oils 29 .6 ± 15. 7 29. 4 ± 12. 2 30. 3 ± 11. 6 23. 7 ± 15 .7 0. 127 22 .5 ± 11. 5 26. 4 ± 11 .0 24. 5 ± 8. 5 21 .5 ± 15 .3 0. 61 4 Sol id f at s 12 .4 ± 13. 3 a 6. 3 ± 6. 5 a, c 3. 5 ± 5. 3 b, c 7. 1 ± 9. 0 b, c 0. 020 11 .2 ± 17. 1 3. 9 ± 6. 5 3. 0 ± 3. 4 10 .1 ± 13 .4 0. 12 8 1)M ean ± S D a, b, cVal ues w ithi n a ro w w ith di ffe re nt s up er scr ip ts ar e si gn ifi can tly d iff er ent b as ed o n W ilc ox on s ig ne d ra nk s te st Ta bl e 2 . S ea so na l f oo d c on su m pt io n i n o ld er a du lts ( g)
En er gy a nd nu tr ie nt s Ma le ( n = 11 ) Fe m al e ( n = 20) W int er Spr ing Su m m er A ut um n P-val ue W int er Sp rin g Su m m er A ut um n P-va lu e En er gy ( kca l) 2, 232 ± 504 1)a 1, 638 ± 435 b, c 1, 65 5 ± 401 b, c 1, 75 1 ± 471 a, b, c 0. 020 1, 88 7 ± 562 a, b 1, 74 7 ± 53 4 a, b, c 1, 54 4 ± 37 9 c 1, 827 ± 574 b 0. 01 4 C ar bohydr at e ( g) 249 .6 ± 83. 6 a 159 .2 ± 65. 4 b, c 16 1. 7 ± 43. 9 b, c 18 5. 3 ± 67. 4 a, b, c 0. 006 20 0. 9 ± 80. 2 164. 7 ± 55 .2 162. 5 ± 48 .9 189 .1 ± 77. 3 0. 08 Fi be r ( g) 24 .9 ± 9. 3 18 .9 ± 3. 5 20. 7 ± 5. 7 20. 9 ± 9. 8 0. 409 23 .4 ± 10. 2 a 21. 1 ± 8. 9 a, b 17. 6 ± 5. 2 b 20 .6 ± 7.9 a, b 0. 00 5 Pr ot ei n ( g) 86 .7 ± 33 .9 64 .7 ± 14. 6 64. 6 ± 18. 7 62. 8 ± 17. 7 0. 139 69 .7 ± 19. 5 66. 8 ± 20 .3 56. 7 ± 16 .2 68 .8 ± 15. 3 0. 10 2 Veg et abl e pr ot ei n (g ) 35. 8 ± 12 .5 a 25 .6 ± 7.2 b 26 .6 ± 7.2 b 24 .7 ± 7.8 b 0. 032 28 .4 ± 9. 2 27. 2 ± 12 .0 23. 7 ± 7. 3 25 .7 ± 8. 0 0. 34 2 Fa t ( g) 96 .4 ± 26 .5 80 .3 ± 18. 9 81. 7 ± 24. 3 81. 9 ± 22. 4 0. 375 87 .4 ± 32. 7 88. 9 ± 38 .4 72. 4 ± 19 .8 86 .7 ± 32. 6 0. 14 9 C hol es te ro l ( m g) 280 .6 ± 108. 6 205 .3 ± 84. 4 23 9. 4 ± 113 .5 26 8. 1 ± 46. 9 0. 048 28 0. 9 ± 121 .4 a 224. 1 ± 93 .4 b 213. 1 ± 66 .9 b 293 .6 ± 82. 8 a 0. 00 2 O m eg a 3 ( g) 2.1 ± 1.1 a, c 1. 2 ± 0. 2 b 1. 2 ± 0. 5 b 1. 5 ± 0. 4 b, c 0. 017 1. 6 ± 0. 7 1. 2 ± 0. 3 1. 4 ± 0. 6 2. 1 ± 1. 7 0. 28 2 n-6/ n-3 r at io 11. 1 ± 5. 0 a, b 12 .6 ± 5.6 a, c 15 .6 ± 6.7 a 9. 8 ± 4. 0 b, c 0. 007 12 .1 ± 4. 7 13. 0 ± 5. 0 13. 4 ± 7. 4 10 .1 ± 6. 3 0. 20 6 Re tin ol ( μg) 453 .2 ± 167. 6 323 .7 ± 112. 4 76 3. 5 ± 140 8. 0 41 8. 4 ± 108 .1 0. 138 43 8. 0 ± 224 .3 a, b 359. 1 ± 13 2. 7 a 354. 8 ± 16 1. 9 a 487 .6 ± 224. 2 b 0. 00 6 Vi ta m in D ( μg) 2) 1. 0 ± 0. 6 0. 5 ± 0. 5 1. 7 ± 3. 8 2. 4 ± 3. 8 0. 061 1. 6 ± 2. 8 a, b 0. 5 ± 0. 5 c 0. 8 ± 0. 7 a. c 2. 7 ± 3. 5 b 0. 00 1 Vi ta m in B 1 ( m g) 0. 9 ± 0. 3 0. 8 ± 0. 2 0. 8 ± 0. 2 0. 8 ± 0. 2 0. 137 0. 8 ± 0. 3 0. 9 ± 0. 4 0. 7 ± 0. 2 0. 8 ± 0. 2 0. 23 1 Vi ta m in B 2 (m g) 1. 4 ± 0. 5 1. 2 ± 0. 2 1. 3 ± 0. 4 1. 2 ± 0. 3 0. 795 1. 3 ± 0. 4 1. 3 ± 0. 4 1. 2 ± 0. 3 1. 3 ± 0. 4 0. 23 5 N iaci n ( m g) 35 .1 ± 34. 1 19 .6 ± 5. 4 21. 3 ± 5. 8 21. 8 ± 7. 8 0. 375 22 .8 ± 5. 8 a 21. 1 ± 8. 2 a, b 18. 3 ± 5. 4 b 23 .8 ± 7.5 a 0. 04 6 Vi ta m in B 6 ( m g) 1. 5 ± 0. 3 1. 3 ± 0. 3 1. 4 ± 0. 3 1. 3 ± 0. 5 0. 526 1. 4 ± 0. 5 1. 4 ± 0. 4 1. 2 ± 0. 3 1. 4 ± 0. 5 0. 30 6 Fo lic a cid ( μg ) 357 .1 ± 109. 2 326 .4 ± 88. 7 33 4. 6 ± 77. 9 31 9. 1 ± 122 .8 0. 664 34 6. 9 ± 151 .3 338. 8 ± 11 8. 5 283. 0 ± 71 .9 320 .7 ± 104. 9 0. 03 7 Vi ta m in B 12 (μ g) 3. 5 ± 1. 6 4. 1 ± 1. 2 4. 6 ± 3. 6 3. 5 ± 0. 9 0. 525 4. 0 ± 1. 4 4. 2 ± 1. 4 3. 4 ± 1. 5 4. 4 ± 2. 2 0. 10 1 Vi ta m in C ( m g) 124 .5 ± 60. 3 154 .6 ± 64. 5 15 2. 7 ± 56. 0 14 3. 7 ± 83. 2 0. 252 14 4. 7 ± 66. 1 a, b 161. 7 ± 58 .7 a 124. 7 ± 64 .3 b, c 133 .7 ± 78. 6 a, c 0. 01 6 So dium ( m g) 3) 2, 272 .4 ± 825. 3 a, b 1, 378 .3 ± 355. 8 c 1, 46 0. 2 ± 471 .8 c 2, 08 3. 8 ± 842 .9 b 0. 025 1, 88 4. 0 ± 861 .8 a 1, 442. 3 ± 63 2. 7 b 1, 624. 4 ± 52 2. 3 a. b 1, 750 .9 ± 543. 9 a 0. 02 5 C al ci um ( m g) 633 .0 ± 183. 2 593 .6 ± 123. 9 57 3. 3 ± 116 .5 58 7. 8 ± 125 .6 0. 427 66 9. 8 ± 299 .1 700. 2 ± 23 8. 6 607. 8 ± 17 3. 6 653 .9 ± 242. 4 0. 54 4 M agn esi um ( m g) 297 .6 ± 95. 9 258 .6 ± 87. 1 24 9. 5 ± 69. 4 24 4. 9 ± 84. 7 0. 375 28 1. 4 ± 128 .5 288. 2 ± 14 7. 9 225. 6 ± 70 .3 252 .0 ± 92. 2 0. 10 9 Iro n (m g) 15 .9 ± 9. 1 12 .0 ± 3. 2 11 .5 ± 3.1 11 .3 ± 4.0 0. 34 4 12 .2 ± 4.5 a 12. 3 ± 4. 8 a, b 10. 3 ± 3. 4 b 11 .3 ± 3.2 a, b 0. 04 1 Zi nc ( m g) 11 .6 ± 3. 5 10 .4 ± 2. 5 10 .2 ± 3. 3 9. 3 ± 2. 3 0. 766 10 .4 ± 3. 6 a 10. 8 ± 3. 8 a 8. 5 ± 2. 6 b 9. 6 ± 2. 5 a, b 0. 05 0 a, b, cVal ues w ithi n a ro w w ith di ffe re nt s up er scr ip ts ar e si gn ifi can tly d iff er ent b as ed o n W ilc ox on s ig ne d ra nk s te st 1)M ean ± S D 2)A per so n had e xcessi ve vi tam in D i ntake, w hi ch c ha ng ed t he o ver al l aver ag e; t he re fo re , da ta fro m ten p eo pl e w er e us ed . 3)Am ount o f so di um t ha t fo od c on ta in s. Ta bl e 3 . D ai ly e ne rg y an d n utrie nt s in ta ke a cco rd in g to se as on s i n o ld er ad ul ts
Ener gy and nut rie nt s ( % ) Ma le ( n = 11 ) Fe m al e ( n = 20) W int er Spr ing Su m m er A ut um n P-val ue W int er Sp rin g Su m m er A ut um n P-va lu e En er gy 106 ± 24 1) 78 ± 21 79 ± 19 83 ± 22 0. 926 10 5 ± 31 a 98 ± 30 a, b 86 ± 21 b 102 ± 32 a, b 0. 01 6 Fi be r 86 ± 32 65 ± 12 71 ± 20 72 ± 34 0. 795 11 1 ± 49 10 1 ± 42 84 ± 25 98 ± 38 0. 09 1 Vi ta m in D 2) 10 ± 6 a, b 6± 6 a 17 ± 38 a, b 24 ± 38 b 0. 014 16 ± 28 5 ± 4 8 ± 7 27 ± 35 0. 05 4 Vi ta m in B 1 80 ± 26 a 59 ± 19 b 69 ± 14 a, b 66 ± 21 a 0. 025 75 ± 28 69 ± 36 65 ± 14 72 ± 21 0. 86 6 Vi ta m in B 2 110 ± 38 93 ± 28 10 1 ± 32 94 ± 20 0. 492 11 8 ± 40 10 7 ± 39 10 6 ± 25 104 ± 31 0. 40 9 N iaci n 219 ± 213 123 ± 33 13 3 ± 36 13 6 ± 49 0. 666 16 3 ± 41 15 1 ± 59 13 0 ± 38 170 ± 54 0. 15 0 Vi ta m in B 6 89 ± 18 104 ± 24 86 ± 21 75 ± 29 0. 497 91 ± 31 a, b 11 2 ± 31 a 81 ± 20 b, c 92 ± 33 b 0. 01 1 Vi ta m in B 12 148 ± 65 171 ± 50 19 1 ± 150 14 5 ± 37 0. 517 16 8 ± 58 17 4 ± 57 14 1 ± 63 182 ± 91 0. 33 0 Fo lic ac id 89 ± 27 82 ± 22 84 ± 19 80 ± 31 0. 294 87 ± 38 85 ± 30 71 ± 18 80 ± 26 0. 21 2 Vi ta m in C 138 ± 67 172 ± 72 17 0 ± 62 16 0 ± 92 0. 537 16 1 ± 73 18 0 ± 65 13 9 ± 71 149 ± 87 0. 17 5 C al ci um 53 ± 15 49 ± 10 48 ± 10 49 ± 10 0. 914 56 ± 25 58 ± 20 51 ± 14 54 ± 20 0. 41 3 Iron 159 ± 91 120 ± 32 11 6 ± 30 11 3 ± 40 0. 081 12 2 ± 45 12 3 ± 47 10 3 ± 34 114 ± 32 0. 38 0 Zi nc 106 ± 32 94 ± 23 93 ± 30 85 ± 21 0. 689 10 4 ± 36 10 8 ± 38 86 ± 26 96 ± 25 0. 04 3 M agn esi um 71 ± 23 62 ± 21 59 ± 17 58 ± 20 0. 666 88 ± 40 90 ± 46 70 ± 22 79 ± 29 0. 09 2 a, b, c Val ues w ithi n a ro w w ith di ffe re nt s up er scr ip ts ar e si gn ifi can tly d iff er ent b as ed o n Fr ie dm an ’s test 1)M ean ± S D 2)n = 10 , a per son had excessi ve vi tam in D i nt ake, w hi ch c han ged th e ov er al l aver age; t her ef or e, data fro m t en peo pl e w er e used . Ta bl e 4 . The pe rc ent ag es of m ee tin g d ai ly ener gy and nut rie nt r equi rem en ts i n ol der a du lts
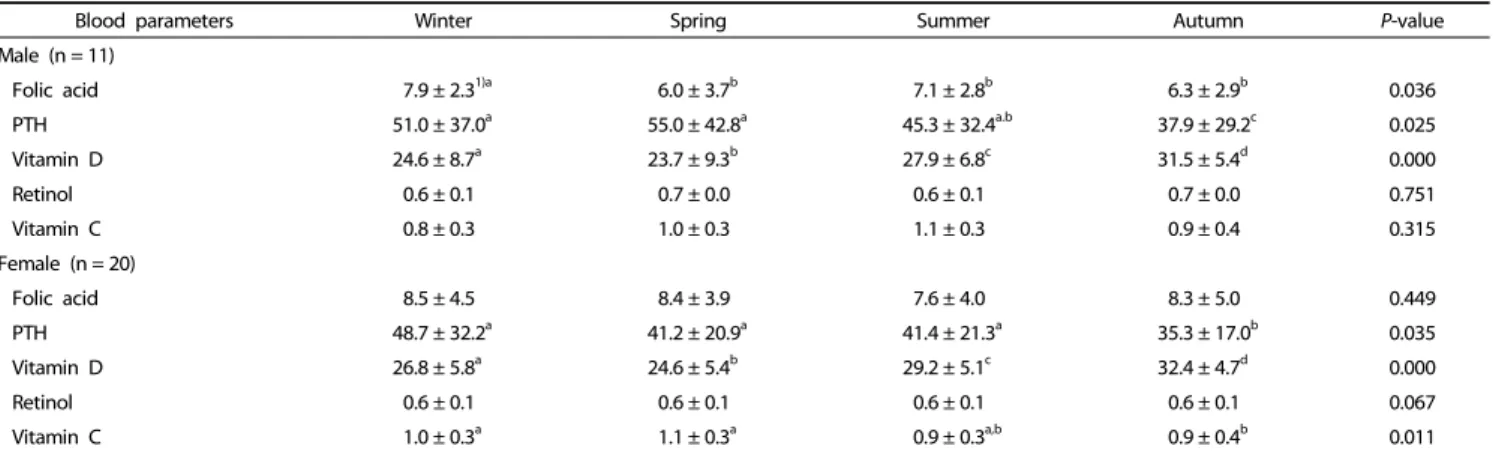
Blood parameters Winter Spring Summer Autumn P-value
Male (n = 11)
Folic acid 7.9 ± 2.31)a 6.0 ± 3.7b 7.1 ± 2.8b 6.3 ± 2.9b 0.036
PTH 51.0 ± 37.0a 55.0 ± 42.8a 45.3 ± 32.4a.b 37.9 ± 29.2c 0.025 Vitamin D 24.6 ± 8.7a 23.7 ± 9.3b 27.9 ± 6.8c 31.5 ± 5.4d 0.000 Retinol 0.6 ± 0.1 0.7 ± 0.0 0.6 ± 0.1 0.7 ± 0.0 0.751 Vitamin C 0.8 ± 0.3 1.0 ± 0.3 1.1 ± 0.3 0.9 ± 0.4 0.315 Female (n = 20) Folic acid 8.5 ± 4.5 8.4 ± 3.9 7.6 ± 4.0 8.3 ± 5.0 0.449 PTH 48.7 ± 32.2a 41.2 ± 20.9a 41.4 ± 21.3a 35.3 ± 17.0b 0.035 Vitamin D 26.8 ± 5.8a 24.6 ± 5.4b 29.2 ± 5.1c 32.4 ± 4.7d 0.000 Retinol 0.6 ± 0.1 0.6 ± 0.1 0.6 ± 0.1 0.6 ± 0.1 0.067 Vitamin C 1.0 ± 0.3a 1.1 ± 0.3a 0.9 ± 0.3a,b 0.9 ± 0.4b 0.011 PTH: parathyroid hormone
a,b,cValues within a row with different superscripts are significantly different based on Wilcoxon signed ranks test 1)Mean ± SD
Table 5. Blood parameters measured during different seasons in older adults
Blood parameters Winter Spring Summer Autumn Male (n = 11)
Folic acid intake
Folic acid P 0.201 0.170 0.096 0.863 r 0.418 0.445 0.527 0.059 Vitamin D intake Vitamin D1) P 0.166 0.832 0.894 0.272 r 0.474 0.073 0.046 -0.364 Retinol intake Retinol P 0.041 0.300 0.805 0.823 r 0.621* 0.344 0.084 -0.076 Vitamin C intake Vitamin C P 0.000 0.000 0.000 0.000 r 0.991** 0.886** 0.973** 0.945** Female (n = 20)
Folic acid intake
Folic acid P 0.405 0.743 0.745 0.313 r 0.197 0.078 0.077 0.238 Vitamin Dintake Vitamin D P 0.765 0.952 0.912 0.001 r 0.071 -0.014 -0.026 -0.674* Retinol intake Retinol P 0.598 0.757 0.645 0.926 r 0.216 0.074 0.11 -0.022 Vitamin C intake Vitamin C P 0.000 0.000 0.000 0.000 r 0.996** 0.841** 0.979** 0.977**
1)n = 10, a person had excessive vitamin D intake, which changed the overall
average; therefore, data from ten people were used. *P< 0.05, **P< 0.01 based on Spearman's correlation test.
Table 6. Correlation between dietary intake of nutrients and blood parameters in older adults
Approximately 45.5% of females and 66.7% of males reported reduced food intake when experiencing sadness, and 25% of females and 18.2% of males reported increased food intake when experiencing happiness (Table 1).
Food consumption
Variations in food consumption during the four seasons are shown in Table 2. Variations in fruit and fat consumptions were significant in males as they consumed more fat in winter and more fruit in autumn compared to all other seasons (P < 0.05). While females did not show seasonal differences in fat and fruit consumption, they ate more eggs and bread in winter compared with other seasons (P < 0.05).
As shown in Table 3, daily energy intake was significantly different across seasons, decreasing from winter to spring and increasing from summer to autumn (P < 0.05). When compared to winter in summer, daily energy intake was found to be 577 kcal and 343 kcal lower in males and females, respectively (P < 0.05). Table 3 also shows nutrient intakes across seasons. There were significant variations in certain dietary nutrients in different seasons. In males, carbohydrate and sodium intakes were highest in winter, while they decreased in spring. Additionally, vegetable and protein intake were highest in winter, but lowest in autumn, while omega-3 fatty acid intake increased in winter but decreased in spring and n-6/n-3 ratio increased in summer and decreased in autumn (P < 0.05). In females, fiber intake was highest in winter but lowest in summer, sodium intake was increased in winter but decreased in spring, vitamin C, iron and zinc intakes were increased in spring but decreased in summer, cholesterol, retinol and niacin intakes were increased in autumn but decreased in summer and vitamin D intake was increased in autumn but decreased in spring (P < 0.05).
The percentages of respondents meeting daily energy and nutrient requirements are shown in Table 4. Dietary fiber intake in spring, vitamin B1 in spring and autumn, and magnesium
in spring, summer and autumn were below the recommended levels in male individuals. Vitamin B1 intake was insufficient in
summer among female individuals. For both sexes, calcium intakes were insufficient throughout each season.
Biochemical parameters
There were differences in biochemical parameters in old males and females (Table 5). Specifically, there was a significant increase in folic acid in males in winter (P < 0.05). In both sexes, mean serum PTH level increased in winter and spring, but decreased in summer and autumn, while vitamin D levels
increased in autumn (P < 0.05).
Changes in retinol level across seasons were not significant (P > 0.05). Plasma vitamin C levels in female individuals increased during spring (P < 0.05), but did not change significantly in males (P > 0.05).
In winter, retinol intake and plasma retinol levels were positively correlated in males (r: 0.621, P: 0.041), and vitamin C intake and plasma vitamin C levels showed a positive correlation in both sexes (P < 0.01) (Table 6).
DISCUSSION
Occurrence of physiological and psychological changes across seasons is well known. While younger adults easily adapt to seasonal changes, older adults may have difficulty in doing so, which makes them vulnerable to different stressors [12]. In this study, food consumption varied seasonally, and this was accompanied by alterations in energy and nutrient intakes as well as the blood levels of nutritional parameters.
Seasonal changes also impact emotional states and food consumption in all age groups [13]. In this study, most older adults who thought their emotional state affected their food consumption (45.5% of females, 66.7% of males) ate less under emotional distress, while during times of emotional happiness their well-being increased, as did their food intake (25.0% of females, 18.2% of males). This is an interesting finding as most studies have reported increased cortisol because of stress causes leptin resistance, leading to increased food consumption [14,15]. In addition to emotional changes, changes in food consumption depend on access to certain foods during different seasons [16,17]. In the present study, participants preferred consuming foods rich in fat and carbohydrates during winter, resulting in higher energy consumption. On the other hand, cultural background and knowledge as well as seasonal varia-tions in food availability can unintentionally influence preparation of meals by impacting the use of fat or carbohydrates.
Similar studies by Cai et al. [17] and Smolková et al. [18] reported a significant increase in fresh vegetable and fruit intake, which doubled in summer and autumn in comparison to winter in accordance with reports from other regions across the country. However, in the present study, fruit consumption only increased in autumn and decreased in spring in males. This may be related to, at least in part, increased availability of fresh fruit and vegetables throughout the year in the region, as well as their lower costs. Seasonal changes in food consump-tion in older adults also led to variaconsump-tions in their energy and nutrient intakes in this study. When compared to winter, females and males consumed 343 kcal/day and 577 kcal/day less energy, respectively, during summer, which was likely related to higher macro nutrients in winter. Intake of most nutrients was also higher in winter, but these differences were not significant. Moreover, the increases in some nutrients were found to be parallel to seasonal food consumption. The finding that energy and protein intake were reduced in summer and autumn should be investigated further to determine if there is a risk of under nutrition. Insufficient nutrient intakes were found in both genders, and two-thirds of male participants enrolled had insufficient fiber intake in spring compared to the
other seasons. Lower consumption of oilseed, legumes or fruits in spring might explain this. In males, insufficient magnesium intake was found during all seasons except winter (Table 3). Like many previous studies of elderly individuals [19,20], consumption of milk and dairy products was below the recommended levels in all seasons, potentially leading to insufficient intake in calcium and phosphorus. Because calcium, magnesium and vitamin D are important nutrients for healthy bones, our findings emphasize the need to increase awareness of sun exposure and to add more dairy products to the diets of older individuals. Moreover, reduced n-3 fatty acid intake in summer may occur to decreased availability of fish, which also deserves attention given that Turkey is a Mediterranean country. In the present study, the amount of salt consumption was not recorded. Rather, only the sodium content of food was calculated. For both sexes, sodium intake increased in winter (P < 0.05). In Turkey, bread is the main source of sodium according to the national food survey consumption. Therefore, increases in sodium may be explained by higher consumption of bread during winter.
Olmedilla et al. [21] and Rautalahti et al. [22] demonstrated that there were variations in blood parameters of some nutrients, vitamins and antioxidants in different seasons in adults. In a sample of Chinese people younger than 65 years of age, folate insufficiency was 48.0% in spring, but 26.2% in summer and autumn, and serum folic acid levels in males increased in winter but decreased in summer [23]. However, in the present study, consumption of any type of food was not found to be related to plasma folic acid level. Indeed, unless restored artificially, blood levels of fat soluble vitamins may not be determined by intake from natural sources such as legumes, oilseed, vegetables or meat.
Vitamin D deficiency is common in the elderly and related to chronic diseases such as diabetes, depression, etc. [24]. In the present study, serum PTH levels in winter and spring, as well as plasma vitamin D levels in spring were higher than in other seasons. Vitamin D levels were highest in autumn, which is in accordance with the results of previous studies across various population groups [24,25] because of the potential influence of temperature and sunlight. In the same region, vitamin D deficiency was previously found in 40.1% of nursing home residents and 24.4% of community dwelling older adults, most of whom had multiple chronic conditions [25]. None of the study participants were taking nutritional supplements before enrollment or during follow-up. As a result, we observed significant variations in plasma vitamin D levels over the 12-month period. Plasma retinol level increased in autumn when compared to other seasons, while variations in vitamin C level did not reach statistical significance. Nevertheless, total fruit and vegetable consumption strongly correlated with serum vitamin C level as in previous studies [5,6]. Moreover, because long term supplementation of vitamin E, vitamin C and β -carotene did not reduce mortality in a prospective study [26], seasonal variations in blood levels of vitamins and minerals may be adaptive and should not always be considered as illness. The best approach could be to encourage older adults to consume sufficient amounts of fresh fruits and vegetables during every season. The average amount of vegetables and
fruit consumed by individuals during the study met the daily vegetable and fruit consumption recommended by the WHO [27] for people 65 years or older (400 g/day). The percentage of the individuals consuming more than 400 grams of total fruits and vegetables was 38.7% in winter, 77.4% in spring, 64.5% in summer and 54.8% in autumn. These numbers suggest that older adults should be encouraged to increase their fruit and vegetable intake from autumn to winter.
In conclusion, energy and nutrient intake and blood levels varied across seasons in older adults. This study did not include nursing home residents or those who are not functionally independent. Also, older adults included in this study had better socio-economic status and eating conditions than the general Turkish society. However, even wider seasonal variations can occur in elderly with disabilities who have limited access to food. Future studies are required to evaluate the potential for improvements in care of older adults through modification of diets by nutritionists according to seasonal variations as well as periodical reviews of individual eating patterns, food sources and environmental factors.
ACKNOWLEDGEMENTS
We thank to Dr. Ahmet Taş and Dr. Mehmet Kayılı for helping the laboratory analyses.
CONFLICT OF INTEREST
The authors declare no potential conflicts of interests.
ORCID
Nesli Ersoy: https://orcid.org/0000-0003-0391-8848 İlker Taşçi: https://orcid.org/0000-0002-0936-2476 Taner Özgürtaş: https://orcid.org/0000-0003-1110-6671 Bekir Salih: https://orcid.org/0000-0002-8542-6531 Hüseyin Doruk: https://orcid.org/0000-0003-3534-2628 Neslişah Rakicioğlu: https://orcid.org/0000-0001-8763-7407
REFERENCES
1. World Health Organization. The global strategy and action plan on ageing and health [Internet]. Geneva: World Health Organization; [cited 2016 June 17]. Available from: http://www.who.int/ageing/ global-strategy/en/.
2. Woodhouse PR, Khaw KT, Plummer M, Foley A, Meade TW. Seasonal variations of plasma fibrinogen and factor VII activity in the elderly: winter infections and death from cardiovascular disease. Lancet 1994;343:435-9.
3. Capita R, Alonso-Calleja C. Differences in reported winter and summer dietary intakes in young adults in Spain. Int J Food Sci Nutr 2005;56:431-43.
4. Xiang J, Nagaya T, Huang XE, Kuriki K, Imaeda N, Tokudome Y, Sato J, Fujiwara N, Maki S, Tokudome S. Sex and seasonal variations of plasma retinol, alpha-tocopherol, and carotenoid concentrations in Japanese dietitians. Asian Pac J Cancer Prev 2008;9:413-6. 5. Shahar DR, Froom P, Harari G, Yerushalmi N, Lubin F, Kristal-Boneh
E. Changes in dietary intake account for seasonal changes in
cardiovascular disease risk factors. Eur J Clin Nutr 1999;53:395-400. 6. Moreira PL, Villas Boas PJ, Ferreira AL. Association between oxidative
stress and nutritional status in the elderly. Rev Assoc Med Bras (1992) 2014;60:75-83.
7. Hacettepe University (TR). The Dietary Guidelines of Turkey. Ankara: Hacettepe University; 2015 July.
8. Talwar D, Ha TK, Cooney J, Brownlee C, O'Reilly DS. A routine method for the simultaneous measurement of retinol, alpha- tocopherol and five carotenoids in human plasma by reverse phase HPLC. Clin Chim Acta 1998;270:85-100.
9. Brunetto MR, Obando MA, Gallignani M, Alarcón OM, Nieto E, Salinas R, Burguera JL, Burguera M. HPLC determination of Vitamin D3 and its metabolite in human plasma with on-line sample cleanup. Talanta 2004;64:1364-70.
10. Wang S, Schram IM, Sund RB. Determination of plasma ascorbic acid by HPLC: method and stability studies. Eur J Pharm Sci 1995;3:231-9.
11. Quinlivan EP, Hanson AD, Gregory JF. The analysis of folate and its metabolic precursors in biological samples. Anal Biochem 2006;348:163-84.
12. van Ooijen AM, van Marken Lichtenbelt WD, van Steenhoven AA, Westerterp KR. Seasonal changes in metabolic and temperature responses to cold air in humans. Physiol Behav 2004;82:545-53. 13. Penckofer S, Kouba J, Byrn M, Estwing Ferrans C. Vitamin D and
depression: where is all the sunshine? Issues Ment Health Nurs 2010;31:385-93.
14. O'Connor DB, O'Connor RC. Perceived changes in food intake in response to stress: the role of conscientiousness. Stress Health 2004;20:279-91.
15. Michels N, Sioen I, Ruige J, De Henauw S. Children's psychosocial stress and emotional eating: a role for leptin? Int J Eat Disord 2017;50:471-80.
16. Frankenfeld CL, Lampe JW, Shannon J, Gao DL, Li W, Ray RM, Chen C, King IB, Thomas DB. Fruit and vegetable intakes in relation to plasma nutrient concentrations in women in Shanghai, China. Public Health Nutr 2012;15:167-75.
17. Cai H, Shu XO, Hebert JR, Jin F, Yang G, Liu DK, Gao YT, Zheng W. Variation in nutrient intakes among women in Shanghai, China. Eur J Clin Nutr 2004;58:1604-11.
18. Smolková B, Dusinská M, Raslová K, McNeill G, Spustová V, Blazícek P, Horská A, Collins A. Seasonal changes in markers of oxidative damage to lipids and DNA; correlations with seasonal variation in diet. Mutat Res 2004;551:135-44.
19. Volkert D, Kreuel K, Heseker H, Stehle P. Energy and nutrient intake of young-old, old-old and very-old elderly in Germany. Eur J Clin Nutr 2004;58:1190-200.
20. Gilbride JA, Amella EJ, Breines EB, Mariano C, Mezey M. Nutrition and health status assessment of community-residing elderly in New York City: a pilot study. J Am Diet Assoc 1998;98:554-8. 21. Olmedilla B, Granado F, Blanco I, Rojas-Hidalgo E. Seasonal and
sex-related variations in six serum carotenoids, retinol, and alpha-tocopherol. Am J Clin Nutr 1994;60:106-10.
22. Rautalahti M, Albanes D, Haukka J, Roos E, Gref CG, Virtamo J. Seasonal variation of serum concentrations of beta-carotene and alpha-tocopherol. Am J Clin Nutr 1993;57:551-6.
23. Hao L, Tian Y, Zhang F, Zhong X, Zhang B, Tan M, Tang Y, Li Z. Variation of plasma folate levels in adults between some areas and different seasons in China. Zhonghua Yu Fang Yi Xue Za Zhi
2002;36:308-10.
24. Rosecrans R, Dohnal JC. Seasonal vitamin D changes and the impact on health risk assessment. Clin Biochem 2014;47:670-2.
25. Atli T, Gullu S, Uysal AR, Erdogan G. The prevalence of vitamin D deficiency and effects of ultraviolet light on vitamin D levels in elderly Turkish population. Arch Gerontol Geriatr 2005;40:53-60. 26. Heart Protection Study Collaborative Group. MRC/BHF Heart
Protection Study of antioxidant vitamin supplementation in 20,536
high-risk individuals: a randomised placebo-controlled trial. Lancet 2002;360:23-33.
27. World Health Organization. Increasing fruit and vegetable consu-mption to reduce the risk of noncommunicable diseases [Internet]. Geneva: World Health Organization; 2014 [cited 2016 June 17]. Available from: http://www.who.int/elena/titles/fruit_vegetables_ ncds/en/.