Araştırma Makalesi / Research Article
Customer Behavior Analysis by Association Rules Mining
G. Nilay YÜCENUR
*, Yeşim YAYGAN, Hilal TEVGE, Gökçe DEMİR
Beykent Üniversitesi, Mühendislik-Mimarlık Fakültesi, Endüstri Mühendisliği Bölümü, İstanbul, Türkiye (ORCID: 0000-0002-2670-6277) (ORCID: 0000-0002-5082-8119)
(ORCID: 0000-0001-9605-1723) (ORCID: 0000-0002-0264-4980)
Abstract
Emerging technology and the accompanying globalization further strengthen the conditions of competition. At this point, the concept of “difference making-innovation” has become one of the important concepts in today's world. Diversifying businesses can quickly adapt to this development process and take up its place in the development / growth cycle. To making a difference in terms of businesses means to be able to adapt quickly to developing management understanding and to reflect this difference in their business processes. In this paper, we are looking for an answer to two important questions for a retail firm that serves in textile sector in İstanbul/Turkey. Our retail firm has 56 different sales points throughout Istanbul. 18 of them are in the Anatolia and 38 of them are in the European side of İstanbul. The firm produces and sells textile products with different price ranges and different specifications. According to the sales habits of the customers, what products should be sold in the product range of the company and which products should be sold in two branches that we decided? In our study, we have proposed a model that explains customer behavior and makes forward-looking forecasts with the Data Mining application used in Customer Relationship Management to find out the answers to these questions. The model was evaluated by Association Rules Mining (ARM) based on past sales slips, the results were obtained and future estimates were made. The purpose in the association rule; to find the relationships between the products purchased by customers during shopping, and to determine the buying habits of customers in line with this relationship data. Also in this paper the tourism effects are tried to be examined because there are two different branches. One of them has national customers but the other one has more foreign customers. Keywords: Data mining, customer behavior, association rules mining, retail stores.
Birliktelik Kuralları ile Müşteri Davranışlarının Analizi
ÖzetGelişen teknoloji ve beraberindeki küreselleşme rekabet koşullarını daha da güçleştirmekte bu noktada “fark yaratan inovasyon” günümüz dünyasında önemli kavramlardan biri haline gelmektedir. Bu sürece hızla adapte olabilen işletmeler gelişim/büyüme döngüsü içerisinde yer almakta ve fark yaratabilmektedirler. İşletmeler açısından fark yaratmak, hızla gelişen yönetim anlayışına uyum sağlayabilmek ve bu anlayışı iş süreçlerine yansıtmak anlamına gelmektedir. Buradan hareketle bu makalede, İstanbul/Türkiye'de tekstil sektöründe hizmet veren bir perakende firmasının rekabet koşullarında fark yaratabilmesi için iki önemli sorunun cevabı aranmaktadır. İncelenen firma 18 tanesi İstanbul’un Anadolu yakasında ve 38 tanesi ise İstanbul’un Avrupa yakasında olmak üzere toplam 56 farklı satış noktasına sahiptir. Farklı fiyat aralıklarında ve farklı özelliklerde tekstil ürünleri üretip satmakta olan firma müşterilerinin satış alışkanlıklarına göre, ürün yelpazesinde hangi ürünlerin bulunması gerektiğine ve bu ürünlerin hangi satış noktalarında satılması gerektiğine karar vermeye çalışmaktadır. Makalede, müşteri davranışlarını açıklayabilmek ve bu soruların cevaplarını bulabilmek için Müşteri İlişkileri Yönetimi'nde kullanılan Veri Madenciliği uygulaması ile ileriye dönük tahminler yapan bir model önerilmiştir. Modelde, müşterilerin satın alma alışkanlıklarının açıklanabilmesi için geriye dönük satış fişleri Birliktelik Kuralları Analizi yöntemi ile değerlendirilmiş, elde edilen sonuçların detaylı olarak incelenmesi ile gelecek tahminleri yapılmış ve hangi ürün gruplarının hangi şubelerde satışa çıkarılması gerektiği ortaya konmuştur. Çünkü birliktelik kuralındaki amaç alışveriş sırasında müşterilerin satın aldığı ürünler arasındaki ilişkileri bulmak ve bu ilişki verileri doğrultusunda müşterilerin satın alma alışkanlıklarını belirlemektir. Çalışmada ayrıca iki farklı satış şubesi olduğundan satışlar üzerindeki turizm etkileri de incelenmeye
The data produced by computer systems are not worth it alone, because they do not make sense viewed with the naked eye. This data is meaningful when it is processed for a certain purpose. Therefore, it is important to be able to use techniques that can manage large amounts of data. The patterns and trends that are hidden in datasets are discovered by data mining process and this process is widely used in Customer Relationship Management. Customer Relationship Management practices have been developed to enable companies to improve their relationships with existing customers, gain new customers and retain all customers. The purpose of Data Mining applications used in Customer Relationship Management is to set up models to explain customer behaviors and make forecasts for the future.
Since the estimation of the behavior of customers is a very important issue, many researches have been carried out on the subject from the past to present. Therefore, in literature there are many studies about data mining and association rules mining which is one of the techniques analyzing customer behavior. For example, Caniato et al. (2005) clustered customers to forecast demand, Chang, Hung and Ho (2007) used clustering analysis and ARM with a model for analyzing potential customers’ purchasing behavior, Sohn and Kim (2008) used clustering and quantitative association rule for searching mobile service’s customer patterns, Tsai and Chen (2010) selected variable by association rules in multimedia sector, Chiang (2011) used the same method with an improved model with customer values, Soysal (2015) used ARM with mostly associated sequential patterns, an efficient approach for mining association rules were proposed by Sahoo et al. (2015) from high utility item sets, Joo, Bang and Park (2016) implemented a recommendation system using association rules and collaborative filtering, the changing trends of market data was identified by Kaur and Kang (2016) by using ARM, Lee et al. (2016) discovered relationships between factors of round-trip car sharing by using ARM, Liao and Chang (2016) used an approach about rough set-based association rule for a recommendation system for online customers and Najafabadi et al. (2017) used clustering and association rules for improving the accuracy of collaborative filtering recommendations [1-12].
The association rules mining which is one of the first techniques used in data mining was first introduced by Agarwal, Imielinski and Swami in 1993 [13-14]. The method that analyzes the co-occurrence of events sets out the rules of co-co-occurrence with certain possibilities. Association rules are an approach that analyzing the past data and determining and predicting the behavior of customers in the future according to these past data. The purpose of the method is to find the association relationship between the products purchased by customers during shopping and to determine the purchasing habits of the customers in line with this relationship data. Thus, the sellers can have the opportunity of effective and profitable marketing and sales thanks to these association relations and habits [15-17]. Some algorithms used for Association Rules Mining: Apriori, Carma, Sequence, GRI, Eclat, FP-Growth and others. In this study, Apriori algorithm was used for needed evaluations and analysis [18-22].
This study, which examines customer relations through the clustering analysis method in retail management, proposes a model that examines customer behavior in terms of location, price and customers’ nationality. The sales slips for the last 3 years are used in the analysis.
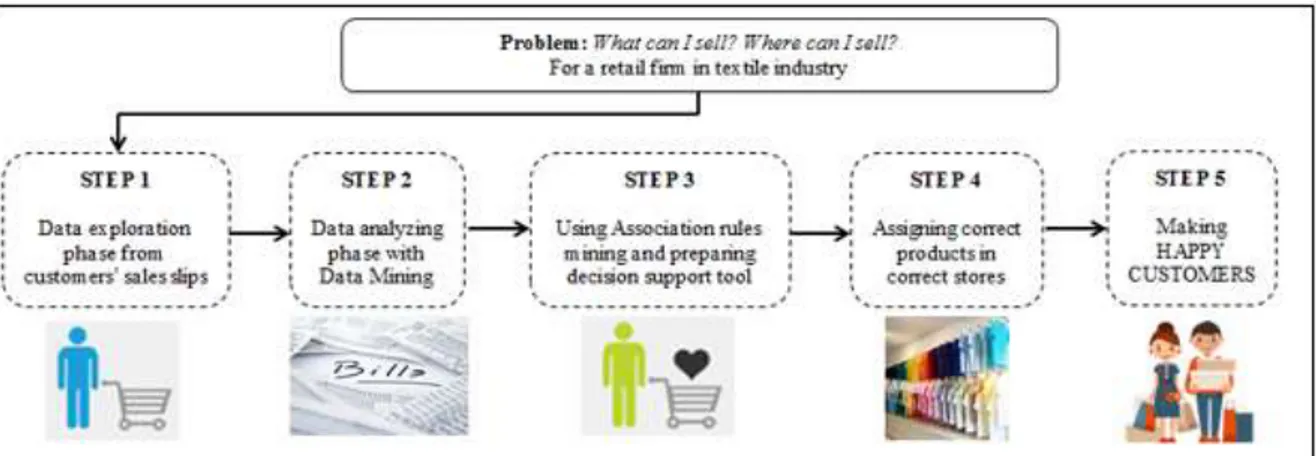
In this study, ARM is used to examine customers’ behavior and decide to what the firm sells and in which branch they sell these identified products. Briefly, after all literature review there are two main objectives:
Analyzing customer behavior for our textile retail firm Answering two main questions:
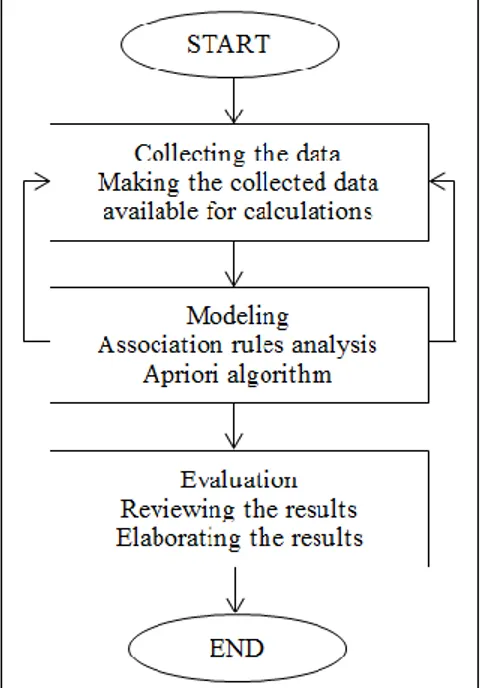
o Which products in the product range are in demand? o Which products should be sold in which two branches? In Figure 1, research model and solution steps can be seen.
Figure 1. Research model and solution steps
As an outline, in Section 2 the definition of the retailing sector has been made, the functions of retailing are given, according to these functions, the retailing is divided into various types, and the applications of retailing in the World and Turkey are mentioned. The concept of Data Mining is discussed in Section 3, the application steps, fields, models and methods of data mining are examined, the algorithms used for analysis of association rules and the calculation methods of ARM are explained in detail. Section 4 is an application part. We analysis sales slips data of our retail firm for determining which products are requested more for the two selected sales branches and trying to decide which products should be sold in which branch. In the conclusion section, the research findings were evaluated and suggestions were made about how the research results could be used in the business science and retail sector. Finally, the proposal for the planning of future researches is given. 2. Functions and Classifications of Retail Stores
People with limited skills and unlimited desires always need for shopping. Especially with the increasing urbanization process from an agriculture society, shopping was not only a mechanical phenomenon; it has become a part of social life. Until a finished product reaches the final customer, it has transportation, storage, wholesaling and retailing steps. The last people who enter into a personal relationship with the costumer within these steps are retailers. Retailers combine the needs of their customers with the services they provide.
Most people think retailing is only about selling products at the store but retailing can be staying at the hotel, going to the hairdressing, going to the hospital. It also includes activities such as ordering pizza to home.
Retail includes all marketing activities on the distribution channel of products and services. For this reason, marketing and retailing should be considered as a whole.
The utility and level of retailing depends on economic systems and development levels. Retailing is explained by four utility concepts in the economy. These concepts are convenient locating benefit (retailing should be done in close to customer), time benefit (retailer has to supply the desired products at the desired time), property benefit (retailer provides property benefits by selling credits to customers) and figure benefit (some changes in the shapes of the sold goods affect sales) [23].
Retailers are intermediaries that provide connections between producers and customers. All the units from the producer to the wholesaler, from the distributor to the retailer are retailing. In general, retailing characterizes the activities of the all units from producers to customers. In narrow sense retailing is the last stage such as grocery store, supermarket, chain store, etc. in which the product is delivered to the final customer.
In retailing sector, the right place should be chosen, product range should be available, credit and installment opportunities should be available and large batches should be separated into
wholesaler. There are forms of sales at home, by letters and e-mails. Home sales are the oldest method of retail sales in Turkey [23; 26]. With a vast majority of goods and services sold through stores, non-retail retailing grows much faster than store retailing (door to door sales, vending machine sales, direct marketing, telephone marketing, television marketing, e-commerce, etc.)
Retail associations: It is a type of retailing that is formed by various organizations that combine wholesale and retail functions in the distribution channels of integrated retailing with the aim of coordinating without financial autonomy of each institution (chain stores, cooperative stores, franchising stores, etc.).
2.1. Retail Stores in the World and in Turkey
Retailing is affected from the rapid technological development process in recent years all over the World. Contemporary retailing was begun between 1954 and 1957 and “Customer focused sales” concept has become important. In the United States, who is the center of the retailing industry, supermarkets that started to operate in the 1930s showed a rapid development process the 1950s. In 1950s as in the United States the increase in immigration in large metropolises also affects the number of employees and core families in Europe. Their shopping habits and consumption patterns have changed. As a result of these developments there have been changes in retail sales points. In Europe, France, the first country to enter the large-scale distribution event, has come to a certain degree in retailing activities. Germany has developed its retailing activities due to the impact of globalization. In the 1980s, in Europe, the strongest country is England in retailing activities with its chain stores.
On the other hand, in Turkey, at the beginning of the 1980s and in the 1990s very important developments were observed in the retail sector. Retailing and merchandising have also developed in Turkey due to the economic and social developments in recent years. Especially, there have been significant changes in the retail industry in the last twenty years. The growing trend of urbanization, the increase in the average life span, the increase in the participation rate of women in business, the changes in consumption habits and consumer expectations are the reasons of development of self-service methods in consumption centers, supermarkets, and discount store types all over the country [27].
When the state of the retail sector in Turkey in recent years examined, the highest increase in 2017 compared to 2016 is in automotive fuel (21.7%) trade sub-category, the least increase is in the electrical goods and furniture sector (2.4%). This result shows in 2017 that automotive fuel and electrical goods/furniture sectors are the most dynamic and stationary sectors in terms of both sales volume and turnover in retail trade, respectively [28]. The latest published data show that the retail trade industry grows at an average level of 10% each year in our country. This growth rate is upper than our country’s growth rate approximately 2-3 times. With these rates, positive contribution of the retail sector to the Turkish economy is felt in the area. In order to make the growth in the retail sector more sustainable and reliable, the sector it needs to respond quickly and in a coordinated manner to changing consumer demands [29-31].
3. Data Mining in Knowledge Discovery
Satellite data, medical data, shopping data, automation data and more the amount of data obtained in many areas is increased rapidly [32]. These data collection and storage are also a problem and these
problems have been tried to be solved with file systems and databases [33]. Especially in the area of databases with the cheaper computer hardware developments are very important solutions for these problems. Today, the amount of data arriving continues to grow at an extraordinary pace every day in a very short time. However, often only a small portion of the collected data is used. If the data’s size is so large it cannot be analyzed without any mechanism and cannot be used in any decision support system.
Often, if they are not used well, the data stored in the databases becomes a problem. So the collected data’s amount and the data’s complexity are increased, the need for better analysis techniques is increased. At this point, Data Mining and Knowledge Discovery in Databases concepts have emerged.
The process of data mining is about meaningful relationships and pattern extraction from the data. With data analysis, estimates of sales for the next month for a product can be done, customers can be grouped according to the goods they bought, potential customers can be identified for a new product and customers’ behaviors can be estimated by examining movements of customers over time. The two most important characteristics of data mining are that they are kept in the data warehouse in a very large amount and meaningful information is obtained from these data [4].
Data mining is briefly the discovery period of confidential information. Each stage of the data mining process should be monitored carefully. The end of one stage is the beginning of another stage. Because of this reason each stage depends on the result of the previous stage.
3.1. Data Mining’s Application Fields and Steps
The data mining process can become very complicated very quickly. For this reason, there is a standard process for data mining. This standard process has been determined by a consortium. The Cross-Industry Standard Process for Data Mining (CRISP-DM) consortium was founded by three companies in a young and immature data mining market towards the end of 1996. Daimler Chrysler (formerly Daimler-Benz) that the first one of these three companies has been the pioneer to the many industrial and commercial organizations for applying data mining techniques. SPSS that is the second company has provided various services on data mining since 1990. NCR, the third company, has established many data mining consultancy and technology expertise teams for serving the needs to their customers and providing value to the customers. CRISP-DM data mining process (DMP) consists of six stages [34; 35]. In Fig. 2 these six stages can be seen.
Problem definition: It is the most important phase of DMP. The first condition for success in data mining operations is to specify the purpose of the application. The relevant business objective should be focused on the problem and must be expressed clearly.
Data exploration: It is very important phase because the problems that will arise during the establishment of the model will lead to the return to this stage later.
Data preparation: Collecting the data, combining, clearing and converting the data are steps of data preparation. In the data mining model building process, the first step of preparing the data is the collection of the data. The pre-determination of the resources that the data is collected from and with the reliability of these resources considerably reduce the risk of encountering problems in the future.
Modelling: In order to get the most efficiency from the information sources in the data mining, the stage of establishment of the model is very important. A well-established model will also affect the quality of the results obtained from analysis. A good data mining practitioner should be able to predict what patterns will be found in the analysis result. If the model is not set up correctly, critical relationships that can be found in the data set cannot be presented correctly and no significant patterns can be detected.
Evaluation: The evaluation the model is made by data mining experts. If they do not like the model and the model do not meet the expectations of them, they go back and rebuild the model.
Deployment: The last phase of DPM is the use of established and validated models. This can be a direct application or a sub-part of another model can be used.
Figure 2. CRISP-DM data mining process [36]
Data mining is an interdisciplinary approach that encompasses many aspects. Although it is a new discipline, the field of its application is quite broad. Today, all businesses want to predict the behavior of their customers [37]. Data mining is a technique that can be used for this purpose. For this reason, data mining is currently used in a variety of marketing, retail, banking and finance, transportation, telecommunication, medical and other fields. For example, Liao et al. (2009) used data mining approach for sport marketing [38]. On the other hand, Şener et al. (2019) and Chen et al. (2006) used a data mining approach for retail knowledge discoveries [39-40]. While Zhang et al. (2013) and Louw and Marais (2018) applied data mining approach to finance sector, Gürbüz and Turna (2018) and Wang et al. (2017) used the same method to transportation analysis [41-44]. Keramati et al. (2014) and Mahendrawathi et al. (2015) mined the processes in telecommunication sector and Ricciardi et al. (2020) and Lara et al. (2014) applied data mining to medical sector [45-48]. Fırat et al. (2013) classified of sediment amount and concentration with non-hierarchical clustering method [49].
3.2. Models and Methods of Data Mining
Models used in data mining are examined under two main headings as predictive and descriptive [50]. In predictive models, it is aimed to develop a model by moving the results from the known data and to estimate the result values for data clusters whose results are unknown by using this established model. In descriptive models, it is possible to identify patterns in existing statements that can be used to guide decision making.
There are other models besides these models in various researches. Classification and regression, clustering, ARM and sequential timing patterns, estimation based decision making, separation, exceptions (difference identification), text mining, web mining are some of these.
Methods used in data mining models in the literature can be examined under such topics as decision trees, artificial neural networks, genetic algorithms, k-nearest neighbors, memory based methods, traditional query tools, visual methods, slang analysis and evolutionary analysis [51]. For example, Han et al. (2019) studied on the Test Data Fault Mining Technology Based on Decision Tree, Czajkowski and Kretowski (2019) used Decision tree for underfitting in mining of gene expression data, Zhang et al. (2020) developed a novel artificial intelligence model to estimate the capital cost of mining projects using deep neural network-based ant colony optimization algorithm, Saplıoğlu and Acar (2020) detected the sediment transport with using artificial intelligence models formed with using k-means clustering algorithm, Guo et al. (2019) forecasted mining capital cost for open-pit mining projects based on artificial neural network approach, Carvalho and Freitas (2004) used a hybrid decision tree/genetic algorithm method for data mining, Gong et al. (2020) introduced a new evidential clustering algorithm based on finding the “cumulative belief peaks” and evidential K-nearest neighbor rule, Ltifi et al. (2016) used enhanced visual data mining process for dynamic decision-making [52-59].
3.3. ARM and Its General Definitions
Association rules are one of the important techniques of data mining. These rules used to discover multiple independent elements. One of the best known applications of ARM is the market basket analysis. A market basket involves the purchases of customers [60]. These items or item sets are purchased by a customer in a single transaction. ARM can be used to examine the asset sets when the customer's purchases or the number of items bought by the customer are too large. So that customers can find out which products they tend to buy together [4].
The mathematical model of the association rule was presented by Agrawal, Imielinski and Swami in 1993. The general definitions of the rules of association are as follows:
I = {i1, i2, …, im} is a set of items. These items are given in DB. A set of transactions are
contained by DB. Each T transaction is a set of items such that T ⊆ I. A set of purchased items is X. A transaction T is said to contain X if and only if X ⊆ T. X Y represents an association rule. In this rule
X ⊆ I, Y ⊆ I and X ∩ Y = Ø. The transaction set DB includes X Y rule with confidence c. X as well as
Y are contained by c %. In the transaction set s has been supported by X Y rule if s % of the transactions in DB contains X Y. The strength of the rule is confidence [52, 61].
Association rules find association relationships between large data sets. For example, when buying a product, buying another product is a rule of association. Association rules are often used for marketing and promotion purposes in retail stores. As the data collected and stored grow day by day, companies want to reveal the rules of association in their databases. Exploring interesting association relationships from large volumes of professional transaction records make the companies decision making more efficient. Association mining analyzes the customers' purchasing habits by finding the togetherness between the products in their shopping basket. The discovery of such association reveals the knowledge of customers which products they buy together, and market managers can develop more effective sales strategies in the light of this information [40, 50].
To find the rules of association, the problem is usually divided into two parts. Firstly, the frequently repeated items are found first. Then strong association rules are created from frequently repeated items. These rules must meet minimum support and minimum trust values. The method provides better information to gain an edge over the competition, and is a powerful tool in providing the information necessary for the business to understand itself, the customer and the market. The ability to quickly organize and analyze big data increases workplace efficiency and provides flexibility in using data. Besides the advantages of the method, it also has disadvantages: The method finds useful predictions, but it has no definitive answer. It is a costly, complex and long project. It takes a long time to get efficiency from applications [22].
4. The Application of ARM for a Retail Store Firm with Sales Slips
In this paper, we use ARM and clustering analysis model from data mining. This section provides information on these two analytical techniques and our application. With these two techniques used, it is possible to find the rules related to the sales that we collect through the sales departments of the textile company (shopping details: receipt no, receipt date, hour, received products, etc.) and with this information the intersegmental categorization, exhibition alternatives in stores, etc. will be provided.
Our sample company which is examined in this paper started its operations in 1952 and made its first export in 1956 with the aim of becoming a brand known to in the world with Turkish fabric. Our sample company, which was the first textile firm that awarded with the ISO 9001 Quality Certificate in 1992, is today one of the world's five largest integrated facilities in the production of woolen cloth. Nowadays, it responds to different trends and different lifestyles in fashion with a wide range of collections.
In calculations in this section, there are 2 stores of our textile company which is engaged in retail sales are used for analysis one of them is İstinye Park store in European side of İstanbul and the other one is Nautilus store in Anatolia side of İstanbul. Fig. 3 shows the locations of the stores on Istanbul map.
When the sales data of the firm is analyzed, it is seen that 60% of the customers in İstinye Park store and 3% of the customers in Nautilus store are tourists who visit Istanbul.
Figure 3. The location of two stores on İstanbul map 4.1. The Structure of Model
This study was carried out by following the reference model CRISP-DM, which is a guiding process in data mining practice and used as a standard in most data mining applications. Using the CRISP-DM reference model, this research will also describe the problem assessment and examination of the data, the preparation of the data, and the modeling phases [62].
Market basket analysis will be carried out using the Apriori algorithm in the data obtained from the operation. At the same time, hierarchical clustering analyzes will be applied to determine the clusters that are formed during the sale of product categories. In Fig. 4, the basic flow chart of the article is shown.
Figure 4. The basic flow chart of the article
The name of the Apriori Algorithm is Apriori, meaning "prior", as it receives the information from the previous step. This algorithm has a repetitive nature at its core and is used to discover the most frequent sets of items in databases containing motion information. According to the Apriori algorithm, if the set of items with k elements provides the minimum support value, the subsets of this set also provide the minimum support criteria. The Apriori Algorithm, used for the first stage of the association rule, is the most popular and classic algorithm used in the mining of common items. In this algorithm, properties and data are evaluated by Boolean relationship rules [18, 22].
The method is more preferred than other algorithms since it has wide data preview and modeling techniques.
4.1.1. Data description
Three years of store sales information for İstinye Park and Nautilus stores from 2014 to 2016 were obtained. Purchase order data are consisted of shopping details, such as date, receipt number, product group code, product sales. In Table 1 the product groups are shown which are used in the store. There are a total of 44 products in 7 product groups in both stores.
Table 1. Product groups used in the store.
4.1.2. Data preprocessing
One of the most important problems about data is this data not fully available to use in data mining software. Shopping details are displayed line by line in Microsoft Excel software. In Fig. 5 original shopping details are shown.
Figure 5. Original shopping details
But in terms of data mining software analysis, it is necessary to quantify whether there is a sale for each product in a single development. In order to solve this problem, Microsoft Excel application has been adapted to the desired form by using the pivot structure. As a result of this process, the number of the plug of a shopping and the information of which categories of products are taken and the information of which category is not taken are collected in one row. In Fig. 6 shows the shopping details which were converted to Excel Pivot.
Figure 6. Shopping details converted to Excel Pivot 4.1.3. Records aggregation
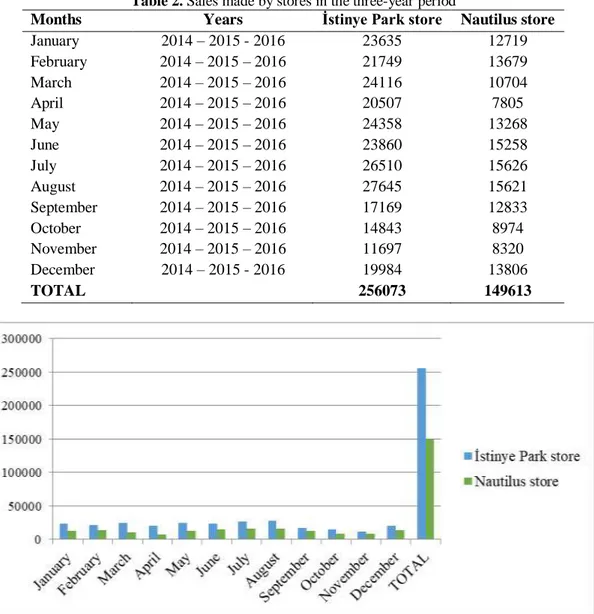
In Table 2 and in Fig. 7 the amount of sales movements of İstinye Park store and Nautilus stores according to the month from 2014 to 2016 can be seen.
Table 2. Sales made by stores in the three-year period
Months Years İstinye Park store Nautilus store
January 2014 – 2015 - 2016 23635 12719 February 2014 – 2015 – 2016 21749 13679 March 2014 – 2015 – 2016 24116 10704 April 2014 – 2015 – 2016 20507 7805 May 2014 – 2015 – 2016 24358 13268 June 2014 – 2015 – 2016 23860 15258 July 2014 – 2015 – 2016 26510 15626 August 2014 – 2015 – 2016 27645 15621 September 2014 – 2015 – 2016 17169 12833 October 2014 – 2015 – 2016 14843 8974 November 2014 – 2015 – 2016 11697 8320 December 2014 – 2015 - 2016 19984 13806 TOTAL 256073 149613
The data obtained are grouped according to the monthly sales in which the stores. It is seen that a total of 256,073 shopping movements were made for İstinye Park store in the analysis which was made; also for Nautilus store; 149,613 shopping movements were observed. When we examine the amount of movement in stores according to the months, for İstinye Park store the lowest sale was made in November is and highest sale was made in August. When we have examined for the Nautilus store; we can say that the sales movements have the highest density in July and the lowest in April. Therefore, it is seen that the sales increase in the summer season, when the tourist density is high in İstanbul.
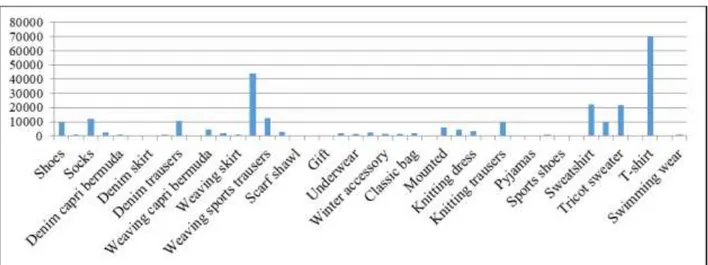
In the İstinye Park store, preferred product categories are grouped according to the category regulation system used by the operator and this grouping is shown in Fig. 8. In the case of transferring the histogram, all sales movements’ data taken from receipts of İstinye Park store were taken from Table 3.
Figure 8. Number of movements according to category in İstinye Park store Table 3. Number of movements according to category in two stores in three years period
İstinye Park Nautilus İstinye Park Nautilus
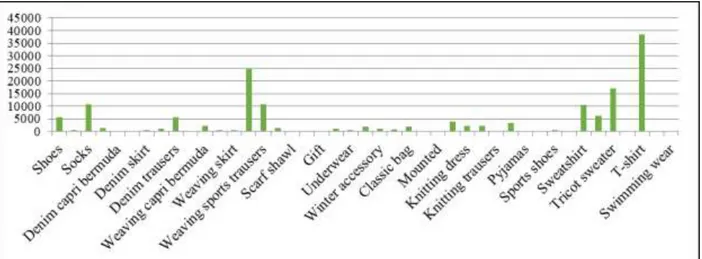
Shoes 10179 5697 Denim capri bermuda 728 285
Jacket 798 397 Weaving capri bermuda 4559 2295
Socks 12006 10738 Weaving sports trousers 12403 10695
Wallet 2408 1295 Knitting capri bermuda 4388 3850
Denim dress 482 234 Weaving dress 1856 462
Denim skirt 332 523 Weaving skirt 666 635
Denim shirt 1060 1037 Weaving shirt 44042 24941
Denim trousers 10506 5632 Underwear 1294 547
Leather coat 394 101 Coat 2416 1842
Weaving vest 3127 1286 Winter accessory 1168 1021
Scarf shawl 538 240 Belt 1248 800
Towel 273 195 Classic bag 2108 1860
Gift 237 170 Necktie 101 80
Cardigan 2132 1216 Mounted 5843 22
Knitting dress 3322 2232 Hat 733 211
Knitting skirt 125 2159 Sports shoes 301 593
Knitting trousers 9982 118 Sports bag 175 97
Overcoat 602 3369 Sweatshirt 22020 10540
Pyjamas 71 52 Tricot cardigan 9679 6219
T-shirt 70287 38291 Tricot sweater 21742 16964
Suitcase 242 224 Tricot vest 21 14
Figure 9. Number of movements according to category in Nautilus store 4.1.4. Mapping
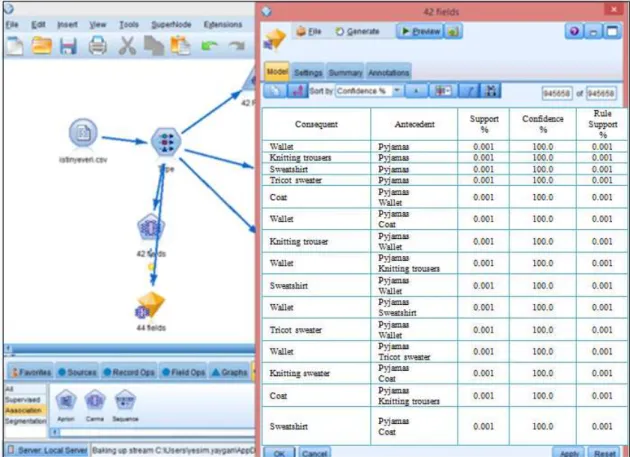
Apriori model was used in SPSS MODELER software to determine the association rules. The Apriori model extracts rules with the highest information content from a data set [63]. Support-generality and confidence-accuracy values are calculated when information content is found. In the general literature, support indicates the probability of co-existence of products, while confidence value indicates how many of the records containing the first product contains the second product. However, the support value obtained in the SPSS Clementine program indicates the percentage of total inclusion in the data set, the congestion type records that contain the confidence value precursor type, the rule support value indicates the percentage of coexistence of the two species. In other words, the concept of support in the literature is used as a rule support here. The definitions of the SPSS Clementine program were taken into account when assessing the tables. In the analysis, all category types will be examined first, then the categories will be examined on their own once a general view is obtained. In Fig. 10 and in Fig. 11 graphs show sales relationships between categories in İstinye Park store and Nautilus store, respectively.
Figure 11. Graph showing sales relationships between categories in Nautilus store
When we examined the products that were most common for İstinye Park and Nautilus stores Fig. 12, Fig. 13(a) and Fig. 13(b) are obtained. Since two basic relationships can be established between products in the Nautilus store, all relationships are shown in Figure 13 (a) and (b).
Figure 12. Most common products in İstinye Park store
Figure 13(b). Most common products in Nautilus store
When the table which is shown in Fig. 14 is examined, it is seen that the largest rule support is 6.13% for t-shirt ➔and in the weaving shirt in İstinye Park store. That is to say, about 6% of the receipts contain t-shirt with weaving shirt categories. Approximately 23% of customers who received t-shirt also receive a weaving shirt category, while 19% of customers who received weaving shirt category also receive t-shirt. And then, weaving shirts and sweatshirts are following that. T-shirt, weaving shirts and tricot sweater groups are the products that have large logos for tourist customers.
Figure 14. Results of Apriori Model applied to categorical (sorted by rule support) in İstinye Park store Support value becomes important when making an assessment. So in the table that is below is the sort of analysis results sorted by support value. Even though the confidence value is high, the rule support (called as the total among the receipts) is low, so same relations are not included in the table can be examined in this way. The new graph can be seen in Fig. 15 for İstinye Park store.
Figure 15. Detailed results of Apriori Model applied to categorical (sorted by rule confidence) in İstinye Park store
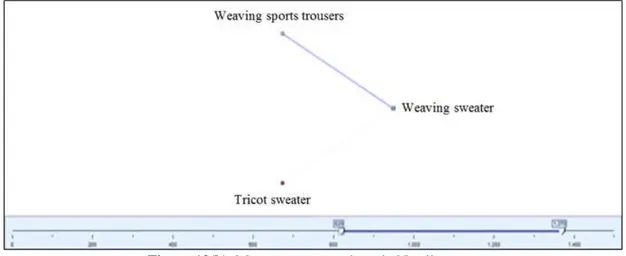
When the table is examined which is shown in Fig. 15, it is seen that the highest confidence value is 100% between the wallet and the pyjamas. The customers who buy wallet also get products from the nearest pyjamas category. This result is found in about 1% of the receipts.
When we examine the results for Nautilus store, results of Apriori Model applied to categorical in Nautilus store can be seen in Fig. 16.
When the table is examined which is seen Fig. 16, it is seen that the largest rule support is 2.681% for the t-shirt ➔and weaving shirt. So, about 2.7% of the receipts are covered with t-shirt and weaving shirt categories. Approximately 12% of the customers who receive t-shirt also received a weaving shirt category, while 10% of the customers who received weaving shirt category also receive products from the t-shirt category. This is followed by a weaving shirt and sportswear.
In Fig. 17 there are detailed results of Apriori Model applied to categorical for Nautilus store. When the table which can be seen in Fig. 17 is examined, it is seen that the highest confidence value is between 100% and Socks ➔ pajama. The customers who buy socks take products from the nearest pyjamas category. This deflection is found in about 1% of the receipts. There is a similar situation in the other data.
Figure 16. Results of Apriori Model applied to categorical (sorted by rule support) in Nautilus store
4.2. The Analysis of Binary Sales’ Relationships in Product Categories
After the chi-square test is performed, the value of interest is calculated. 1 are complementary effects between X and Y, interest values below 1 are substitutable (interim) between X and Y. If the value of interest is 1 or very close to 1, it indicates situational independence between X and Y.
Whether the figures obtained through sampling is compatible with the population figures; In other words, it is determined by chi-square test whether the values observed comply with the expected values. The method allows testing whether one categorical variable is related to another [64]. In this study, the relationship data between the products obtained by chi square test are shown in Fig. 18 and Fig. 19.
In Fig. 18 lift rule support table analysis is seen for İstinye Park store. When we look at Fig. 18, it can be seen that there is a positive relationship between the shirt and the weaving shirt. Similarly, there is a positive relationship between the weaving shirt and the sweatshirt. However, there is a negative relationship between tricot sweater and sweatshirt due to proximity to 1. Because tricot sweaters and sweatshirts are exactly in the same category. Both of them are giving the same desire to the customers.
Figure 18. Lift rule support table for İstinye Park store
When we examine this analysis for Nautilus store, Fig. 17 is obtained. When we look at Fig. 19 we can see that there is a positive relationship between the T-shirt and the weaving shirt. There is also a positive relationship between the weaving shirt and the tricot sweater. There is a negative relationship between the denim pants and the weaving sport because of the closeness to 1 and they are exactly in the same category. Both of them are giving the same desire to the customers.
Figure 19. Lift rule support table for Nautilus store 4.3. Discussion
In İstinye Park store there is a strong relationship between t-shirt and weaving shirt. Approximately 23% of customers who received t-shirt also receive a weaving shirt category, while 19% of customers who received weaving shirt category also receive t-shirt. According to this result, the company should position t-shirt and weaving shirt side by side in this store.
In Nautilus store there is a strong relationship between t-shirt and weaving shirt. Approximately 12% of the customers who receive t-shirt also received a weaving shirt category, while 10% of the customers who received weaving shirt category also receive products from the t-shirt category. This is followed by a weaving shirt and sportswear. Also, it is seen that the highest confidence value is 100% between the wallet and the pyjamas for this store. According to these results, it can be said that the customers in this store are more modest and try to buy cheaper items.
With all these conclusions, the relationships between the products purchased by customers during shopping were examined and the buying habits of customers were determined. According to these results, our sample firm can reorganize its stores more affectively and more profitably. Also with these results the tourism effects were examined in two different branches. Depending on the purchase power, more expensive products can be sold in İstinye park store, while more modest products that can be offered to local customers should be included in the Nautilus store.
5. Conclusion and Limitations of the Paper
Creating a difference is important in today's world, whether it is in-house or out of business. Separating business processes from each other or thinking of them as different departments in any firm slows down the decision making mechanisms of the relevant firms and delays in reaching the desired results. Companies that want to be different have to consider all business processes inside and outside the company as a whole with the condition of not lagging behind developing technology.
In this paper, data mining method was discussed and an application related to customer relationship management was realized. The application about ARM has been examined in detail. According to the sales habits of our sample company’s customers, what products should be sold in the product range of the company and which products should be sold in two branches that we decided?
We have proposed a model that explains customer behavior and makes forward-looking forecasts with the Data Mining application used in Customer Relationship Management to find out the answers to these questions. The model was evaluated by ARM based on past sales slips.
This study, which examines customer relations through the clustering analysis method in retail management, proposes a model that examines customer behavior in terms of location, price and customers’ nationality. The sales slips from two different sales points (one of them is from Anatolia side of İstanbul and the other one is from Asia side of İstanbul) for the last 3 years are used in the analysis. With this study, the result of analysis indicates that the preferred products are differentiated in the stores where tourist customers are concentrated. In addition to this, it is seen that prices and product display structure are differentiated by being affected by the products sold together.
Using the results, we have obtained, we can recommend to the related firm to place the basic models and the models what attracting the customers in the front row for both stores. Apart from this, it can be said that we have examined the stores which have the same potential customer portfolio as the price sense, so that the product production for the demand of the customers will increase the sales. For this reason, the company can change its strategy to meet customer demands. In addition, in the stores where the tourist customers are concentrated, the products which they are interested in such as big logo, charming models etc. can be sent to these tourist attractions stores for selling.
The most important limitation of our work is that the model-based review takes a very long time and is troublesome. A detailed review of the models created for tourists can yield lots of data in SPSS software program. For this reason, we tried to overcome this crumbling by pulling data from the SQL system. Therefore, the sold product data were taken from SQL such as which season, how many pieces in which model were sold. It was a time consuming process to extract the data from SQL and integrate it into the SPSS system.
The model designed to analyze the behavior of retail customers in the textile sector can be used to explain the behavior of other sector customers in future studies. At the same time, it can be possible to compare the findings obtained by solving the existing problem with different data mining techniques.
Authors’ Contributions
Data mining method was discussed and an application was realized. The proposed model explains customer behavior, makes forward-looking forecasts and according to the buying habits it could be decided that what can be sold in which branches.
Statement of Conflicts of Interest
There is no conflict of interest between the authors. Statement of Research and Publication Ethics
The author declares that this study complies with Research and Publication Ethics. References
[1] Caniato F., Kalchschmidt M., Ronchi S., Verganti R., Zotteri G. 2005. Clustering Customers to Forecast Demand. Production Planning & Control, 16 (1): 32-43.
[2] Chang H.J., Hung L.P., Ho C.L. 2007. An Anticipation Model of Potential Customers’ Purchasing Behavior based on Clustering Analysis and Association Rules Analysis. Expert Systems with Applications, 32: 753-764.
[3] Sohn S.Y., Kim Y. 2008. Searching Customer Patterns of Mobile Service using Clustering and Quantitative Association Rule. Expert Systems with Applications, 34: 1070-1077.
[4] Tsai C.F., Chen M.Y. 2010. Variable Selection by Association Rules for Customer Churn Prediction of Multimedia on Demand, Expert Systems with Applications, 37: 2006-2015.
using Association Rule Mining. Procedia Computer Science, 85: 78-85.
[10] Lee D., Quadrifoglio L., Teulada B.S., Meloni I. 2016. Discovering Relationships between Factors of Round-Trip Car Sharing by using Association Rules Approach. Procedia Engineering, 161: 1282-1288.
[11] Liao S.H., Chang H.K. 2016. A Rough Set-based Association Rule Approach for a Recommendation System for Online Consumers. Information Processing and Management, 52: 1142-1160.
[12] Najafabadi M.K., Mahrin M.N., Chuprat S., Sarkan H.M. 2017. Improving the Accuracy of Collaborative Filtering Recommendations using Clustering and Association Rules Mining on Implicit Data. Computers in Human Behavior, 67: 113-128.
[13] Zhang D., Lv J., Zhang B., Zhang X., Jiang H., Lin Z. 2020. The Characteristics and Regularities of Cardiac Adverse Drug Reactions Induced by Chinese Materia Medica: A Bibliometric Research and Association Rules Analysis. Journal of Ethnopharmacology, 252: 112582.
[14] Triantaphyllou E., Yanase J., Hou F. 2020. Post-Consensus Analysis of Group Decision Making Processes by Means of a Graph Theoretic and an Association Rules Mining Approach. Omega, 94: 102208.
[15] Xu C., Bao J., Wang C., Liu P. 2018. Association Rule Analysis of Factors Contributing to Extraordinarily Severe Traffic Crashes in China. Journal of Safety Research, 67: 65-75.
[16] Li K., Liu L., Wang F., Wang T., Duic N., Shafie-khah M., Catalao J.P.S. 2019. Impact Factors Analysis on the Probability Characterized Effects of Time of Use Demand Response Tariffs using Association Rule Mining Method. Energy Conversion and Management, 197: 111891. [17] Ciarapica F., Bevilacqua M., Antomarioni S. 2019. An Approach based on Association Rules
and Social Network Analysis for Managing Environmental Risk: A Case Study from a Process Industry. Process Safety and Environmental Protection, 128: 50-64.
[18] Silva J., Varela N., Lopez L.A.B., Millan R.H.R. 2019. Association Rules Extraction for Customer Segmentation in the SMEs Sector Using the Apriori Algorithm. Procedia Computer Science, 151: 1207-1212.
[19] Kargarfard F., Sami A., Ebrahimie E. 2015. Knowledge Discovery and Sequence-based Prediction of Pandemic Influenza using an Integrated Classification and Association Rule Mining (CBA) Algorithm. Journal of Biomedical Informatics, 57: 181-188.
[20] Das S., Dutta A., Jalayer M., Bibeka A., Wu L. 2018. Factors Influencing the Patterns of Wrong-Way Driving Crashes on Freeway Exit Ramps and Median Crossovers: Exploration using ‘Eclat’ Association Rules to Promote Safety. International Journal of Transportation Science and Technology, 7 (2): 114-123.
[21] Zheng X., Wang S. 2014. Study on the Method of Road Transport Management Information Data Mining based on Pruning Eclat Algorithm and MapReduce. Procedia-Social and Behavioral Sciences, 138: 757-766.
[22] Bhandari A., Gupta A., Das D. 2015. Improvised Apriori Algorithm Using Frequent Pattern Tree for Real Time Applications in Data Mining. Procedia Computer Science, 46: 644-651. [23] Pala M., Saygı B. 2004. Gıda Sanayinde Büyük Mağazaların Perakendeci Markalı Ürün
Uygulamaları. İTO Istanbul Chamber of Commerce Publications, 73: 15-47.
[24] Zhao Q., Jin J., Deng X., Wang D. 2017. Considering Environmental Implications of Distribution Channel Choices: A Comparative Study based on Game Theory. Journal of Cleaner Production, 167: 1155-1164.
[25] Biçkes M.D., Kaplan M. 2002. Yeni Tüketici Eğilimleri ve Perakendecilik Sektöründeki Gelişmeler. Pazarlama Dünyası, 16 (6): 124-147.
[26] Erkip F., Ozuduru B.H. 2015. Retail Development in Turkey: An Account After Two Decades of Shopping Malls in the Urban Scene. Progress in Planning, 102: 1-33.
[27] Okumuş A. 2005. İndirimli Mağaza ve Süpermarket Müşterileri Arasındaki Farklılıkların Beklenti ve Memnuniyetlerine göre İncelenmesi. İstanbul University Business Administration Journal, 34 (1): 105-133.
[28] Kaya K., Şenel M.C., Koç E. 2018. Perakende Ticaret Sektörünün Türkiye’deki Genel Durumu. Akademik Araştırmalar ve Çalışmalar Dergisi, 10 (19): 502-515.
[29] Öztürk İ. 2006. Türkiye’de Perakende Sektörü. Çağ Üniversitesi Sosyal Bilimler Dergisi, 3 (1): 69-81.
[30] Kompil M., Çelik H.M. 2009. Türkiye’de Batı Tarzı Büyük Ölçekli Tüketim Mekânlarının Gelişimi ve Kentsel Perakende Alanlarının Yasal ve Yapısal Olarak Düzenlenmesi Gayretleri. Megaron, 4 (2): 90-100.
[31] Özdemir E.D., Çırağ K. 2018. Gıda Perakende Sektöründe Yerel Rekabet Dinamiklerinin Değerlendirilmesi: Antalya İli Örneği. Anemon Muş Alparslan Üniversitesi Sosyal Bilimler Dergisi, 6: 263-270.
[32] Feng F., Cho J., Pedrycz W., Fujita H., Herawan T. 2016. Soft Set based Association Rule Mining. Knowledge-Based Systems, 111: 268–282.
[33] Telikani A., Shahbhrami A. 2017. Data Sanitization in Association Rule Mining: An Analytical Review. Expert Systems with Applications, 000: 1-21.
[34] Ozyirmidokuz E.K., Uyar K., Ozyirmidokuz M.H. 2015. A Data Mining based Approach to a Firm’s Marketing Channel. Procedia Economics and Finance, 27: 77-84.
[35] Morais A., Peixoto H., Coimbra C., Abelha A., Machado J. 2017. Predicting the Need of Neonatal Resuscitation using Data Mining. Procedia Computer Science, 113: 571-576.
[36] Sharma S., Osei-Bryson K.M., Kasper G.M. 2012. Evaluation of an Integrated Knowledge Discovery and Data Mining Process Model. Expert Systems with Applications, 39: 11335-11348.
[37] Khader N., Lashier A., Yoon S.W. 2016. Pharmacy Robotic Dispensing and Planogram Analysis using Association Rule Mining with Prescription Data. Expert Systems with Applications, 57: 296-310.
[38] Liao S.H., Chen J.L., Hsu T.Y. 2009. Ontology-based Data Mining Approach Implemented for Sport Marketing. Expert Systems with Applications, 36 (8): 11045-11056.
[39] Şener A., Barut M., Öztekin A., Avcilar M.Y., Yildirim M.B. 2019. The Role of Information Usage in a Retail Supply Chain: A Causal Data Mining and Analytical Modeling Approach. Journal of Business Research, 99: 87-104.
[40] Chen Y.L., Chen J.M., Tung C.W. 2006. A Data Mining Approach for Retail Knowledge Discovery with Consideration of the Effect of Shelf-Space Adjacency on Sales. Decision Support Systems, 42 (3): 1503-1520.
[41] Zhang L., Zhang L., Teng W., Chen Y. 2013. Based on Information Fusion Technique with Data Mining in the Application of Finance Early-Warning. Procedia Computer Science, 17: 695-703.
[42] Louw H., Marais L. 2018. Mining and Municipal Finance in Kathu, an Open Mining Town in South Africa. The Extractive Industries and Society, 5 (3): 278-283.
[43] Gürbüz F., Turna F. 2018. Rule Extraction for Tram Faults via Data Mining for Safe Transportation. Transportation Research Part A: Policy and Practice, 116: 568-579.
[44] Wang T., Li T., Xia Y., Zhang Z., Jin S. 2017. Risk Assessment and Online Forewarning of Oil & Gas Storage and Transportation Facilities Based on Data Mining. Procedia Computer Science, 112: 1945-1953.
[45] Keramati A., Marandi R.J., Aliannejadi M., Ahmadian I., Mozaffari M., Abbasi U. 2014. Improved Churn Prediction in Telecommunication Industry using Data Mining Techniques. Applied Soft Computing, 24: 994-1012.
[46] Mahendrawathi E.R., Astuti H.M., Nastiti A. 2015. Analysis of Customer Fulfilment with Process Mining: A Case Study in a Telecommunication Company. Procedia Computer Science,
[50] Kantardzic M. 2011. Data Mining: Concepts, Models, Methods, and Algorithms. Second Edition, Institute of Electrical and Electronics Engineers, John Wiley & Sons, Inc.
[51] Brandao A., Pereira E., Portela F., Santos M.F., Abelha A., Machado J. 2014. Managing Voluntary Interruption of Pregnancy using Data Mining, Procedia Technology, 16: 1297–1306. [52] Han H.L., Ma H.Y., Yang Y. 2019. Study on the Test Data Fault Mining Technology Based on
Decision Tree. Procedia Computer Science, 154: 232-237.
[53] Czajkowski M., Kretowski M. 2019. Decision Tree Underfitting in Mining of Gene Expression Data. An Evolutionary Multi-Test Tree Approach. Expert Systems with Applications, 137: 392-404.
[54] Zhang H., Nguyen H., Bui X.N., Thoi T.N., Bui T.T., Nguyen N., Vu D.A., Mahesh V., Moayedi H. 2020. Developing a Novel Artificial Intelligence Model to Estimate the Capital Cost of Mining Projects using Deep Neural Network-based Ant Colony Optimization Algorithm. Resources Policy, 66: 101604.
[55] Saplıoğlu K., Acar R. 2020. K-Means Kümeleme Algoritması Kullanılarak Oluşturulan Yapay Zekâ Modelleri ile Sediment Taşınımının Tespiti. Bitlis Eren Üniversitesi Fen Bilimleri Dergisi, 9 (1): 306-322.
[56] Guo H., Nguyen H., Vu D.A., Bui X.N. 2019. Forecasting Mining Capital Cost for Open-Pit Mining Projects based on Artificial Neural Network Approach. Resources Policy, 101474. [57] Carvalho D.R., Freitas A.A. 2004. A Hybrid Decision Tree/Genetic Algorithm Method for Data
Mining. Information Sciences, 163 (1-3): 13-35.
[58] Gong C., Su Z.G., Wang P.H., Wang Q. 2020. Cumulative Belief Peaks Evidential K-Nearest Neighbor Clustering. Knowledge-Based Systems, 200: 105982.
[59] Ltifi H., Benmohamed E., Kolski C., Ayed M.B. 2016. Enhanced Visual Data Mining Process for Dynamic Decision-Making. Knowledge-Based Systems, 112: 166-181.
[60] Szalkai B., Grolmusz V.K., Grolmusz V.I. 2017. Identifying Combinatorial Biomarkers by Association Rule Mining in the CAMD Alzheimer’s Database. Archives of Gerontology and Geriatrics, 73: 300-307.
[61] Doostan M., Chowdhury B.H. 2017. Power Distribution System Fault Cause Analysis by using Association Rule Mining. Electric Power Systems Research, 152: 140-147.
[62] Marban O., Segovia J., Menasalvas E., Fernandez-Baizan C. 2009. Toward Data Mining Engineering: A Software Engineering Approach. Information Systems, 34 (1): 87-107.
[63] Wang J., Li H., Huang J., Su C. 2016. Association Rules Mining based Analysis of Consequential Alarm Sequences in Chemical Processes. Journal of Loss Prevention in the Process Industries, 41: 178-185.
[64] Romera J.M.L., Ballesteros M.M., Gutierrez J.G., Riquelme J.C. 2019. External Clustering Validity Index based on Chi-Squared Statistical Test. Information Sciences, 487: 1-17.
![Figure 2. CRISP-DM data mining process [36]](https://thumb-eu.123doks.com/thumbv2/9libnet/3899440.43786/6.892.297.595.105.379/figure-crisp-dm-data-mining-process.webp)