c
⃝ T¨UB˙ITAK doi:10.3906/fiz-1702-8 h t t p : / / j o u r n a l s . t u b i t a k . g o v . t r / p h y s i c s /
Research Article
Identification of the hadronic interaction layer in a highly granular calorimeter by
multivariate techniques
Burak B˙ILK˙I1,2,∗
1Department of Mathematics and Computing Science, Faculty of Science and Letters, Beykent University,
˙Istanbul, Turkey
2Department of Physics and Astronomy, College of Liberal Arts and Sciences, University of Iowa,
Iowa City, IA, USA
Received: 12.02.2017 • Accepted/Published Online: 16.03.2017 • Final Version: 13.06.2017
Abstract: Calorimetry in future and upgrade collider detectors has a clear overall trend towards high granularity, both laterally and longitudinally. This trend is a requirement for the full exploitation of particle flow algorithms, which reconstruct individual particles using the subdetector that provides the best resolution for this specific particle. The increased level of detail in the event topologies due to higher segmentation of the calorimeter provides additional handles for several calorimetric measurements, such as the identification of the hadronic interaction layer, which is not possible for calorimeters with traditional tower geometry. Here, the power of using multivariate statistical techniques in the identification of the hadronic interaction layer in a highly segmented calorimeter is investigated.
Key words: High energy physics, calorimetry, multivariate analysis techniques, hadronic interaction layer
1. Introduction
High energy particle collider experiments have always been a key component of scientific and technological
ad-vancement. The current highest energy particle collider is the Large Hadron Collider (LHC
-http://home.cern/topics/large-hadron-collider) with four big experiments: CMS [1], ATLAS [2], LHCb [3], and
ALICE [4]. The major future colliders envisaged are the International Linear Collider (ILC
-https://www.linearcollider.org/ILC), Compact Linear Collider (CLIC - http://clic-study.web.cern.ch/), and Future Circular Collider (FCC - https://fcc.web.cern.ch/Pages/default.aspx). The major task for the collider experiments is to measure all the emerging particles at the collision with highest precision. The high energy physics community has come to a consensus that the high precision aimed in these experiments can be achieved with the utilization of particle flow algorithms (PFAs) [5].
PFAs attempt to measure each particle in a jet individually, using the component that provides the best energy/momentum resolution. In this approach, charged particles are measured with a high-precision tracker, photons with the electromagnetic calorimeter, and the remaining neutral hadronic particles in a jet with the combined electromagnetic and hadronic calorimeters.
The CALICE collaboration (https://twiki.cern.ch/twiki/bin/view/CALICE/WebHome) developed sev-eral high segmentation calorimeters primarily targeting the linear collider experiments as well as the upgrade of the LHC detectors. The examples of the active media of these calorimeters are scintillators of the Analog Hadron Calorimeter (AHCAL) and the Scintillator Tungsten (ScW) Electromagnetic Calorimeter, Silicon of
the Silicon Tungsten (SiW) Electromagnetic Calorimeter, and Resistive Plate Chambers (RPCs) of the Digital and Semi-Digital Hadron Calorimeters (DHCAL and SDHCAL) as well as Monolithic Active Pixel Sensors (MAPS), Gas Electron Multipliers (GEMs), and Micromegas. The common point in these calorimeters is that they have high lateral and longitudinal segmentation. Also of extreme importance is that all of the LHC ex-periments have either adopted or are considering adopting high segmentation detector technologies for their calorimeter upgrades. The CMS experiment at the LHC has an approved program for large-scale Phase II calorimetry upgrade planned in 2023. This upgrade will consist of replacing the endcap calorimeters with a new silicon-based high granularity sampling calorimeter, HGC [6,7]. The endcap calorimeter system is divided into three separate parts: silicon–tungsten electromagnetic calorimeter of 28 sampling layers (EE), silicon–brass front hadron calorimeter with 12 sampling layers (FH), and scintillator–brass backing hadron calorimeter with
11 sampling layers (BH). EE and FH will be maintained at –30◦. Other examples from LHC are as follows:
ATLAS is considering a high-granularity timing detector; LHCb is considering a high timing, position, and angular resolution silicon–tungsten electromagnetic calorimeter; and ALICE is considering the ultimate digital calorimeter with MAPS.
As the overall trend in the future/upgrade detector systems is towards a significant increase in spatial segmentation, the algorithms to reconstruct the traversing particles should also evolve in the same manner. The energy reconstruction in conventional calorimetry is performed by simply adding contributions from individual, usually large-size geometrical calorimeter units called towers and there is minimal information about the topology of the individual electromagnetic or hadronic interactions. With the introduction of high segmentation, numerous topological variables become available.
Here, the identification of the hadronic interaction layer based on multivariate analysis techniques utilizing topological variables is investigated.
2. Materials and methods
In order to fully exploit the power of the analysis of the data obtained with highly segmented detector systems, techniques based on multivariate analysis (MVA) can be developed. With the availability of the high spatial detail of the particle interactions inside the detectors, several topological interaction variables can be obtained. A few examples are the longitudinal barycentre, radial dispersion, and the geometrical objects that contain e.g. 90% of the total interaction energy. Many more variables can be added to the list with various discriminating powers across different particle types and energies.
MVAs are based on supervised learning algorithms and can be utilized in two major ways in high energy physics data analysis: processing, evaluation, and application of multivariate classification, where a signal sample is tried to be identified within a mixed sample of signal and background; and of multivariate regression where attempts are made to predict the value of a response variable based on a set of input variables. The software tool designated for the implementation of these methods is TMVA—Toolkit for Multivariate Data Analysis with ROOT [8]. TMVA enables the training, testing, evaluation, and application of many regression and classification methods. The utilization of the toolkit is quite simple; however, effective use of the available statistical tools requires an in-depth knowledge of the detectors and the proper tuning of the settings in the classification and regression methods so that they are suitable for the particular implementation.
Among the MVA methods, multilayer perceptron or artificial neural networks (MLP), linear discriminant (LD) analysis, probability density estimator using self-adapting phase-space binning (PDE-Foam), and boosted regression trees with gradient bagged boost (BDTG) can be listed. These MVA methods are briefly described below [8].
An MLP is a simulated collection of interconnected neurons, with each neuron producing a certain response at a given set of input signals. By applying an external signal to some input neurons the network is put into a defined state that can be measured from the response of one or several output neurons. One can therefore view the neural network as a mapping from a space of input variables onto a one-dimensional or multidimensional space of output variables. The mapping is nonlinear if at least one neuron has a nonlinear response to its input.
The LD analysis provides data classification using a linear model, where linear refers to the discriminant function being linear in the parameters. It is equivalent to the Fisher discriminant, which seeks to maximize the ratio of between-class variance to within-class variance by projecting the data onto a linear subspace.
The PDE-Foam method divides the multidimensional phase space into a finite number of hyperrectangles (cells) of constant event density. This “foam” of cells is filled with averaged probability density information sampled from the training data. For a given number of cells, the binning algorithm adjusts the size and position of the cells inside the multidimensional phase space based on a binary split algorithm that minimizes the variance of the event density in the cell. The binned event density information of the final foam is stored in cells, organized in a binary tree. In regression mode, the algorithm determines cells with small varying regression targets.
The BDTG is a binary tree structured regressor. Repeated left/right decisions are taken on one single variable at a time until a stop criterion is fulfilled. The phase space is split this way into many regions. Each output node represents a specific value of the target variable. The boosting of a regression tree extends this concept from one tree to several trees, which form a forest. The trees are derived from the same training ensemble by reweighting events, and are finally combined into a single regressor, which is given by a weighted average of the individual regression trees. Boosting stabilizes the response of the regression trees with respect to fluctuations in the training sample and is able to considerably enhance the performance with respect to a single tree. The boosting procedure is employed to adjust the parameters such that the deviation between the model response and the true value y obtained from the training sample is minimized. Gradient boost works best on weak classifiers, meaning small individual regression trees with a depth of often just 2 to 4. In certain settings gradient boost may also benefit from the introduction of a bagging-like resampling procedure using random subsamples of the training events for growing the trees. This is called stochastic gradient boosting and is what is implemented in this demonstrator.
In order to study the implementation of MVAs in the identification of the hadronic interaction layer, a highly granular calorimeter response was simulated with the Geant4 package [9]. The calorimeter consists of scintillators as active media and tungsten as the absorber material. A single layer is made of a cassette structure that has 2-mm steel plates at the front and back with 5-mm scintillator and 5-mm PCB layers in between. The calorimeter is an alternating structure of 10.5-mm tungsten absorbers and the cassettes, and is geometrically
similar to the CALICE AHCAL [10]. The scintillator layer is segmented into 1 cm × 1 cm cells with no dead
areas. In order to mimic a real calorimeter response, 15% spread is introduced to the response (here the total energy deposit within a tile) of the traversing minimum ionizing particles (MIPs).
As beam particles, positively charged pions are used in energies of 10, 20, 30, 40, 50, 60, 70, 80, 90, and 100 GeV (typical test beam hadron energies). The particles are generated at the face of the calorimeter in the
central 10 cm × 10 cm area and are directed at normal angles to the calorimeter surface. The energy deposit in
the calorimeter tiles is expressed as a factor of average MIP response of the tiles. The noise level of the response is set at 0.5 MIPs and any energy deposit below this is considered zero. Figure 1 shows Geant4 event displays for 10 GeV (left) and 30 GeV (right) pions.
Figure 1. Events displays of 10 GeV (left) and 30 GeV (right) pion interactions. true IL 0 5 10 15 20 tr u e - IL reg ression IL 15 − 10 − 5 − 0 5 10 15 0 100 200 300 400 500 600 700 800 900 d true IL 0 5 10 15 20 tr u e - IL reg ression IL 15 − 10 − 5 − 0 5 10 0 200 400 600 800 1000 c true IL 0 5 10 15 20 true - IL regression IL 15 − 10 − 5 − 0 5 10 15 0 200 400 600 800 1000 a true IL 0 5 10 15 20 true - IL regression IL 15 − 10 − 5 − 0 5 10 15 0 100 200 300 400 500 600 700 800 900 b
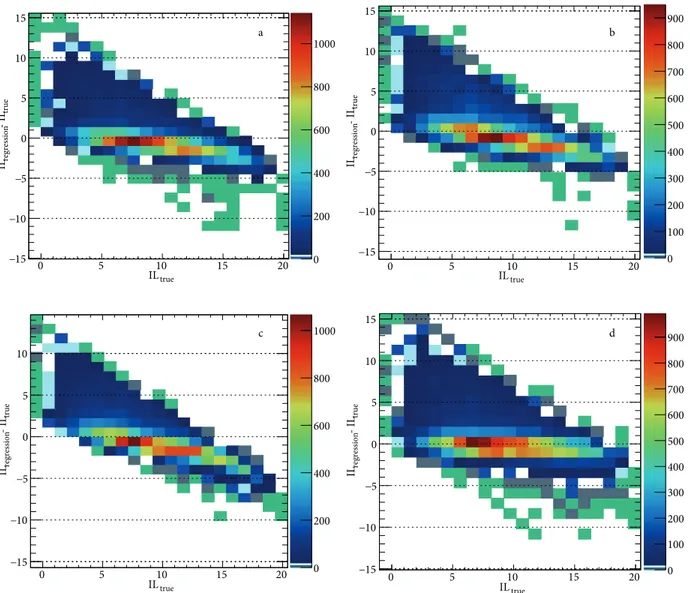
Figure 2. The deviation between the MVA-calculated interaction layer and the true interaction layer for MLP (a), LD (b), PDE-Foam (c), and BDTG (d) methods.
The analysis of the hadronic interaction data starts with the identification of the interaction layer, where the incident hadron goes through the first hadronic interaction. For the identification of the interaction layer, the following topological variables are utilized:
1. The layer with maximum number of MIPs. 2. Maximum number of MIPs.
3. The layer that contains the tile with maximum number of MIPs.
4. Layer with maximum number of tiles with signal above threshold (0.5 MIPs).
The regression algorithms were trained with 25,000 events and were tested with 25,000 events.
/ ndf 2 χ 2158.0 / 19 Constant 5541.3 ± 52.2 Mean −0.8 ± 0.0 Sigma 1.8 ± 0.0 true - IL regression IL 15 − −10 −5 0 5 10 15 Events / 1 .2 0 1000 2000 3000 4000 5000 6000 χ2 / ndf 2158.0 / 19 Constant 5541.3 ± 52.2 Mean −0.8 ± 0.0 Sigma 1.8 ± 0.0
c
/ ndf 2 χ 2842.5 / 20 Constant 6469.4 ± 55.2 Mean −0.7 ± 0.0 Sigma 1.7 ± 0.0 true - IL regression IL 15 − −10 −5 0 5 10 15 Events / 1.2 0 1000 2000 3000 4000 5000 6000 / ndf 2 χ 2842.5 / 20 Constant 6469.4 ± 55.2 Mean −0.7 ± 0.0 Sigma 1.7 ± 0.0b
/ ndf 2 χ 2680.5 / 20 Constant 7728.1 ± 72.9 Mean −0.6 ± 0.0 Sigma 1.4 ± 0.0 true - IL regression IL 15 − −10 −5 0 5 10 15 Events / 1.2 0 1000 2000 3000 4000 5000 6000 7000 8000 / ndf 2 χ 2680.5 / 20 Constant 7728.1 ± 72.9 Mean −0.6 ± 0.0 Sigma 1.4 ± 0.0a
/ ndf 2 χ 3591.7 / 19 Constant 9984.2 ± 96.3 Mean −0.2 ± 0.0 Sigma 1.1 ± 0.0 true - IL regression IL 15 − −10 −5 0 5 10 15 Entrie s / 1.2 0 2000 4000 6000 8000 10000 / ndf 2 χ 3591.7 / 19 Constant 9984.2 ± 96.3 Mean −0.2 ± 0.0 Sigma 1.1 ± 0.0d
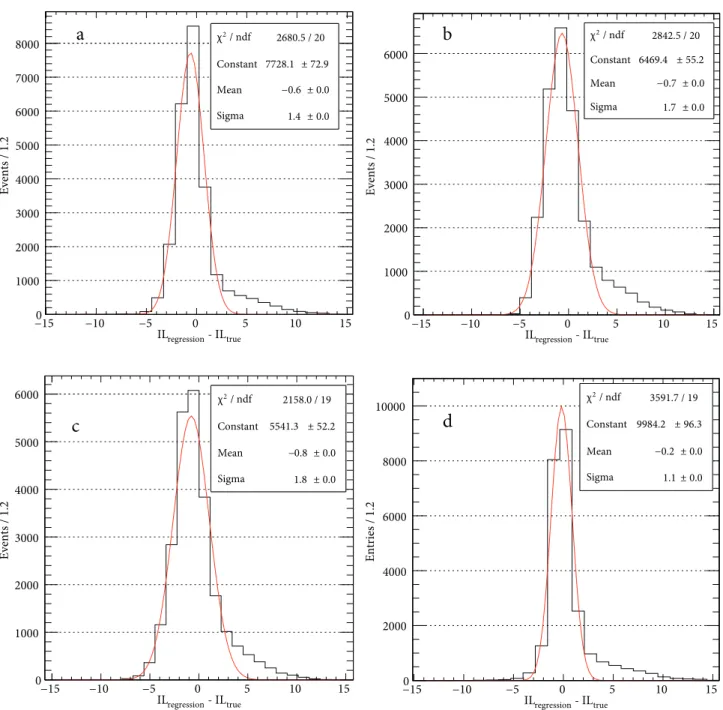
Figure 3. The distributions of the deviation between the MVA-calculated interaction layer and the true interaction layer for MLP (a), LD (b), PDE-Foam (c), and BDTG (d) methods.
3. Results
Figure 2 shows the deviation between the MVA-calculated interaction layer and the true interaction layer for MLP (a), LD (b), PDE-Foam (c), and BDTG (d) methods. All methods are successful in identifying the hadronic interaction layer and tend to predict larger values for smaller interaction layers and smaller values for larger interaction layers.
The deviation is largest at very low and very high interaction layers and is optimally predicted by the MVA methods in the range of 5–12.
Figure 3 shows the distributions of the deviations for MLP (a), LD (b), PDE-Foam (c), and BDTG (d) methods together with the Gaussian fits in the entire range. The low end tail is sufficiently well described by the fits. The majority of the high tail contribution comes from the hadrons interacting in the first few layers.
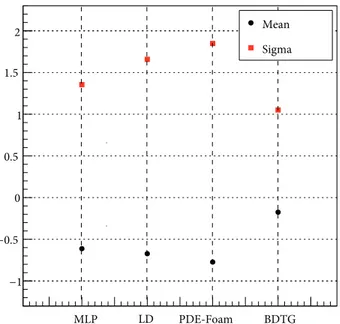
Figure 4 shows the mean (black) and sigma (red) of the Gaussian fits of Figure 3. The error bars are smaller than the size of the markers. All methods show superior performance in the identification of the hadronic interaction layer. An absolute deviation less than 1 signifies a correct identification since the layer numbers are integers. BDTG shows the smallest spread with a sigma value close to 1.
1 − 0.5 − 0 0.5 1 1.5 2 MLP LD PDE-Foam BDTG Mean Sigma
Figure 4. Mean (black) and sigma (red) of the Gaussian fits of Figure 3.
4. Conclusions
The development of high granularity calorimeters enables the invention of numerous topological event variables. These variables can be utilized in the identification of the hadronic interaction layer, reconstruction of the incident particle energy, and several other hadronic interaction measurements.
In this study, the feasibility of identification of the interaction layer with multivariate analysis techniques is investigated as a novel approach for highly granular calorimeter systems. The identification of the hadronic interaction layer is particularly important in the reconstruction of the energy of the hadron with high resolution, as well as energy flow calculations and leakage corrections. With traditional calorimetry, where the energy of the hadron is an accumulated signal in large detector volumes called towers, such precise measurements are not possible. In highly granular calorimeters on the other hand, advanced statistical analysis techniques can be utilized.
The methods used in this study, MLP, LD, PDE-Foam, and BDTG show superior performance in the identification of the interaction layer. The BDTG method is preferable to the others in terms of higher accuracy and less computation time requirement.
References
[1] Chatrchyan, S.; Hmayakyan, G.; Khachatryan, V.; Sirunyan, A. M.; Adam, W.; Bauer, T.; Bergauer, T.; Bergauer, H.; Dragicevic, M.; Er¨o, J.; et al. J. Instrum. 2008, 3, S08004.
[2] Aad, G.; Abat, E.; Abdallah, J.; Abdelalim, A. A.; Abdesselam, A.; Abdinov, O.; Abi, B. A.; Abolins, M.; Abramowicz, H.; Acerbi E.; et al. J. Instrum. 2008, 3, S08003.
[3] Alves, A. A. Jr.; Andrade Filho, L. M.; Barbosa, A. F.; Bediaga, I.; Cernicchiaro, G.; Guerrer, G.; Lima, H. P. Jr; Machado, A. A.; Magnin, J.; Marujo, F.; et al. J. Instrum. 2008, 3, S08005.
[4] Aamodt, K.; Abrahantes Quintana, A.; Achenbach, R.; Acounis, S.; Adamov´a, D.; Adler, C.; Aggarwal, M.; Agnese, F.; Aglieri Rinella, G.; Ahammed, Z.; et al. J. Instrum. 2008, 3, S08002.
[5] Adloff, C.; Blaha, J.; Blaising, J. J.; Drancourt, C.; Espargili`ere, A.; Gaglione, R.; Geffroy, N.; Karyotakis, Y.; Prast, J.; Vouters, G.; et al. J. Instrum. 2011, 6, P07005.
[6] Bilki, B. In Journal of Physics: Conference Series: 16th International Conference on Calorimetry in High Energy Physics (CALOR 2014), Giessen, Germany, 6–11 April 2014, 2015, 587, 012014.
[7] Magnan, A. M. In Journal of Instrumentation: 14th Topical Seminar on Innovative Particle and Radiation Detec-tors, Siena, Italy, 3–6 October 2016, 2017, J. Instrum. 12, C01042.
[8] Hoecker, A.; Speckmayer, P.; Stelzer, J.; Therhaag, J.; von Toerne, E.; Voss, H.; Backes, M.; Carli, T.; Cohen, O.; Christov, A.; et al. In 11th International Workshop on Advanced Computing and Analysis Techniques in Physics Research (ACAT 2007), Amsterdam, Netherlands, 23–27 April 2007, 2007, PoS ACAT, 40.
[9] Agostinelli, S.; Allison, J.; Amako, K.; Apostolakis, J.; Araujo, H.; Arce, P.; Asai, M.; Axen, D.; Banerjee, S.; Barrand, G.; et al. Nucl. Instrum. Methods 2003, A506, 250-303.
[10] Chefdeville, M.; Karyotakis, Y.; Repond, J.; Schlereth, J.; Xia, L.; Eigen, G.; Marshall, J. S.; Thomson, M.A.; Ward, D.R.; Alipour Tehrani, N.; et al. J. Instrum. 2015, 10, P12006.