IZMIR KATIP CELEBI UNIVERSITY GRADUATE SCHOOL OF NATURAL AND APPLIED SCIENCES
M.Sc. THESIS
July 2017
DETECTION OF DYES IN WATER USING SMARTPHONE TECHNOLOGY FOR ENVIRONMENTAL SUSTAINABILITY
Thesis Advisor: Assoc. Prof. Mehmet Ertuğrul SOLMAZ Gizem KOCAKUŞAK ÖZDEMİR
IZMIR KATIP CELEBI UNIVERSITY GRADUATE SCHOOL OF NATURAL AND APPLIED SCIENCES
M.Sc. THESIS
July 2017
Thesis Advisor: Assoc Prof. Mehmet Ertuğrul SOLMAZ Gizem KOCAKUŞAK ÖZDEMİR
Y150203002
Department of Nanoscience and Nanotechnology
DETECTION OF DYES IN WATER USING SMARTPHONE TECHNOLOGY FOR ENVIRONMENTAL SUSTAINABILITY
İZMİR KATİP ÇELEBİ ÜNİVERSİTESİ FEN BİLİMLERİ ENSTİTÜSÜ
YÜKSEK LİSANS TEZİ
Temmuz 2017
ÇEVRESEL SÜRDÜRÜLEBİLİRLİK İÇİN AKILLI TELEFON TEKNOLOJİSİ İLE SUDA BOYALARIN TESPİTİ
Tez Danışmanı: Doç. Dr. Mehmet Ertuğrul SOLMAZ Gizem KOCAKUŞAK ÖZDEMİR
Y150203002
vii
Gizem KOCAKUŞAK ÖZDEMİR, a M.Sc. student of IKCU Graduate School of Natural and Applied Sciences student ID Y150203002, successfully defended the thesis entitled ―Smartphone-based Detection of Dyes in Water for Environmental Sustainability‖, which she prepared after fulfilling the requirements specified in the associated legislations, before the jury whose signatures are below.
Thesis Advisor : Doc.Dr. Mehmet Ertuğrul Solmaz Izmir Katip Celebi University
Jury Members : Assoc. Prof. Dr. Mehmet Ertuğrul SOLMAZ Izmir Katip Celebi University
Assoc. Prof. Dr. Serkan ATEŞ Izmir Institute of Technology
Date of Submission : 26 June 2017 Date of Defense : 07 July 2017
Ass. Prof. Nesrin HORZUM POLAT Izmir Katip Celebi University
ix FOREWORD
This thesis was done for completion to the master degree at the Department of Nanoscience and Nanotechnology at Izmir Katip Celebi University. During all phases of this study, from selection of topic to the writing of the thesis, were carried out under the supervision of Assoc. Prof. Mehmet Ertuğrul SOLMAZ. The subject of this thesis is the applicability of an ultra-low cost, field-deployable, plastic fiber based smartphone spectrometer system to study dye adsorption from water. At the end of the work, an article with the same title with the thesis was published in Analytical Methods, a journal of Royal Society of Chemistry, volume 2017,9, pages 579-585. During completing the research and writing the article, Asst. Prof. Nesrin HORZUM POLAT, Asst. Prof. Volkan KILIÇ, Abdullah BAYRAM was participated in all stages.
I would like to thank firstly my advisor Assoc. Prof. Mehmet Ertuğrul SOLMAZ for his supporting me since the first day of my master education.
In addition, I would like to thank my spouse, Arif ÖZDEMİR, for supporting and taking care of me in my weary times affectionately, my mother, Meral KOCAKUŞAK, my father, Ali KOCAKUŞAK and my brother, Ahmet KOCAKUŞAK, for supporting me in all my education life.
xi TABLE OF CONTENTS
Page
FOREWORD ... ix
TABLE OF CONTENTS ... xi
LIST OF FIGURES ... xiii
1. INTRODUCTION ... 1
1.1 Water ... 1
1.1.1 Water Quality ... 1
1.1.2 Water and Air Pollution ... 2
1.1.3 Dyes ... 2
1.1.4 Detection Technique ... 2
2. MATERIALS AND METHODS ... 7
2.1 Smartphone Spectrometer System ... 7
2.1.1 3D printing ... 8
2.1.2 Diffraction Grating ... 9
2.1.3 Camera ... 11
2.1.4 Fiber ... 13
2.2 Digital Image Processing ... 13
3. RESULTS ... 20
3.1 MB Absorption Studies ... 20
3.2 Characterization of PAN/Zeolite Composite Nanofibrous Membranes ... 25
3.3 Adsorption of MB by Electrospun Nanofibers ... 27
4. CONCLUSION ... 31
5. REFERENCES ... 33
xiii LIST OF FIGURES
Page
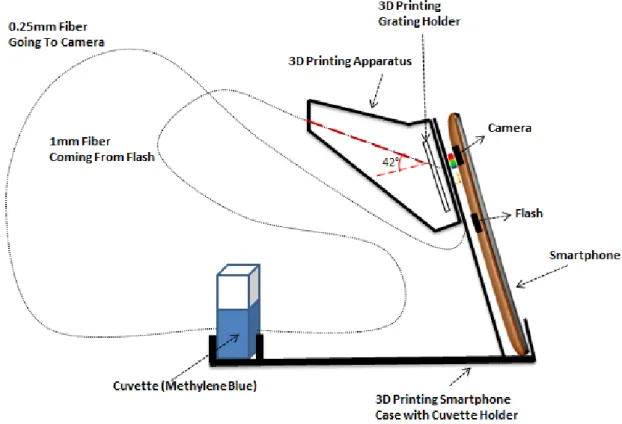
Figure 2.1 : The schematic representation of the smartphone spectrometer system. ... 7
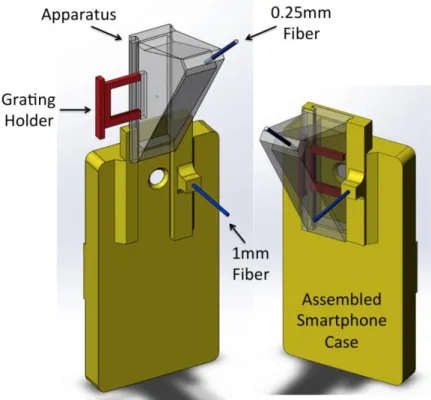
Figure 2.2: The grating is placed inside the apparatus, which can be slid onto the smartphone case. The collecting plastic fiber with 0.25mm diameter is pushed into the apparatus while the light launched from the camera flash is transmitted using a second 1mm diameter fiber. The smartphone system is placed onto the cradle. ... 8
Figure 2.3 : A photograph of the smartphone spectrometer with the inset ... 9
Figure 2.4 : Schematic representation of the incoming wave and light going through the diffraction grating. Zeroth and first order modes are represented... 10
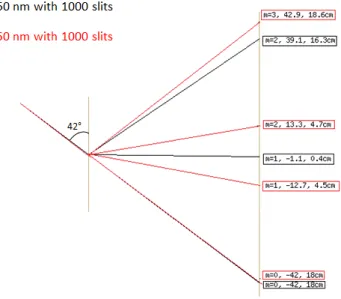
Figure 2.5: Simulation of modes formation with diffraction grating for different wavelengths. ... 11
Figure 2.6: Image comparison for JPEG format and RAW format respectively. ... 12
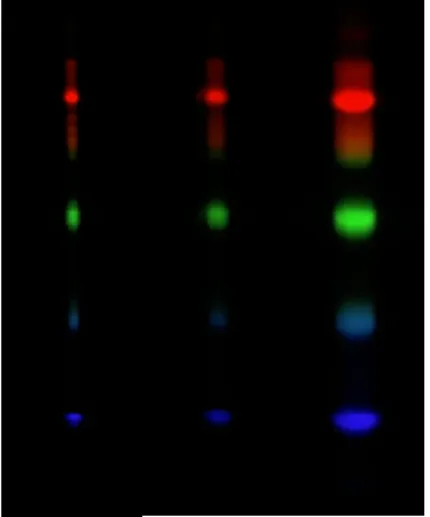
Figure 2.7: The spectral images obtained by using different-sized (0.25mm, 0.5mm, 1mm from left to right) plastic fibers. ... 15
Figure 2.8: The output spectrum comparing the size of fibers used in the smartphone with that a commercial spectrometer. (HSV means the Value is plotted.) ... 16
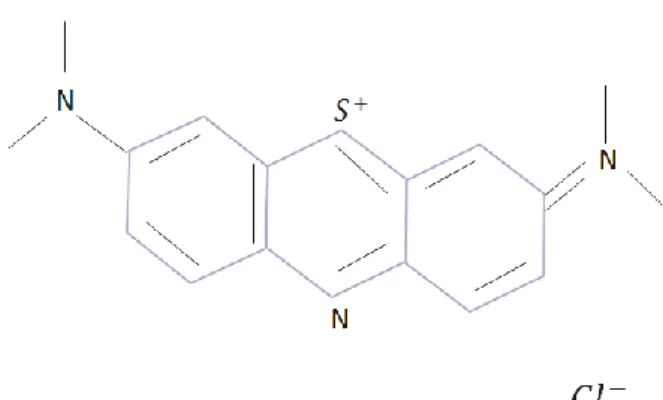
Figure 2.9 : Chemical Structure of Methylene Blue (C16H18ClN3S) ... 16
Figure 2.10: Structure of Polyacrylonitrile (PAN). ... 17
Figure 2.11: Schematic representation of the electrospinning setup... 18
Figure 3.1: In-detailed presentation of how light is absorbed through the sample cuvvette. ... 21
Figure 3.2:The photographic images of MB solutions from 0.1 to 10 ppm with increasing concentration and color intensity. ... 22
Figure 3.3:The spectral images of MB solutions from 0.1 to 10 ppm, from left to right. ... 22
Figure 3.4:Absorbance spectrums obtained from smartphone and commercial ... 23 Figure 3.5:The absorbance at 664 nm was measured by smartphone spectrometer in
RAW and JPEG formats and one commercial spectrometer. LOD was
xiv
Figure 3.6 The EDS spectrum and elemental mapping of the (a) zeolite powder, (b) PAN nanofibers, and (c) PAN/Zeolite nanofibers ... 26 Figure 3.7:SEM micrographs of (a) zeolite powder, (b) PAN nanofibers, (c) ... 27 Figure 3.8: FTIR spectra of the materials. ... 27 Figure 3.9: The effect of different fiber catalysts on the catalytic degradation of MB.
... 28 Figure 3.10:The photographic image showing the color of the fibrous mats and the 29
xv
SMARTPHONE-BASED DETECTION OF DYES IN WATER FOR ENVIRONMENTAL SUSTAINABILITY
SUMMARY
The goal of this thesis is to develop the applicability of an ultra-low cost, field-deployable, plastic fiber based smartphone spectrometer system to study dye adsorption from water. A custom cradle using smartphone’s built-in flash and camera was designed for visible absorbance spectroscopy without any need for external electrical components. We firstly investigated the performance of smartphone spectrometer for methylene blue (MB) absorbance in water with a detection limit of 0.5 ppm, and compared it to that of a commercial spectrometer. We elaborated on the contribution of image formats to the calibration of standard absorbance curve. We then studied the catalytic activity of electrospun polyacrylonitrile (PAN)/Zeolite composite nanofibers by analyzing MB adsorption as a function of time. The results obtained in the proposed compact, cost-effective and high-performance platform can help transform measurement science for sustainable water management.
xvii
ÇEVRESEL SÜRDÜRÜLEBİLİRLİK İÇİN AKILLI TELEFON İLE SUDA BOYALARIN TESPİTİ
ÖZET
Bu tezin amacı, sudan boya adsorpsiyonu araştırmak için ultra düşük maliyetli, sahada kullanılabilir, plastik fiber tabanlı bir akıllı telefon spektrometresi sisteminin uygulanabilirliğini geliştirmektir. Akıllı telefonun dahili flaşını ve kamerasını kullanan özel bir düzenek, harici elektronik bileşenlere gerek duymadan görünür emilim spektroskopisi için tasarlandı. Öncelikle akıllı spektrometrenin sudaki metilen mavisi absorbsiyonu için 0.5 ppm tespit sınırı ile performansını araştırdık ve ticari bir spektrometre ile karşılaştırdık. Görüntü formatlarının standart absorbans eğrisinin kalibrasyonuna katkısı üzerinde durduk. Daha sonra zamanın bir fonksiyonu olarak metilen mavisinin adsorpsiyonunu analiz ederek elektrospun poliakrilonitril (PAN) / Zeolit kompozit nanofiberlerin katalitik aktiviteleri üzerinde çalıştık. Önerilen kompakt, düşük maliyetli ve yüksek performanslı platformda elde edilen sonuçlar, sürdürülebilir su yönetimi için ölçüm biliminin dönüşümüne yardımcı olabilir.
1
1. INTRODUCTION
Possible accumulation of dyes in a body of water is harmful to humans and environment. Their removal at industrial facilities is extremely important before they are discharged to environment. As much as water is necessary for all living beings to survive; it is also critical for development in areas such as science, technology and industry. For all these reasons, it is very straightforward that the water is called the source of life and it is essential to use clean and purified water resources in each area according to the necessary conditions.
1.1 Water
1.1.1 Water Quality
Water is one of the most important natural sources of our daily life obtained from two main sources generally, groundwater and surface water. However in our home or business, our daily needs are generally procured from municipal or bottled water. For municipal water, water is obtained from groundwater or a surface water source, such as rivers, and these sources come to our home or business with help of pipes after being processed for purification. Filtration and disinfection with chemicals are sequentially performed to get rid of microorganisms that cause serious diseases sometimes even infectious diseases. While in water-rich countries like USA, North and West European countries the annual amount of water per capita as 10.000+ m3, in our country, this amount decreases to 1.600 m3, this difference practically makes our country a water-poor country in the world. Just because of this reason, solution-oriented approaches against the efficient use of water resources should be investigated.
Water is the easiest means of transportation for microorganisms to human body by drinking, and using. Surface water is the most prone to pollution since the industrial areas are placed fairly close to the surface water sources to be used in industrial production. Hence the surface water sources carry waterborne contaminants, such as aluminum, ammonia, arsenic are the most common ones.
2 1.1.2 Water and Air Pollution
The presence of pure and clean water in nature is dependent on biological, physical and chemical factors. However for agriculture and industry uses, the quality of water can be quite flexible and water pollution is permitted up to a certain extent (Goel, 2006). Indirect sources of water pollution include contaminants that enter the water supply from soils or groundwater
and from the atmosphere via rain (Rao, Senthilkumar, Byrne, & Feroz, 2012). The effect of the industry on water pollution is major concern. The causes of industrial water pollution can be from sewages, nutrients, wastewater, chemical waste, radioactive waste, industrial oil and plastics. Chemical waste is a major pollution factor, where the best-known pollutant is color dyes used in industry. Dyes are generally non-biodegradable, and are very deadly for all living things. However, there are water insoluble dyes removed from wastewater with some processing. The dye industry also emits various pollutants to air. For example, the certain processes in textile production induce air pollution with atmospheric emissions. In pigment dyeing, the contaminants are released to air during the drying process.
1.1.3 Dyes
Dyes are major components to add or change color to materials and they are generally applied to materials in aqueous solution. There are several types of dyes such as natural dyes obtained from plants, flowers or vegetables. Moreover, synthetic dyes can be produced with chemicals to be used in certain areas. Natural or artificial dyes have a with significant coloring capacity and are widely used in production of consumer products, including textile, cosmetics, paints, food, pharmaceutical, printing inks, plastics, photographic and paper industries(Kumar, 2014).
1.1.4 Detection Technique
Water contaminants usually cause a bad smell, taste or appearance. However occasionally the water smells tastes or looks good, even though it is not clean enough or disinfected properly. Human senses cannot detect the harmful microbial or organic contaminants and hence there is a great need for detection mechanism for these pollutants. Industrial techniques used in detection of water pollution are
3
Chromatography, Electrode Measurements and Radiation Measurements (Schaefer, 2014). Among these techniques, chromatography has the most sensitivity and accuracy for detection of the chemical contaminants of water. By separating the ions in a water sample, chromatography provides the capability to measure chemical residues dissolved in water. In chromatography, instruments may have colorimetric, mass or conductivity detectors. This technique allows taking measurements quickly and precisely. The other technique is the ion-selective electrode technique which evaluates the harmful contaminants in water. In this measurement technique there are two electrodes one of which is inside the reference solution known concentration and the other one is in the sample solution. Only the desired ions go from the reference electrode to the sample electrode during the redox reaction. Besides all of these techniques, measurement with the radiation is the most-widely used in industry and simpler than the others.
Adsorption is one of the most effective ways to remove undesirable molecules from wastewater (Robinson, McMullan, Marchant, & Nigam, 2001; Yagub, Sen, Afroze, & Ang, 2014), and absorbance spectroscopy is the major measurement method to observe dye removal efficiency (Alver & Metin, 2012; Ayad & El-Nasr, 2010). Cost effective field-portable measurement devices provide alternative way for controlling the removal of dyes for environmental sustainability and management. Especially smartphone platforms with integrated sensing systems are drawing huge interest due to the premises of replacing their benchtop counterparts with compatible performance and the ability to use in a resource-limited setting. Ultimately, smartphone instrumentation went beyond microscopy to replace commonly used instruments such as colorimeters (Contreras-Naranjo, Wei, & Ozcan, 2016). For instance, a smartphone by itself is enough to quantify colorimetric test strips without any external attachments (Hong & Chang, 2014; Shen, Hagen, & Papautsky, 2012), or with a simple holding attachment for water monitoring system (Gunda et al., 2014). By adding external 3D printed housing and optical components, a colorimetric plate reader based on image processing was proposed for enzyme-linked immunosorbent assay (ELISA) immunoassays (Berg et al., 2015). On the other hand, smartphone based spectrometric and colorimetric analyses were studied using diffraction gratings as dispersive elements. Here the color spectrum image is further processed in various color spaces to extract quantitative data. The wavelength
4
spectrum of interest is usually limited to 400-700 nm due to optical filters placed in front of the camera by the manufacturers. A smartphone ELISA platform capable of biomarker absorption analysis was demonstrated using a custom cradle consisting of several optical components and an external broadband source (Kenneth D Long, Hojeong Yu, & Brian T Cunningham, 2014). Similarly, a smartphone fluorimeter system was designed to detect miRNA sequences in a liquid based assay using an external laser as the source (Yu, Tan, & Cunningham, 2014). Optical fibers were incorporated onto smartphone spectrometer systems due to precise light confinement and flexible nature. A fiber-based endoscopic spectrometer integrated onto camera sensor was proposed for food quality monitoring (Hossain, Canning, Cook, & Jamalipour, 2016). Recently, smartphone spectrometers with no external electrical and optical components were proposed to improve portability, lower the costs, and help environmental sustainability. A surface plasmon resonance based refractive index sensor by assembling an fiber optical bench on top of a smartphone with no external LEDs was reported (Bremer & Roth, 2015). A spectrometer relying only on a smartphone’s built-in flash as the light source and a compact disk as the reflection grating was used to detect glucose and troponin I (Wang et al., 2016). No prior smartphone spectrometer/ colorimeter instrument has been fully integrated with plastic optical fibers, collecting the light from built-in flash and delivering the transmitted light to the camera sensor on the phone as the detection instrument to study adsorption efficiency of electrospun nanofibers for the removal of dye from waters.
In this thesis, we report ultra-low cost, portable, plastic fiber based spectrometric and colorimetric smartphone platform to study dye adsorption by electrospun polyacrylonitrile (PAN)/Zeolite nanofibers for field-deployable environmental and wastewater management. The composite nanofibers provide advantageous combination of zeolite particles and electrospun PAN nanofibers. Electrospinning is a versatile and efficient fabrication technique for nanostructured fibers of both organic and/or inorganic materials (Burger, Hsiao, & Chu, 2006; Huang, Zhang, Kotaki, & Ramakrishna, 2003). The resulting nanofibers enable not only high surface area to volume ratio, but also superior mechanical integrity compared to the powdered materials (Horzum, Boyacı, Eroğlu, Shahwan, & Demir, 2010; Horzum et al., 2012). These properties make PAN/Zeolite composite nanofibers optimal candidates for
5
adsorption applications. Adsorption of methylene blue (MB) molecules on large-area nanofibers decreases the absorbance of liquid that is picked up by camera sensor. To enable absorbance measurements, we have designed a custom cradle that aligns plastic optical fibers onto phone optical components. While the cradle is fixed, the liquid can be inserted into the holder slot. The proposed platform is straightforward and achieves high resolution by using all plastic components without the need for any external emissive sources, electrical sources and cables, and lenses. Our work enables smartphone based adsorption studies of other molecules in a robust and economically advantageous setting.
7
2. MATERIALS AND METHODS
2.1 Smartphone Spectrometer System
Smartphone spectrometer system includes optical elements such as diffraction grating and plastic optical fibers, and 3D printing parts as shown in Figure 2.1. The smartphone spectrometer was manufactured to integrate with a smartphone (LG G4) by using rear-facing camera as the digital light detector. A custom-designed cradle, consistent with hot-plug apparatus toting a diffraction grating, and smartphone case holder keeping the whole part compact with the cuvette holder were fabricated from Acrylonitrile Butadiene Styrene (ABS) polymer using a 3D printer.
8
Figure 2.2: The grating is placed inside the apparatus, which can be slid onto the smartphone
case. The collecting plastic fiber with 0.25mm diameter is pushed into the apparatus while the light launched from the camera flash is transmitted using a second 1mm diameter fiber. The smartphone system is placed onto the cradle.
2.1.1 3D printing
3D printing is an additive manufacturing process that is forming of a profile layer by layer. It recognizes a 3D body as many of two-dimensional layers where a wide variety of raw materials can be used. This system can create product in various fields, such as environmental, medical and scientific. Raw materials can be used to prototype in plastic, nylon, resin, ABS, polypropylene and even industrial metals. In this study, ABS was used, which is a low cost engineering plastic and allows to easily fabricate with 3D printer. ABS has resistance to chemicals, impact and heat. Solidworks CAD Software was used in design process. Solidworks is a computer-aided design program for creating 3D solid models of objects, and it can be used for mechanical or industrial purposes.
A custom-designed cradle, consistent with hot-plug apparatus toting a diffraction grating, and smartphon case holder keeping the whole part compact with the cuvette
9
holder were fabricated from ABS polymer using a 3D printer (Zortrax M200). The total polymer usage was about 150 g. The total cost of the components is less than $10 with the biggest percentage being 3D printer material.
Figure 2.3 : A photograph of the smartphone spectrometer with the inset
(top-left) of plastic fiber coupled to built-in flash. The sample to be tested is placed into the cuvette holder.
2.1.2 Diffraction Grating
A diffraction grating consists of large number of parallel slits. These slists are close and parallel to each other, and they usually have equal width and are equadistant from each other. A slit is placed between two opaque region with equal width (b), and transparent and opaque regions are aligned as a regular sequence. Generally there are two types of grating: reflection and transmission grating. If there is like a mirror-like surface between the opaque regions, it behaves as a reflecting diffraction
10
grating, (i.e. light reflected between two lines). For the transmission diffraction grating, instead of a mirror-like surface, there are transparent regions the opaque regions where the incident light cannot pass through. A plane diffraction grating has N numbers parallel slits as shown in Figure 2.4. When a monochromatic parallel beam is coming onto the diffraction grating, the incident light is separated to the colors because of the parallel slits. The general form of the transmission diffraction grating equation is;
n λ = d sin(Ɵ)
where the n is the order of diffraction, the λ is wavelength of incident light, d is the distance between the slits of the diffracting element and Ɵ is the angle of diffraction. A light wave with different wavelengths is diffracted at different angles to create a color spectrum. The distance d is different in different types of gratings according to the number of slits per meter, if N is the number of the slits, d=1/N.
Figure 2.4 : Schematic representation of the incoming wave and light going through the
11
Figure 2.5: Simulation of modes formation with diffraction grating for different
wavelengths.
In this project the light from fiber optic cable light passes through a linear diffraction grating (1000 lines/mm, Rainbow Symphony) at an angle of 42° to the normal to reach the smartphone camera.The diffracted light is first-order spectrum and zeroth order is steered away from the camera on purpose as shown in Figure 2.1 and 2.5. The designed spectrometer system is simplified with no collimating lens or mirror components in the light pathway and all components are mechanically aligned with smartphone flash and camera, and with each other.
2.1.3 Camera
LG G4 was used as the smartphone as it has some advantages compared to other smartphones such as, Iphone 5/5s, Samsung Galaxy S6, Motorola Nexus 6. LG G4 has an 16 megapixel camera and the image size is bigger (5312x2988) from the other smartphones. This has almost twice the resolution to the Iphone 5/5s. LG G4 is an overall good smartphone for imaging applications. Lens aperture is an important feature in a camera because it facilitates when shooting in low-light. LG G4 is preferable due to having a manual mode for White Balance, Focus, ISO, Exposure Lock, Exposure Compensation and Shutter Speed. These options allow the user to arrange the image according to different lighting conditions and make taking spectral
12
images easier compared to other brands. For this project, the most important advantage of the chosen smartphone is the RAW image capture capability. The smartphone can take the images as JPEG and RAW (DNG) format at the same time. RAW image is suitable for the studies that the color is so important as can be easily understood from the Figure 2.6. You can set many features of the images with using Adobe Photoshop Lightroom without changing anything on the original images.
(JPEG)
(RAW)
13 2.1.4 Fiber
Polymethyl methacrylate (PMMA) fibers are widely used in optical research. It consists of a high refractive index PMMA core, and it is covered with a thin layer cladding with a low refractive index. The system carries two pieces of plastic (PMMA) fibers: 1.0 mm diameter fiber couples the light from cellphone flash to the cuvette and 0.25 mm diameter fiber collects the transmitted light.
The main advantage of using plastic optical fibers instead of glass-based optical fibers besides the cost is the ability to use them without any special tools for stripping and cutting. Although the plastic fibers do not have a core with a different refractive index, the light is guided due to the air cladding.
2.2 Digital Image Processing
A digital camera uses two-dimensional array of pixels to record an image. When light falls on the pixel, intensity value is calculated with number of photons stored in the pixel. As the pixels are not capable of sorting photons in terms of color, only gray scale images could be created. To capture a color image, color filter array is placed over each pixel that permits only red (R), green (G) or blue (B) primary colors. When light passes through the color filter, only filtered photons are stored in the pixel which gives the intensity value for the respective color. Therefore, each pixel carries single color information: R, G or B. This means one color value at any pixel location is known creating a RAW image. Other missing two color values can be calculated by interpolating from nearby neighbors where those colors are known. By this process, named as demosaicing, RGB values at each pixel location are calculated. After applying post-processing methods, such as white-balance, gamma correction, color space correction and compression, images are converted to commonly used format like JPEG.
Although JPEG image formats have advantages like occupying small size and being instantly displayable, there are certain drawbacks like information loss due to the compression, having a nonlinear RGB color space, (Akkaynak et al., 2014) (Vora, Farrell, Tietz, & Brainard, 1997) and providing only 8-bit color depth. On the
14
contrary, RAW images store original image data without any post-processing and provide 10-14 bits color information. The post-processing steps, which are applied to the RAW image, corrupt the linearity of the information. In a linear image, the intensity value of each pixel is directly related to the number of photons received at that location and is essential for quantitative scientific data acquisition as linear relationship with scene radiance is maintained.
The RAW format is a linear image, but it is not straightforward to work. Therefore, many models are proposed to approximate raw (linear) RGB from nonlinear RGB images based on series of training images taken under different settings and light conditions as well as ground-truth raw images (Kim et al., 2012). Although it is reported that this non-linearity can be overcome by simple transformations for gamma correction, (Yetisen, Martinez-Hurtado, Garcia-Melendrez, da Cruz Vasconcellos, & Lowe, 2014) it has not been verified by other researchers.
In this study, the RAW image format was used to overcome aforementioned limitations of the JPEG format as using raw data enables precise image analysis. The images were processed both in RAW and JPEG formats and impact of formats on image analysis was demonstrated. The key question is how to get a RAW image using a smartphone. Most semi-professional and Professional cameras have capability to store the images in a RAW format, which is unconventional in smartphones. However, recent developments in smartphones provide access to raw image data free from post-processing (Shankland, 2016).
There are a variety of RAW file formats such as ―.NEF" (Nikon), ―.CR2" (Canon) and ―.DNG". Here ―.DNG" format was studied as it is a common open format. Since there is no smartphone app for processing ―.DNG" images in smartphone yet, the images were transferred to a computer to process in Mat-lab environment. To test the reliability of the camera, five consecutive images were captured in JPEG format. Difference in normalized values of images is found to be ± 2.73 % with respect to the average. Therefore, the average of five consecutive images was found to be adequate and was used in processing and analyzing of the experiments in order to improve the reliability of the results. Note that all the images were captured in the same conditions such as the same shutter speed and ISO, and manual mode is selected to prevent any possible post-processing performed by the smartphone. After images are captured in ―.DNG" format, they were first converted to tagged image file format
15
(TIFF) for easier extraction of the R, G, B values of the image with freely available DCRAW software, (Coffin, 2016) which preserves the linear relationship between RAW images and radiance scene. Then, these RGB values were transformed to HSV (Hue-Saturation-Value) as HSV is more robust to illumination variation. Among the H, S and V, V (value) was employed for processing of the image. The value means, for this study, the amount of the transmitted light through the solution. After the line (column or row which corresponds to the maximum irradiance) is selected in the image, the value versus wavelength is plotted.
For the conversion of each pixel index in the image into its corresponding wavelength value, a calibrated fiber-optic spectrometer (HR2000; Ocean Optics, FL, USA) was used with a fluorescent lamp. We used a similar calibration method described in (Grasse, Torcasio, & Smith, 2015), assumed that there is a linear relationship between wavelength value and pixel index, and extracted spectral resolution values for different size plastic fibers. For the same cradle geometry, we obtained different spectral images of the same fluorescent lamp that show different spatial resolutions (Figure 2.7). 0.25 mm plastic fiber provides a resolution of 0.26 nm /pixel while using larger diameter 0.5 and 1.0 mm fibers give spectral resolutions of 0.265 nm /pixel and 0.27 nm /pixel, respectively. Although the spectral line shapes obtained from different sized fibers show fluorescent light characteristics with 4 peaks between 400-700 nm, the spectrum with 0.25 mm plastic fiber closely resembles the spectrum of calibrated spectrometer (Figure 2.8). The spectral resolution and signal-to-noise ratio are directly related to fiber diameter.
Figure 2.7: The spectral images obtained by using different-sized (0.25mm, 0.5mm, 1mm
16
Figure 2.8: The output spectrum comparing the size of fibers used in the smartphone with
that a commercial spectrometer. (HSV means the Value is plotted.)
2.1 Fabrication of PAN/Zeolite Composite Nanofibrous Membranes Methylene Blue consists of cyrstalline powder or dark green cyrstals, having a bronze-like luster. Chemical structure of Methylene Blue is shown in Figure 2.9. The aqueous solution of Methylene Blue is blue and the color gets darker with concentration. This compound can be used as an indicator and also as a bacteriologic stain, in addition to being used as a dye in this study. MB+ is a type of dye with maximum absorption of light around 664 nm.
17
Polyacrylonitrile (PAN), a type of synthetic resin, is prepared with the free radical chain polymerization of the acrylonitrile as shown in Figure 2.10. PAN can be used as coploymers and in fabrics as well as other areas such as in hot gas filtration systems, fiber reinforced concrete structures and sail yachts. The acrylonitrile is a hard, rigid structure and also resistant to various chemicals and most solvents, of low permeability to gases. It may be fabricated using several processes such as polymerisation, spinning, streching and lastly winding.
Zeolites are microporous, aluminosilicate minerals commonly used as commercial adsorbents and catalysts. (Grace, 2010).
Figure 2.10: Structure of Polyacrylonitrile (PAN).
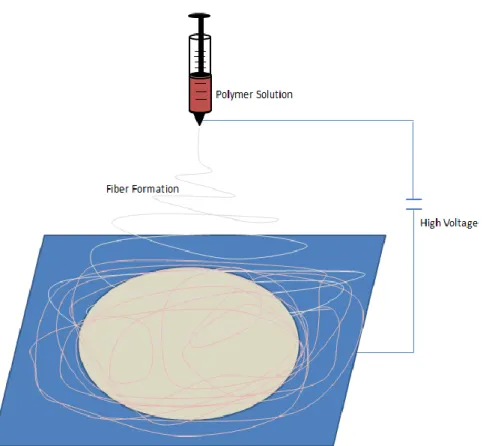
Polyacrylonitrile (PAN, Mw = 150,000 g/mol, Aldrich) solutions were prepared by dissolving 15 wt % PAN powders in N, N-dimethyl formamide (DMF, Aldrich) at room temperature for 1 day. PAN/Zeolite solutions were prepared by adding zeolite powder into the PAN solution. The composite mixture was stirred for 1 h at room temperature. The concentration of zeolite in the polymer solution was 10 wt %. Electrospinning is a type of electrostatic technique that can be used in producing nanofibers with dimensions to the nanometer range. In this technique, polymers are deposited in fiber form. In the electrospinning process, the polymer solution held by its surface tension at the end of the capillary tube, is subjected to an electric field. (Doshi & Reneker, 1995) By the help of this electric field, the polymer solution forms a cone-shape. When the voltage reaches a certain value, jet formation occurs due to deformed solution drops as shown in Figure 2.11. The formation of the fiber depends on the properties of polymer solution, such as molecular-weight distribution, molecular weight, glass transition temperature, solubility, viscosity, viscoelasticity,
18
concentration, surface tension and electrical conductivity. (Greiner & Wendorff, 2007)
Figure 2.11: Schematic representation of the electrospinning setup.
The PAN and PAN/Zeolite nanofibrous membranes were prepared using a commercial platform (Inovenso Basic Setup). The viscous dispersion was loaded in a plastic syringe connected with polyethylene tubing. The feeding rate of the polymer solution was kept at 1.5 mL h-1 for PAN and 3.0 mL h-1 for PAN/Zeolite nanofibers. A potential of 14 kV was applied at a tip-to-collector distance of 20 cm, and the electrospinning time was fixed to 7 minutes to ensure equal thickness. The relative humidity and temperature were 55 % and 26 0C, respectively.
The surface morphology and diameter of the nanofibers were observed by a scanning electron microscope (SEM, FEI Quanta250 FEG). For quantification of average fiber diameters, Fiji-Image J software was used. The elemental composition of the prepared materials was also elucidated using Energy Dispersive X-ray (EDX) analysis. Attenuated total reflection (ATR) infrared (IR) measurements of zeolite, PAN and PAN/Zeolite nanofibers were performed with a Thermo Scientific Nicolet
19
iS5 FTIR spectrometer. The contact angle (CA) measurements were carried out on the nanofibers with KSV Attension Theta Lite Optical Tensiometer.
2.2 Adsorption Studies of PAN/Zeolite Composite Nanofibers
The catalytic activity of the zeolite in the form of nanofibrous mat was examined employing a model redox reaction of methylene blue (MB, Merck) and sodium borohyride (NaBH4, Aldrich). For the reduction of MB, a mixture containing aqueous
solution of MB (3 mL, 7.5 ppm) and NaBH4 (1 mL, 3.8 ppm) was prepared in a quartz cuvette. The nanofiber catalyst (6.0 mg), PAN or PAN/Zeolite, was added to an aqueous solution of MB and NaBH4. The smartphone-based spectrometer system was designed for screening the reaction kinetics by measuring their timedependent absorption spectra. Hence at certain time intervals, the spectral images of the dye solutions were taken. The performance of the smartphone spectrometer was compared with a calibrated spectrometer.
20
3. RESULTS
3.1 MB Absorption Studies
While light passes through a sample, transmitted light is reduced when atoms or molecules in the sample absorb the energy of the photons possess. Generally, the transmitted light is reduced exponentially according to distance traveled by light and the concentration of the sample. That’s why transmitted light is expressed in percentage scale and found by
%T = [(Transmitted Light / (Incident Light]*100 (1)
According to Beer-Lambert Law, the transmittance and the absorbance are related to each other as a function of negative logarithm, base 10. The absorbance is directly related to the path length of light and the concentration of the analyte.
Absorbance = 2- (T) (2)
Moreover, absorbance is a function of the intensity of the transmitted light through the reference solution and the intensity of the transmitted light of the sample solutions.
Absorbance = = εlc (3)
is the intensity of the light passing through the reference cell such as distilled water, and is the transmitted light intensity of the solutions used in varying concentrations in the experimental setup as shown in Fig. 3.1.
21
Figure 3.1: In-detailed presentation of how light is absorbed through the sample cuvvette. The most important indicator for dyes or contaminant is the color change with respect to the concentration, since the number of molecules or atoms interact with the
coming light source affects the range of the light absorbed. If the solution is quite concentrated, the absorbance value becomes excessive. On the contrary if we choose a dilute solution, the absorbance value is much lower than the concentrated solutions.
As shown in Eq.3, the path length of the light is also important since the number of molecules along the path that can be encountered and the probability of the interaction with the undesirable molecules increase. Hence the path length should be
fixed for all steps of the experiment.
In this thesis, the absorption of the Methylene Blue solutions by smartphone light source was observed by varying of the concentrations of the methylene blue. The range of the concentration of the MB was decided according to the sensitivity of the smartphone, then MB solutions were selected as 0.1, 0.5, 1.0, 2.5, 5.0, 7.5, 10.0 ppm (particles per million). The color is noticeably varying with the increasing of the concentration value; this means the number of dye particles is increasing in the solutions. From low to high concentration is shown Fig. 3.2 with varying the color, with increasing the concentration of the MB, color becomes darker gradually.
22
Figure 3.2:The photographic images of MB solutions from 0.1 to 10 ppm with increasing
concentration and color intensity.
Figure 3.3:The spectral images of MB solutions from 0.1 to 10 ppm, from left to right.
In this thesis, by using a 0.25 mm plastic PMMA fiber, the spectral images were taken by smartphone camera as shown in Fig. 3.3. The brightness of red part of the spectrum is gradually decreasing as it goes from low concentration to high concentration because the characteristic absorption of MB is 664 nm that corresponds to the red part of the spectrum. Hence the end part of the spectrum was mainly observed during the experiment and due to non-linear sensitivity of the smartphone camera to the wavelength, the blue and the green part of the spectrum were saturated. In this study, the multicolored images were taken and processed to obtain the absorbance spectrum which was calculated using the Beer-Lambert Law as shown in Eq. 3. The spectrum obtained from the smartphone spectrometer was compared with a commercial spectrometer from Ocean Optics. By using the same MB concentrations, the spectrums were obtained by these two spectrometers shown in Fig. 3.4. The characteristic absorption of MB around 664 nm is similar in both spectra for low concentrations such as 0.1 ppm to 5.0 ppm. However at high concentrations the MB spectrums are slightly separated.
23
Figure 3.4:Absorbance spectrums obtained from smartphone and commercial spectrometers for serial dilutions.
The calibration curves for the MB solutions measured by the smartphone and commercial spectrometers are shown in Fig. 3.5, with regression coefficients of 0.998 and 0.997, respectively. The regression coefficient is statistical adjacency of the data to the fitted line and is also known as squared. The definition of R-squared can also be thought by a linear model as the percentage of the response variations. R-squared can be calculated by dividing the explained variation by total variation. This coefficient is always between 0 and 1 corresponding to 0% and 100% respectively. The higher the value the better model is for fitting your data. Although the R-squared values represent nearly perfect linear relationships, a small shift is obvious in absorptivity. This shift was reported before by (Kenneth D. Long, Hojeong Yu, & Brian T. Cunningham, 2014) (Grasse et al., 2015) as due to internal filters of smartphone camera and non-linear responsivity of the sensor. Looking at this shift, using the same smartphone in the whole experiment is suggested for the absorptivity of this analyte.
Limit of Detection is the lowest analyte concentration likely to be reliably distinguished and at which detection is feasible. (Armbruster & Pry, 2008) In this
24
study, the limit of detection (LOD) was calculated as 0.5 ppm which corresponds three times the standard deviation of distilled water (Ingle Jr, 1974). The sensitivity of the smartphone spectrometer system was found to be 0.1817/ppm that is also the slope of the fitted absorption line (RAW) as shown in Fig. 3.5. For our system, the dynamic range of the sensing is 0.5-10 ppm.
Figure 3.5:The absorbance at 664 nm was measured by smartphone spectrometer in RAW
and JPEG formats and one commercial spectrometer. LOD was calculated as three standard deviations above the distilled water measurement
In JPEG format, some properties of the image, such as white balancing, are changed internally by the camera proprietary software. To test the efficiency of the JPEG image format in absorbance measurements, images captured for different concentration values were processed. As illustrated in Fig. 3.5, the absorbance values obtained from spectral images in JPEG format shows a non-linear relationship fitted to a second-degree polynomial as opposed to the RAW format. Moreover, due to image postprocessing during JPEG image reconstruction, the data spectrum at 664 nm for 10 ppm concentration shows zero transmission, and hence fails to supply an absorbance value. This is the main reason the RAW images from smartphone camera were used.
25
3.2 Characterization of PAN/Zeolite Composite Nanofibrous Membranes
SEM micrographs of zeolite powder, nanofibers of PAN and PAN/Zeolite are shown in Fig. 3.7 a-c. The zeolite powder was composed of nanosized zeolite particles. The PAN nanofibers were smooth and uniform with average diameter of 340±50 nm. The diameter of the PAN/Zeolite nanofibers increased to 550±95 nm due to the addition of zeolite into the PAN solution. Zeolite particles were uniformly distributed without any aggregation along the fibrous membrane. Furthermore, the energy dispersive X-ray spectrometer (EDS) spectrum shows oxygen, silicon, and aluminum signals for the PAN/Zeolite nanofibers in Fig. 3.6 a-c. The distribution of the additional elements in the mapping image indicates the successful incorporation of the zeolites into the nanofibers. The inset images in Figs. 3.7 a-c show the CAs of the PAN and PAN/Zeolite composite nanofibers. The PAN fibrous membrane showed a CA around 92°, whereas the composite membranes with 10 wt % zeolite content showed a CA around 86°. The decrease in the CA of the composite nanofibrous mat is due to the hydrophilic nature of the zeolites. (Lopes, Ribeiro, Sencadas, Botelho, & Lanceros-Méndez, 2014) The FTIR spectra of nanofibers of PAN and PAN/Zeolite, as well as the zeolite powder are presented in Fig. 3.8. The broad bands in the range of 3000 - 3600 cm-1 is due to the water and hydroxyl groups. The corresponding bending vibration of water molecules occurs at 1665 cm-1. The band at 1020 cm-1 is attributed to the asymmetric stretching of SiO4 and AlO4 tetrahedra for the zeolite.
(Jacobs, Flanigen, Jansen, & van Bekkum, 2001) A characteristic band of nitrile groups in PAN chain at 2240 cm-1 is present on the surface of both nanofibers. The absorption bands observed at 2930 and 1460 cm-1 are due to the C-H bonds. In the spectra of composite nanofibers, a new absorption band appeared at 1040 cm-1 supporting the successful zeolite modification.
26
Figure 3.6 The EDS spectrum and elemental mapping of the (a) zeolite powder, (b) PAN
27
(a) (b) (c)
Figure 3.7:SEM micrographs of (a) zeolite powder, (b) PAN nanofibers, (c) PAN/Zeolite nanofibers
Figure 3.8: FTIR spectra of the materials.
3.3 Adsorption of MB by Electrospun Nanofibers
The catalytic activity of the PAN/Zeolite composite nanofibers was tested in a model reaction taking place between MB dye and the reducing agent of NaBH4. The
reduction of MB occurs in the presence of a catalyst even if there is a reducing agent in the reaction medium(Demir, Uğur, Gülgün, & Menceloğlu, 2008) (Berber, Horzum, Hazer, & Demir, 2016). In order to understand the catalytic activity of the
28
PAN/Zeolite composite nanofibers, this reaction was selected for observation. The intensity of MB absorption band at 664 nm was again followed by measuring the optical density of the solution. Fig. 3.9 shows the variations in the absorbance spectra of MB solution in the presence of PAN and PAN/Zeolite nanofibers. There is an initial drop in MB absorbance due to addition of NaBH4. In the case of PAN
nanofibers, the absorbance stays unchanged for the duration of 12 minutes. On the other hand, using PAN/Zeolite nanofibers, the characteristic absorption peak of MB decreases as a function of time corresponding to a concentration reduction from the initial value of 6.45±0.38 ppm to 1.72±0.14 ppm. Inset spectrograms show the images taken from initial MB solution and reduced MB solution after adsorption by using PAN/Zeolite nanofibers.
Fig. 3.10 illustrates the photographs of the MB solutions containing PAN or PAN/Zeolite nanofibers after 15 minutes. In line with these results, the bright blue color of MB turned to a lighter color indicating the consumption of MB in the medium by the redox reaction. The blue color of PAN/Zeolite nanofibers is a also clear sign for the physical adsorption of the dye on the nanofibrous mat. The color of MB solution containing PAN nanofibers showed almost no change.
29
(Inset: The color bands observed on the smartphone screen at initial and 15 minutes)
Figure 3.10:The photographic image showing the color of the fibrous mats and the resultant solutions after adsorption.
31
4. CONCLUSION
The goal of this thesis was to develop a new, easily applicable detection technique to assess the quality of water, and this is the one of the colorimetric detection techniques. Colorimetry is used the color of water to analyze the effects of contaminants. With this technique, users can easily test the quality of water with a few process from the their own smartphone. Besides drinking, in many areas, it is so necessary to use clean and pure water. The purity and cleanliness of an aquatic resource and what values it should have depends on the country, region and area of use. The negative effects of water contaminants on the health of the living things were discussed in detail.
It is focussed on to design an ultra-low cost, portable, plastic fiber based smartphone spectrometer platform for investigation of MB dye adsorption using electrospun PAN/Zeolite composite nanofibers. We demonstrated the effect of fiber size on the spatial and spectral resolution. We processed color spectrum images in RAW and JPEG formats, showed that RAW format is preferred for absorbance experiments, and obtained a dynamic range of 0.5 to 10 ppm. The sensing platform was able to detect down to 0.5 ppm, with a sensitivity of 0.1817/ppm. The PAN/Zeolite nanofibers showed higher catalytic activity than those of PAN due to the presence of zeolite nanoparticles having high ion exchange capacity and enhanced surface area. The results of this study indicate that the proposed smartphone spectrometer is capable of replacing benchtop spectrometers for field-deployable instrumentation for environmental sustainability. The cost of the proposed cradle could be further decreased by using an alternative manufacturing method, such as injection molding. We envisage this strategy for numerous applications such as water treatment management, point-of-care sensing, performance and lifestyle monitoring.
33
5. REFERENCES
Akkaynak, Derya, Treibitz, Tali, Xiao, Bei, Gürkan, Umut A, Allen, Justine J, Demirci, Utkan, & Hanlon, Roger T. (2014). Use of commercial off-the-shelf digital cameras for scientific data acquisition and scene-specific color calibration. JOSA A, 31(2), 312-321.
Alver, Erol, & Metin, Ayşegül Ü. (2012). Anionic dye removal from aqueous solutions using modified zeolite: Adsorption kinetics and isotherm studies. Chemical Engineering Journal, 200, 59-67.
Armbruster, David A, & Pry, Terry. (2008). Limit of blank, limit of detection and limit of quantitation. Clin Biochem Rev, 29(Suppl 1), S49-52.
Ayad, Mohamad M, & El-Nasr, Ahmed Abu. (2010). Adsorption of cationic dye (methylene blue) from water using polyaniline nanotubes base. The Journal of Physical Chemistry C, 114(34), 14377-14383.
Berber, Emine, Horzum, Nesrin, Hazer, Baki, & Demir, Mustafa M. (2016). Solution electrospinning of polypropylene-based fibers and their application in catalysis. Fibers and Polymers, 17(5), 760-768.
Berg, Brandon, Cortazar, Bingen, Tseng, Derek, Ozkan, Haydar, Feng, Steve, Wei, Qingshan, . . . Lewinski, Michael. (2015). Cellphone-based hand-held microplate reader for point-of-care testing of enzyme-linked immunosorbent assays. ACS nano, 9(8), 7857-7866.
Bremer, Kort, & Roth, Bernhard. (2015). Fibre optic surface plasmon resonance sensor system designed for smartphones. Optics express, 23(13), 17179-17184.
Burger, Christian, Hsiao, Benjamin S, & Chu, Benjamin. (2006). Nanofibrous materials and their applications. Annu. Rev. Mater. Res., 36, 333-368.
Coffin, D. (2016). Decoding raw digital photos in Linux. from https://www.cybercom.net/dcoffin/dcraw/
Contreras-Naranjo, Jose C, Wei, Qingshan, & Ozcan, Aydogan. (2016). Mobile phone-based microscopy, sensing, and diagnostics. IEEE Journal of Selected Topics in Quantum Electronics, 22(3), 392-405.
Demir, Mustafa M, Uğur, Gökçe, Gülgün, Mehmet Ali, & Menceloğlu, Yusuf Z. (2008). Glycidyl‐Methacrylate‐Based Electrospun Mats and Catalytic Silver Nanoparticles. Macromolecular Chemistry and Physics, 209(5), 508-515. Doshi, Jayesh, & Reneker, Darrell H. (1995). Electrospinning process and
applications of electrospun fibers. Journal of electrostatics, 35(2-3), 151-160. Goel, PK. (2006). Water pollution: causes, effects and control: New Age
International.
Grace, WR. (2010). Co. Enriching Lives, Everywhere. Zeolite Structure.
Grasse, Elise K, Torcasio, Morgan H, & Smith, Adam W. (2015). Teaching UV– Vis Spectroscopy with a 3D-Printable Smartphone Spectrophotometer. Journal of Chemical Education, 93(1), 146-151.
34
Greiner, Andreas, & Wendorff, Joachim H. (2007). Electrospinning: a fascinating method for the preparation of ultrathin fibers. Angewandte Chemie International Edition, 46(30), 5670-5703.
Gunda, Naga Siva Kumar, Naicker, Selvaraj, Shinde, Sujit, Kimbahune, Sanjay, Shrivastava, Sandhya, & Mitra, Sushanta. (2014). Mobile Water Kit (MWK): a smartphone compatible low-cost water monitoring system for rapid detection of total coliform and E. coli. Analytical Methods, 6(16), 6236-6246.
Hong, Jong Il, & Chang, Byoung-Yong. (2014). Development of the smartphone-based colorimetry for multi-analyte sensing arrays. Lab on a Chip, 14(10), 1725-1732.
Horzum, Nesrin, Boyacı, Ezel, Eroğlu, Ahmet E, Shahwan, Talal, & Demir, Mustafa M. (2010). Sorption efficiency of chitosan nanofibers toward metal ions at low concentrations.
Horzum, Nesrin, Mu oz-Espí, Rafael, Glasser, Gunnar, Demir, Mustafa M, Landfester, Katharina, & Crespy, Daniel. (2012). Hierarchically structured metal oxide/silica nanofibers by colloid electrospinning.
Hossain, Md Arafat, Canning, John, Cook, Kevin, & Jamalipour, Abbas. (2016). Optical fiber smartphone spectrometer. Optics letters, 41(10), 2237-2240.
Huang, Zheng-Ming, Zhang, Y-Z, Kotaki, M, & Ramakrishna, S. (2003). A review on polymer nanofibers by electrospinning and their applications in nanocomposites. Composites science and technology, 63(15), 2223-2253. Ingle Jr, JD. (1974). Sensitivity and limit of detection in quantitative spectrometric
methods. J. Chem. Educ, 51(2), 100.
Jacobs, PA, Flanigen, Edith M, Jansen, JC, & van Bekkum, Herman. (2001). Introduction to zeolite science and practice (Vol. 137): Elsevier.
Kim, Seon Joo, Lin, Hai Ting, Lu, Zheng, Süsstrunk, Sabine, Lin, Stephen, & Brown, Michael S. (2012). A new in-camera imaging model for color computer vision and its application. IEEE Transactions on Pattern Analysis and Machine Intelligence, 34(12), 2289-2302.
Kumar, N. (2014). Impact of the Dye industry on the Environment. from https://www.slideshare.net/NehaKumar09/impact-of-the-dye-industry-on-the-environment
Long, Kenneth D, Yu, Hojeong, & Cunningham, Brian T. (2014). Smartphone instrument for portable enzyme-linked immunosorbent assays. Biomedical optics express, 5(11), 3792-3806.
Long, Kenneth D., Yu, Hojeong, & Cunningham, Brian T. (2014). Smartphone instrument for portable enzyme- linked immunosorbent assays. Biomedical Optics Express, 5(11), 3792-3806. doi: 10.1364/BOE.5.003792
Lopes, AC, Ribeiro, Clarisse, Sencadas, Vitor, Botelho, Gabriela, & Lanceros-Méndez, Senentxu. (2014). Effect of filler content on morphology and physical–chemical characteristics of poly (vinylidene fluoride)/NaY zeolite-filled membranes. Journal of Materials Science, 49(9), 3361-3370.
35
Rao, Dubasi Govardhana, Senthilkumar, R, Byrne, J Anthony, & Feroz, S. (2012). Wastewater treatment: advanced processes and technologies: CRC Press.
Robinson, Tim, McMullan, Geoff, Marchant, Roger, & Nigam, Poonam. (2001). Remediation of dyes in textile effluent: a critical review on current treatment technologies with a proposed alternative. Bioresource technology, 77(3), 247-255.
Schaefer, Samuel. (2014). Colorimetric water quality sensing with mobile smart phones. University of British Columbia.
Shankland, S. (2016). How Android 5.0 lets you get raw for better photos. from http://www.cnet.com/news/android/lollipop/opens/highend/photography/opti ons/
Shen, Li, Hagen, Joshua A, & Papautsky, Ian. (2012). Point-of-care colorimetric detection with a smartphone. Lab on a Chip, 12(21), 4240-4243.
Vora, Poorvi L, Farrell, Joyce E, Tietz, Jerome D, & Brainard, David H. (1997). Digital color cameras—1—Response models: Citeseer.
Wang, Yi, Liu, Xiaohu, Chen, Peng, Tran, Nhung Thi, Zhang, Jinling, Chia, Wei Sheng, . . . Liedberg, Bo. (2016). Smartphone spectrometer for colorimetric biosensing. Analyst, 141(11), 3233-3238.
Yagub, Mustafa T, Sen, Tushar Kanti, Afroze, Sharmeen, & Ang, Ha Ming. (2014). Dye and its removal from aqueous solution by adsorption: a review. Advances in colloid and interface science, 209, 172-184.
Yetisen, Ali K, Martinez-Hurtado, JL, Garcia-Melendrez, Angel, da Cruz Vasconcellos, Fernando, & Lowe, Christopher R. (2014). A smartphone algorithm with inter-phone repeatability for the analysis of colorimetric tests. Sensors and Actuators B: Chemical, 196, 156-160.
Yu, Hojeong, Tan, Yafang, & Cunningham, Brian T. (2014). Smartphone fluorescence spectroscopy. Analytical chemistry, 86(17), 8805-8813.
36 CURRICULUM VITAE
Name Surname : GİZEM KOCAKUŞAK ÖZDEMİR
Place and Date of Birth : Ankara, 13 JUNE 1989
Adress : KARŞIYAKA/İZMİR
E-Mail : [email protected]
EDUCATION :
B.Sc. : 2014, METU, Faculty of Arts and Science, Physics
PUBLICATIONS:
Kocakuşak Özdemir G., Bayram A., Kılıç V., Horzum N., Solmaz E. M.
2016:Smartphone-based detection of dyes in water for environmental sustainability, Journal of Analytical Methods, Royal Society of Chemistry, 2017,9, 579-585.
Mutlu A., Kılıç V., Kocakuşak Özdemir G., Bayram A., Horzum N., Solmaz E. M. 2017: Smartphone Based Colorimetric Detection via Machine Learning,