STRONG EMPLOYMENT INCREASES IN SERVICES
Seyfettin Gursel*, Gokce Uysal∗∗ and Aysenur Acar∗∗∗ Executive Summary
According to the labor market statistics released by TurkStat, non-agricultural unemployment rate is 11.4 percent in the period of November 2011. Seasonally adjusted labor market data shows that
non-agricultural unemployment rate fell by 0.3 percentage points and decreased from 11.6 percent to 11.3 percent during November 2011 compared to the period of October 2011. The decrease in non-agricultural unemployment is caused mainly by a strong employment increase of 158 thousand in the service sector during the period of November.
Increase in non-agricultural employment continues
According to the labor market statistics released by TurkStat on the 15th of February, non-agricultural employment has reached 18 million 277 thousand in the period of November 2011 (October – November – December). Raw labor market statistics reveal that non-agricultural labor force increased by 731 thousand (3.7 percent), non-agricultural employment increased by 1 million 105 thousand (6.4 percent) and non-agricultural unemployment rate decreased from 13.7 percent to 11.4 percent during this period on a year-on-year basis (Figure 1). The number of unemployed persons in non-agricultural decreased by 374 thousand to 2 million 352 thousand on a year-on-year basis. Note that there have been strong
increases in non-agricultural employment since June 2011, averaging to about 1 million on a yearly basis. Figure 1 Year-on-year changes in non-agricultural labor force, employment and unemployment
Source: TurkStat, Betam
*
Prof. Seyfettin Gürsel, Betam, Director, [email protected] ∗∗ Assoc. Prof. Gökçe Uysal, Betam, Vice Director, gokce.uysal @bahcesehir.edu.tr ∗∗∗ Aysenur Acar, Betam, Research Assistant, [email protected]
Labor Market Outlook:
February 2012
Seasonally adjusted non-agricultural unemployment decreased
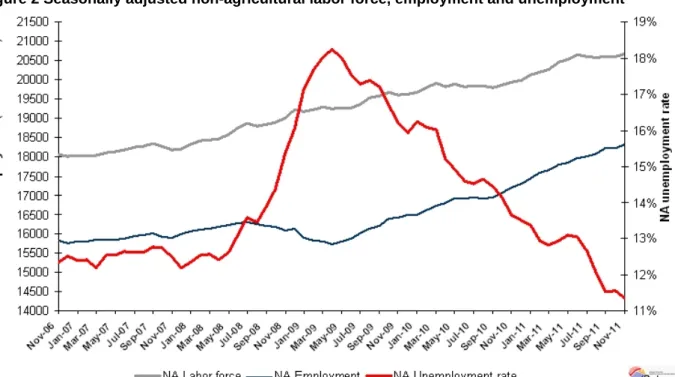
According to seasonally adjusted series, non-agricultural labor force increased by 78 thousand and reached 20 million 672 thousand in November compared to its level in October (Figure 2, App. 1 Table 1). Non-agricultural employment increased by 113 thousand and reached 18 million 327 thousand.
Consequently, the number of unemployed persons in non-agricultural sectors decreased by 35 thousand and seasonally adjusted non-agricultural unemployment rate decreased from 11.6 percent to 11.3 percent (0.3 percentage points).
Figure 2 Seasonally adjusted non-agricultural labor force, employment and unemployment
Source: TurkStat, Betam
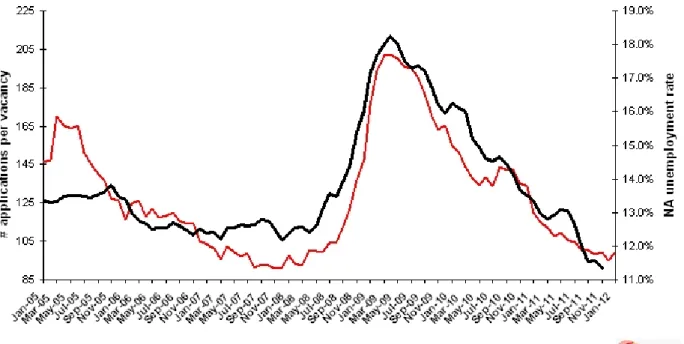
According to Kariyer.net data, non-agricultural unemploymentwill stagnate in the period of December 20111
The application per vacancy series released by Kariyer.net stagnate in November, decrease in December 2011 and increase in January 2012. In light of this data, we believe that the decrease in non-agricultural unemployment rate will stagnate in the period of December 2011.
1
Starting from April, Betam will be using a new series released by Kariyer.net on application per vacancy. Kariyer.net collects this data via their website which is one of the largest job search engines in Turkey. Given the lack of data on vacancies in Turkey, we believe that this new series will provide useful insight to the labor market in Turkey. It provides information on the number of unemployed who are actively seeking work as well as the number of jobs that are available in the labor market. A decrease in applications per vacancy may be caused by an increase in vacancies or by a decrease in the number of applications. An increase in vacancies signals economic growth while decreasing number of applications indicates a decrease in number of people looking for a job. Figure 3 illustrates the seasonally adjusted non-agricultural unemployment rate and deseasonalized calendar day adjusted application per vacancy (Kariyer.net) series. It is clear that these series are highly correlated (almost 90 percent).
Figure 3 Non-agricultural unemployment rate and application per vacancy (SA)
Data source: Kariyer.net, TurkStat, Betam
Strong employment increase in services
According to seasonally adjusted figures, employment in construction has decreased by 97 thousand in the period of October compared to the period of September (App. 1 Table 2, App. 2 Figure 4)2.Remember that the employment in construction decreased by 37 thousand in the period of November 2011. These numbers cumulate to a decrease of 133 thousand, i.e. 8 percent employment loss in construction in the last two periods. We can say that the correction that we had been expecting in construction continues. Service employment increased by 158 thousand in the period of November compared to its level in October. This is the largest increase that we have observed on a monthly basis since the beginning of year 2005. The large increase in the non-agricultural employment stems from employment increases in services and in manufacturing (by 37 thousand).
2
Seasonal adjustment procedure is applied to each sector of employment series separately. Hence the sum of these series may
differ from the seasonally adjusted series of total employment. The difference stems from the non-linearity of the seasonal adjustment process.Appendix 1: Table 1 Seasonally adjusted non-agricultural labor force indicators (in thousands)
Appendix 1: Table 2 Seasonally adjusted sector of employment (in thousands)
Appendix 2: Figure 4 Employment changes in sectors (in thousand)3
Source: TurkStat, Betam
3