On the Predictive Power of the Yield Spread for Future Growth and
Recession: The Turkish Case
BETAM WORKING PAPER SERIES #010
MARCH 2013
On the predictive power of the yield spread for future growth and recession: The Turkish Case Hüseyin Kaya Bahcesehir University e-mail: [email protected] Tel: +902123810497 Fax: +902123810020 Abstract
This paper investigates the predictive power of the yield spread on future industrial production growth and recession in Turkey. Employing the linear regression model we find that the yield spread has predictive power when forecasting industrial production growth. The results also suggest that in the inflation targeting monetary policy period, predictive power of the yield spread has increased. Furthermore, we investigate whether the yield spread predicts recession by employing a probit model. Since no official recessions are available in Turkey, we determine the recessions using the BBQ methodology. The findings suggest that the yield spread predicts the recessions one year ahead.
JEL classifications: C22, E37, E43
Keywords: yield curve, recession, growth, forecast
1. Introduction
In the 1980s the course of the inverted yield curve in the US, gives rise to a debate over the usefulness of the slope of the yield curve as an indicator for economic slowdown and leads to a new branch of research in which the information content of the term structure of interest rates on future economic activity is investigated.
The expectation hypothesis and the liquidity premium theory provide an explanation for why the slope of the yield curve has predictive power on future economic activity. By nesting both theories the linkages between the short rate and the long rate can hence be represented as;
(1)
where n-period interest rate at time t, , is the average of the expected short-term interest rates and the liquidity premium, , for the n-period bond at time t. The first term of the right hand side of the equation comes from the expectation hypothesis and the second term comes from the liquidity premium theory. The expectation hypothesis suggests that the long term interest rate is the average of the expected short term interest rates. On the other hand, the liquidity premium theory suggests that since investors are usually risk-averse, they must be paid by a positive premium. Given that the liquidity premium, , is greater than zero and increasing with the maturity, the yield curve will be upward sloping when the expected short rates are constant.
If the liquidity premium is zero, all the variations in the long-term interest rates are explained by the expectation hypothesis. For the sake of simplicity, suppose that is equal to zero then the inverted yield curve is present when the expected short rates are lower than the short rate. Low short rates are typically associated with the economic slowdown because slowed economic activities decrease the demand of credit and, monetary authority reacts to the economic slowdown by reducing the policy rate as suggested in Taylor (1993). Therefore, the inverted yield curve under the positive liquidity premium implies an expected economic slowdown (Chinn and Kucko, 2010).
In this paper we investigate the predictive power of the yield spread both on growth and recession in Turkey. Firstly, following the literature, we employ the linear regression model to assess the predictive power of the yield spreads on the future industrial production growth. Secondly, we investigate whether the yield spread predicts recession. For this purpose we employ a probit model. Since no official recessions are available in Turkey, we determine the recessions using the BBQ methodology.
The contribution of this paper to the existent literature is twofold. First, to our knowledge, no previous study investigates this relationship for Turkey. Considering the fact that almost all the studies in the literature analyze the case of developed countries, by focusing on an emerging market as Turkey, this paper also contributes for filling this gap. Second, using a nonparametric technique namely the BBQ method, this paper determines recessions in monthly base over the period of 1986-2011 in Turkey.
The rest of the paper consists of five sections. In first section we provide the related literature. In second we describe the data. In third section we provide the linear model and estimation
results. In fourth section we determine recessions and report the empirical results for the recession predictions. In last section we conclude.
2. Related Literature
Harvey (1988) shows that the term structure of ex-ante real rates of interest contains information about the future real consumption and economic growth. He finds that the real term structure has more information and more predictive power than the lagged consumption growth and the lagged stock returns. Estrella and Hordauvelis (1991) suggest that the term structure has predictive power than the lagged output growth, the lagged inflation, the leading indicator index and the level of real short term interest rate on future growth. Friedman and Kutner (1991) investigate the relationship between spread of 6-month commercial paper rate and 3-month T-bill rate and find that the spread has explanatory power on real economic activity. Additionally, they show that the spread widens in the business cycles period and narrows in the recovery period. Plosser (1994), Bonser at al (1997), Estrella and Mishkin (1998), Peel and Taylor (1998), Estrella at al. (2003), Bordo and Haunrich (2004), Giacomini and Rossi (2005) and Ang et al. (2006) among others, analyze the linear relationship between the term structure of interest rates and output growth and conclude that the slope of the yield curve has significant predictive power on future real economic activity.
The literature also investigates the policy effects on the relationship between the yield spread and future growth. For example, Gamber (1996) shows that the term structure of interest rates has independent predictive power only when FED does not react to change in the yield curve. The findings of Kim and Limpaphayom (1997) suggest that the policies toward economy affect the predictive power of the term structure of interest rates. Peel and Ioannidis (2003) find that the anti-inflation policy reduces the predicative ability of the yield spread on future growth. Bordo and Haubrich (2004) show that when the credibility is low and the inflation persistence is high then the predictive power of the term structure on growth is high. The findings of Estrella (2005) suggest that the extent to which the yield curve is a good predictor depends on the form of the monetary policy reaction function, which in turn may depend on the explicit policy objectives. Thus, the predictive relationships, though robust, are not structural. Moersh and Pohl (2011) find that the predictive character of the yield spread is not solely a result of its link with the monetary policy, instead, the yield spread contains independent information about recession.
Recently, Chinn and Kucko (2010) reinvestigate the predictive power of the slope of the yield curve for Canada, France, Germany, Italy, Japan, Netherlands, Sweden, the UK and the US. Employing the linear regression model, they find that the yield spread has significant predictive power on growth over one-year time horizon and this predictive power varies across countries and during time. They show that the relationship between the yield spread and growth has declined in the recent years which provides some evidence to conviction that the slope of the yield curve loses its predictive power in the recent years as the credibility of monetary policy increases.
Another quantity of research is devoted to investigate whether the slope of the yield curve predicts recessions. Using probit model, Estrella and Mishkin (1998), Bernard and Gerlach (1998), Esrella at al. (2003), Montea (2005), Wright (2006), Chinn and Kucko (2010), Moersh and Pohl (2011) among others, show that the yield spread predicts recessions. Chauvet and Potter (2002) employ a probit model to examine the stability of recession forecasts under the presence of a structural break. They find strong evidence of a break which affects considerably recession predictions. Nyberg (2010) employing a dynamic probit model, which accounts autoregressive structure, finds that the yield spread is a useful predictor for recessions.
3. Data
The yield data consists of monthly observation of annual interest rates over the period 1993:M1-2011M8. To construct the yields, we use Treasury bond rates with maturities 1, 3 and 12-month for all periods and 24-month for only post-2002 period. All yields are continuously compounded and n-month maturity yield denoted by y n . The interest rate data has been obtained from Riskturk on a daily basis1 and monthly averages are used in the estimation. As discussed in Telatar et al. (2003) it is not possible to find interest rates for longer maturities in the Turkish economy, especially for the 90s mainly because of the lack of deep
1 In constructing the yield curve official bond market data has been collected from Istanbul Stock Exchange.
Since the Turkish Fixed Income Bill and Bonds are traded in an official exchange (more information can be found at http://www.ise.org) a reliable official data exists and the market is rather liquid for an emerging market. Once the official data is obtained from the ISE, the spot yields are solved. More details can be found in
financial market, high levels of uncertainty and political instability2. The same is true even for the early periods of 2000s.
Figure 1: Yields over the period 1993:01-2011:08
To capture the growth of real activity we use Industrial Production Index (IPI) which is obtained from the International Financial Statistics of IMF (IFS). In order to eliminate seasonal patterns, following the method of Pagan (2010), we use the average;
∑
. Pagan (2010) argues that this method isolates business cycles quite well.
Leading indicator index is obtained from Central Bank of Turkey (CBT). We calculate the real interest rate using the Fisher equation. The calculation of real rate is as follows: [(1+ 3 )/(1+inflation)]-1. Since the expected inflation is not available during this period, we proxy it by the current inflation rate. The current inflation rate is calculated using Consumer Price Index (CPI). The CPI is seasonally adjusted and obtained from the IFS.
4. Predictive power of the yield spread on future growth
We employ the following model, which is commonly used in the literature, to investigate the predictive power of the yield spreads on the future IPI growth;
2 For an overview of the Turkish economy during this period, see Telatar et al. (2003) and, Kaya and Yazgan
(2011). 0.0 0.4 0.8 1.2 1.6 2.0 2.4 1994 1996 1998 2000 2002 2004 2006 2008 2010 y(1) y(12) y(24)
(2)
where is k period annualized future growth rate and defined as . is the spread between the long rate and the short rate. Considering the available maturities of interest rates, we construct the spread as 12 1 . The equation (2) tells that the yield spread at time t predicts the annual growth rate of IPI from time t to time period t+ k months. We examine the equation (2) with k equal to 6, 12, 18 and 24 (i.e. growth over 6, 12, 18 and 24 month time horizons). Since overlapping periods are used in the estimation, the resulting error terms will be serially correlated. In order to account for both the serial correlation and the heteroscedasticity, we use the HAC standard errors.
In addition to simple univariate regression analysis, we wish to investigate the marginal predictive power of the yield spread when other leading indicators are introduced into equation. Thus, we estimate the following equation:
(3)
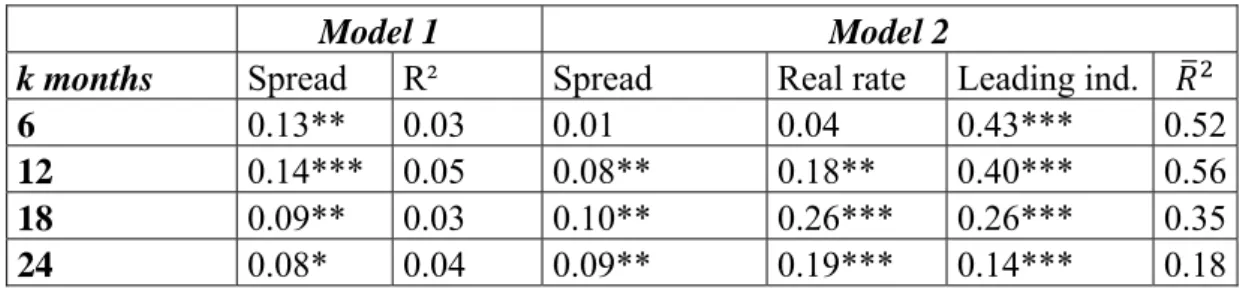
where L is the six-month change in the leading indicator index and R is the real interest rate. We denote the univariate model as Model 1 and the multivariate model as Model 2. Table 1 documents the estimation results of Model 1 and Model 2.
Table 1: Predictive Power of the Slope of the Yield Curve (1993M1-2011M8)
Model 1 Model 2
k months Spread R² Spread Real rate Leading ind.
6 0.13** 0.03 0.01 0.04 0.43*** 0.52
12 0.14*** 0.05 0.08** 0.18** 0.40*** 0.56
18 0.09** 0.03 0.10** 0.26*** 0.26*** 0.35
24 0.08* 0.04 0.09** 0.19*** 0.14*** 0.18
-***, **, *: Indicates that the null of no predictive power is rejected at 1%, 5% and 10 % significance levels.
The results of the univariate model suggest that the coefficient of the yield spread is significant for all time horizons which indicate that the yield spread may hold some forecasting value. The coefficient of the yield spread implies that, for example, one percentage increase in the yield spread increases the industrial production index 0.14 percent over one year. However, the explanatory power of the yield spread is very low.
The coefficient of spread estimated from the multivariate regression model is significant for all time horizons but six months, suggesting that the yield spread continues to exhibit predictive information for future growth. Adding the real rate and the leading indicator to the
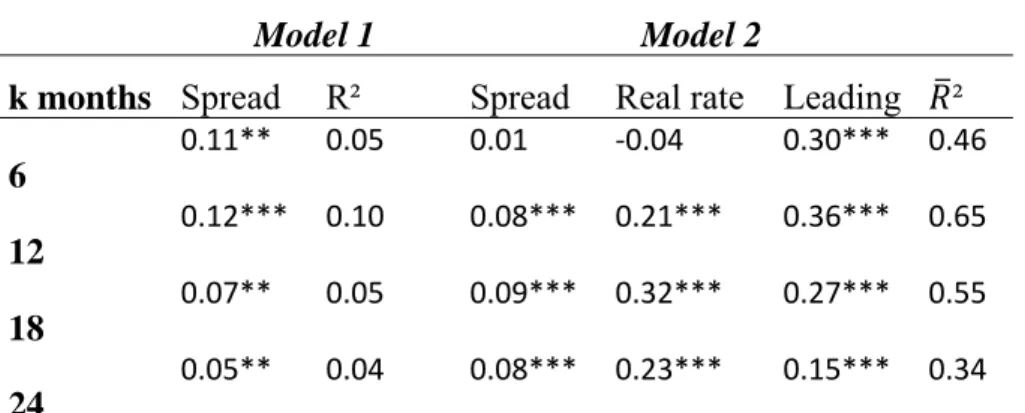
model significantly increases the explanatory power of the model. For example, %56 percent of variation in growth over one year time horizon are explained by the multivariate model. As mentioned before, the literature well documents the time variation in the relationship between the yield spread and growth. Monetary policy change is the most important factor that affects this relationship. In order to investigate the time variation in both the strength and the nature of the yield spread-growth relation, we split the sample at 2002 which is the date at which the inflation targeting regime has been started to be implemented3. Before 2002, exchange rate based monetary policies are implemented in Turkey4. Hence, we re-examine the Model 1 and the Model 2 in the sample period of 1993:M1-2001:M12 (pre-2002) and 2002:M1-2011:M8 (post-2002).
Table 2: Predictive Power of the Slope of the Yield Curve on Growth (Pre-2002)
Model 1 Model 2
k months Spread R² Spread Real rate Leading ²
6 0.11** 0.05 0.01 ‐0.04 0.30*** 0.46 12 0.12*** 0.10 0.08*** 0.21*** 0.36*** 0.65 18 0.07** 0.05 0.09*** 0.32*** 0.27*** 0.55 24 0.05** 0.04 0.08*** 0.23*** 0.15*** 0.34
-***, **, *: Indicates that the null of no predictive power is rejected at 1%, 5% and 10 % significance levels.
The findings for the pre-2002 period are similar to those for the whole period. In the Model 1, the coefficient of the yield spread is significant for all time horizons. There is an increase in the explanatory power of the Model 1 but, for none of the time horizons it is higher than 10 percent. The results of the Model 2 imply that the yield spread has marginal explanatory power for future growth. Neither the yield spread nor the real rate has any explanatory power on growth over six-month time horizon.
3 Kaya and Yazgan (2011) show that in 2002 there is a structural break in the relationship between the slope of
the yield curve and future inflation in Turkey.
4 In order to have detailed information about the evaluation of monetary policy in Turkey see Civcir and
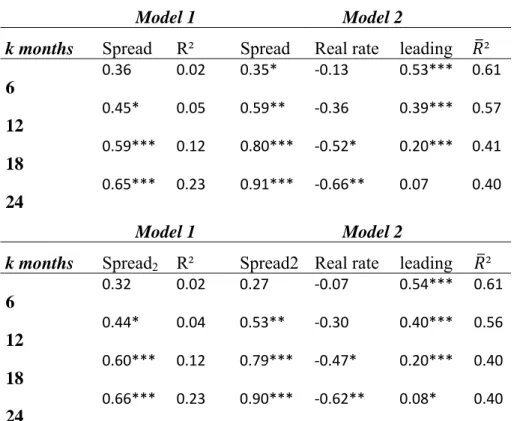
Table 3: Predictive Power of the Slope of the Yield Curve on Growth (post-2002)
Model 1 Model 2
k months Spread R² Spread Real rate leading ²
6 0.36 0.02 0.35* ‐0.13 0.53*** 0.61 12 0.45* 0.05 0.59** ‐0.36 0.39*** 0.57 18 0.59*** 0.12 0.80*** ‐0.52* 0.20*** 0.41 24 0.65*** 0.23 0.91*** ‐0.66** 0.07 0.40 Model 1 Model 2
k months Spread2 R² Spread2 Real rate leading ²
6 0.32 0.02 0.27 ‐0.07 0.54*** 0.61 12 0.44* 0.04 0.53** ‐0.30 0.40*** 0.56 18 0.60*** 0.12 0.79*** ‐0.47* 0.20*** 0.40 24 0.66*** 0.23 0.90*** ‐0.62** 0.08* 0.40
-***, **, *: Indicates that the null of no predictive power is rejected at 1%, 5% and 10 % significance levels.
Table 3 documents the estimation results for the post-2002 period. They suggest that the yield spread has lost its predictive power in short time horizons, however, its predictive power has increased in long time horizons. The magnitude of the estimates of the yield spread is very high with respect to the pre-2002 period. One percent increase in the yield spread increases growth over two (one) year horizon 0.65 (0.60) percent. The yield spread can explain 23 percent of the variation in industrial production growth over two year time horizon. The results of the Model 2 also suggest that the yield spread continues to exhibit information for future growth and the magnitude of estimate of increases as k increases. While the coefficient of the leading indicator is significant for all time horizons, the coefficient of the real rate is significant for 1.5 and 2 year time horizon. The sign of the real rate in the post-2002 period is negative as it is expected to be5. For the post-2002 period, we have two-year interest rates, yt(24). Thus, we re-estimate the equation (1) and (2) using the spread between
yt(24) and yt(1), denoted by Spread2, and report the results on Table 3. We find that including
Spread2 does not change the main conclusion.
5 Consistently, Civcir and Akcaglayan (2010) find that a positive shock in interest rate increases output gap in
5. The yield curve and recession prediction
Figure 2 plots the yield spread and recessions in Turkey. In the next section we describe how these recessions are determined. The yield curve is usually upward sloping during the period of 1993-2011, however, the slope of the yield curve is negative before every recession but the last one6.
Figure 2: The Slope of the Yield Curve and Recessions
Note:The shaded are denotes recession.
5.1. Determining recessions: BBQ method
In order to determine recessions we use the Pagan’s BBQ method which is a non-parametric method. The BBQ method uses the principles of Bry and Boschan (1971) which underline much of the NBER business cycles dating philosophy.
If is a series that represents aggregate economic activity and , in the BBQ method a local peak occurs at time t if is greater than , k=1,2,….K, and in a similar manner, a local though occurs at time t if is less than , k=1,2,….K, where K is generally set to 5 if monthly series are used. In order to eliminate the local peak and though, a set of rules is needed. The main criteria for that purpose are that a phase must last at least 6 months and a complete cycle should have a minimum duration of 15 months. The recession is
6 It is worth to note that the crisis of 2008-09 in Turkey has been similar to the earlier ones in some respects, but
there have also been important differences. For a detailed discussion see Uygur (2010).
-0.8 -0.4 0.0 0.4 0.8 1994 1996 1998 2000 2002 2004 2006 2008 2010
the time between peak and though and the use of five months and other criteria do not allow to call recession too often (Harding and Pagan, 2002; Pagan, 2010).
According to Harding and Pagan (2002) in measuring the cycle characteristics, four items provide useful information for inspecting a cycle;
• Duration of the cycle and its phases • Amplitude of the cycle and its phases • Any asymmetric behavior of the phases • Cumulative movements within the phases
Harding and Pagan (2002) describe these items visually by considering a phase as a triangle. Figure 3: A stylized Recession
Since A represents a peak and C represents a though, Figure 3 shows a stylized recession (time between peak and though). The area of triangle is an approximation to cumulative losses in output during a recession.
Pagan (2010) using BBQ method determines the recessions in Turkey. He uses quarterly GDP data over the period 1987:Q4-2010:Q1. Pagan (2010) finds six recessions which are; 1988:Q4-1989:Q2, 1991:Q1-1991:Q2, 1994:Q2-1995:Q1, 1998:Q4-1999:Q4, 2000:Q1-2001:Q4 and 2008:Q4-2009:Q3.
We employ the BBQ method to determine recessions in the period of 1986:M1 to 2011:M8. The calculated business cycles from are tabulated in Table 4.
Table 4: Business Cycles Date and Duration
Peak Though Duration of recession
1988:M8 1989:M4 8 1994:M1 1995:M3 14 1998:M9 1999:M11 14 2001:M1 2002:M02 13 2008:M7 2009:M9 14
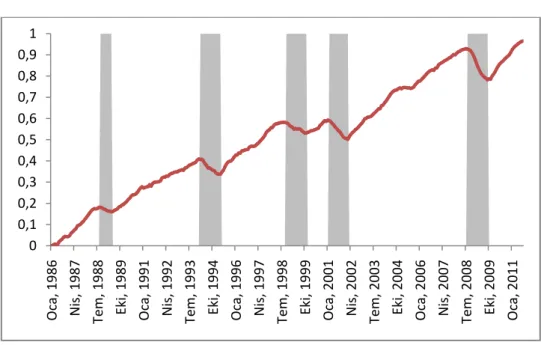
Figure 4: S.A. log IPI and Recession Periods (1986:M1-2011:M8)
Figure 4 shows the seasonally adjusted IPI series and recessions. For graphical purpose we transform between 0 and 1. The estimated recessions in some cases are not in line with the findings of Pagan (2010). According to Pagan (2010), 1994 recession started at the second quarter but in our experiment it starts at the beginning of 1994 while ending dates are similar. The findings for the recession around 1998/1999 and in 2008/2009 are consistent with Pagan (2010). However, Pagan (2010) determines fourth recession in the beginning of 2000 but we find that it started almost one year later which is at 2001:M1. Tastan and Yildirim (2008) analyze the business cycles in Turkey by using IPI series and employing the MS-AR model over the period 1985M1-2003M1. They find that the recessions are 1994:M2-1995:M1, 1998:M8-1999:M10 and 2001:M2-2002:M2. These recessions are very similar to our findings and agree with us about the starting date of 1994 and 2001 recessions. Moreover, Saltoğlu et. al (2003) using GDP, IPI, total consumption and leading index employ the MS-AR and the MS-VAR to determine the recessions over the period 1988:Q1-2002:Q4. Their recessions are
0 0,1 0,2 0,3 0,4 0,5 0,6 0,7 0,8 0,9 1 Oca, 1986 Nis, 1987 Tem, 1988 Eki, 1989 Oca, 1991 Nis, 1992 Tem, 1993 Eki, 1994 Oca, 1996 Nis, 1997 Tem, 1998 Eki, 1999 Oca, 2001 Nis, 2002 Tem, 2003 Eki, 2004 Oca, 2006 Nis, 2007 Tem, 2008 Eki, 2009 Oca, 2011
1988:Q3-1989Q1, 1990:Q3-1991:Q1, 1993:Q4-1994Q4, 1998:Q2-1999:Q3 and 2000:Q3-2001:Q4, which are also consistent with our results.
5.2. Probit analysis
In the literature, the use of probit model to investigate whether the yield spread predicts recession is very popular. While many studies find that the yield spread alone is useful to predict recessions, Wright (2006) argues that an increase in the short rate not necessarily has the same consequences as a decrease in the long rate. Accordingly, Wright (2006) suggests that incorporating the policy rate as an explanatory variable in addition to the yield spread, improves the predictive ability of the yield spread. However, Chinn and Kucko (2010) find that incorporating the short rate reduces the prediction ability of the yield spread across many countries other than the US.
Following Chinn and Kucko (2010), we estimate two models; in the first model we use the yield spread alone and in the second one we augment the first model with the short-term interest rate, yt(1), to isolate the effect of changes in the short-term rate. Particularly the
models are;
Model I: Pr , 1 [4]
Model II: Pr , 1 1 [5]
where t is the current time period, k is the forecast horizon and F(…) is the standard normal cumulative distribution function. Pr , 1 denotes the probability of recession indicator equals to one if economy is in recession for any month between t+1 through t+k. In terms of recession indicator, we use the recessions measured in the previous part. We estimate both models using forecast horizon of 6 month and one year (i.e. k equal to 6 and 12).
In order to measure the goodness of fit we use the pseudo R2. The pseudo R2 is defined as:
1 log
log
where Lu is the unrestricted maximum value of the likelihood function, Lr is the maximum
value of the constraint likelihood function that all coefficients except constant are zero and n is the number of observations.
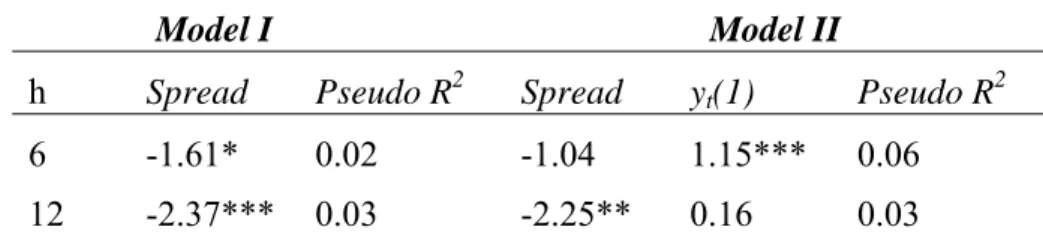
Table 5: Results of Probit Model (1993m1:2011:m8)
Model I Model II
h Spread Pseudo R2 Spread yt(1) Pseudo R2
6 -1.61* 0.02 -1.04 1.15*** 0.06
12 -2.37*** 0.03 -2.25** 0.16 0.03
- **, *: Indicates that the null of no predictive power is rejected at 5 and 10 % significance levels. Autocorrelation robust standard errors are used to calculate
t-statistics.
According to the estimation results of the Model I, the yield spread coefficient is negative and significant for six-month and one-year forecasting periods. The negative sign implies that as the yield spread decreases the likelihood of recession increases. However, the goodness of fit is very small. When we add the short-rate to the model, the spread is not significant any more for six-month forecast horizon. On the other hand, for one-year forecast horizon the yield spread remains significant but the coefficient of the short-rate becomes insignificant and adds noting to the goodness of fit.
Table 6: Results of Probit Model (1993m1:2002m2)
Model I Model II
h Spread Pseudo R2 Spread yt(1) Pseudo R2
6 -1.41 -1.23 0.23
12 -1.87* 0.03 -5.72*** -4.01 0.21
- **, *: Indicates that the null of no predictive power is rejected at 5 and 10 % significance levels. Autocorrelation robust standard errors are used to calculate
t-statistics.
Considering that the yield spread gives no signal for the last recession (Figure 2), we estimate the both models in the sample period of 1993:M1-2002:M2 where the last date is the date at which the penultimate recession ends. The results suggest that when the short-term fluctuations are isolated by adding the short-rate, the goodness of fit increases from 3 to 21 percent for one year forecast horizon. It is worthy of note that when the short-rate alone is used, the pseudo R squared is only 0.04.
Overall, the spread of the yield curve has predictive power on the recessions, however, the goodness of fit is small. On the other hand, when the recessions other than the last one are considered, the goodness of fit significantly increases. It is of interest to consider that the recent financial crisis, which is originated in the advanced economies, has hit many countries
including Turkey and pushed them into a recession. Therefore, we may argue that the inverted yield curve can be regarded as an indicator of a “made in Turkey” recession.
6. Conclusion
The slope of the yield curve has long been regarded as one of the main indicators for future economic activity. Numbers of studies show that using the yield spread it is possible to predict future economic growth and the inverted yield curve serves as a signal for a future recession. In this study, we investigate the information content of the yield spreads in Turkey for the IPI growth and recession. Using the linear regression model we show that the yield spread has some predictive ability on the future IPI growth even after controlling for the other leading indicators of economic activity, however, the goodness of fit is low. Additionally, we find that in the IT period, the prediction power of the yield spread increases. We also examine the prediction power of the yield spread on recession by employing a probit model. The recessions in Turkey are determined using the BBQ method. The results of the probit models suggest that the yield spread has ability to predict recession in Turkey one year ahead.
7. References
Ang, A., Piazzesi, M. and Wei, M. (2006) “What does the yield curve tell us about GDP growth?” Journal of Econometrics 131: 359-403.
Ataberk, A., Çoşar, E.E., and Şahinöz, S. (2005)“A composite leading indicator for Turkish economic activity.” Emerging Markets Finance and Trade 41: 45-64.
Bansal, R. and Zhou, H. (2002) “Term structure of interest rates with regime shifts.” Journal of Finance, 57: 1997-2043.
Bernard, H. and Gerlach, S. (1998)“Does the term structure predict recessions? The international evidence.” International Journal of Finance & Economics 3: 195–215.
Bonser C., Morley.R.N. andMorley.R.T(1997) “Does the yield spread predict realeconomic activity? A multicountryanalysis.” Economic Review of Federal Reserve Bank of Kansas City, Third Quarter:37-53.
Bordo, M. D. and Haubrich, J. G. (2004) “The yield curve, recessions, and the credibility of the monetary regime: long-run evidence.” 1875-1997, Working Paper, No. 0402, Federal Reserve Bank of Cleveland.
Bry, G., Boschan, C., (1971) “Cyclical Analysis of Time Series: Selected Procedures and Computer Programs.” New York, NBER.
Chauvet, M. and Potter, S. (2002) "Predicting a recession: evidence from the yield curve in the presence of structural breaks.” Economics Letters 77:245–253.
Chinn,M. D., and Kucko, K. J.(2010)“The predictive power of the yield curve across countries and time.” NBER Working Paper, No: 16398.
Dai, Q. Singleton, K.J. and Yang, W. (2003)“Regime shifts in a dynamic term structure model of U.S. treasury bond yields.”Stanford GSB working paper.
Estrella, A., (2005) "Why does the yield curve predict output and inflation?," Economic Journal, Royal Economic Society 115:722-744.
Estrella, A., A. P. Rodrigues, and S. Schich (2003). “How stable is the predictive power of the yield curve? evidence from Germany and the United States.” The Review of Economics and Statistics 85:629-644.
Estrella, A., Hardouvelis, G.A. (1991) “The term structure as a predictor of real economic activity.” Journal of Finance,46:555–576.
Estrella, A., Mishkin, F.S., (1998) “Predicting US recessions: financial variables as leading indicators.” Review of Economics and Statistics80:45–61.
Filardo, A. J. And Gordon, S. F. (1998)“Business cycle durations.” Journal of econometrics, 85: 99-123.
Friedman, B. M. &Kuttner, K. N. (1991) “Indicator properties of the paper-bill spread: lessons from recent experience.”The Review of Economics and Statistics80: 34- 44.
Galbraith, J.W. and Tkacz, G. (2000) “Testing for asymmetry in the link between the yield spread and output in the G-7 countries.” Journal of International Money and Finance 19: 657-672.
Gamber, E.N., (1996) “The policy content of the yield curve slope.” Rewiev of Financial Economics5:193-179.
Hamilton, J. D. (1989) “A new approach to the economic analysis of nonstationary time series and the business cycle.”Econometrica57: 375–384.
Hamilton, J. D. (1990)“Analysis of time series subject to changes in regime.” Journal ofEconometrics 45: 39–70.
Harding, D. and Pagan, A.R. (2002)“Dissecting the cycle: a methodological investigation.”Journal of Monetary Economics49:365-381.
Harvey, C.R., (1988) “The real term structure and consumption growth.” Journal of Financial Economics22:305–333.
Ivanova, D., Lahiri, K. and Seitz, F. (2000) "Interest rate spreads as predictors of German inflation and business cycles," International Journal of Forecasting, Elsevier16:39-58.
Kaya, H. and Yazgan, M.E. (2011) “Has ‘inflation targeting’ increased the predictive power of term structure about future inflation: evidence from Turkish experience.”Applied Financial Economics 21: 1539-1547.
Kim, K.A., Limpaphayom, P., (1997) “The effect of economic regimes on the relation between term structure and real activity in Japan”. Journal of Economic and Business49:379– 392.
Koeda, J. (2011)“How Does Yield Curve Predict GDP Growth? A Macro-Finance Approach Revisited.”CARF Working Paper, CARF-F-237.
Kozicki, S. and Tinsley, P. A. (2002)“Dynamic specifications in optimizing trend deviation macro models.”Journal of Economic Dynamics and Control 26: 1585–1611.
Lint, R., and Stolin, D. (2003)“The Predictive Power of the Yield Curve: A Theoretical Assessment.”. Journal of Monetary Economics50:1603-1622.
Moersh, P. And Pohl, A. (2011)“Predicting recessions with the term spread - recent evidence from seven countries.”Applied Economic Letters, forthcoming, DOI: 10.1080/13504851.2010.534055.
Montea, F. (2005)“Does the Yield Spread Predict Recessions in the Euro Area?.” International Finance 8:263–301
Nakaota, H. (2005) “The term structure of interest rates in Japan: the predictability of economic activity.” Japan and the World Economy 17:311–326.
Nyberg, H. (2010)“Dynamic Probit Models and Financial Variables in Recession Forecasting.”Journal of Forecast 29: 215–230.
Pagan, A. (2010)“Can Turkish recession be predicted?.”Tüsiad-Koç university economic research forum working paper series, Working Paper 1027.
Paya, I., Venetis, I. A. and Peel, D. A. (2004) "Asymmetry in the link between the yield spread and industrial production.threshold effects and forecasting,” Working Papers. Serie AD 2004-41, InstitutoValenciano de InvestigacionesEconómicas, S.A. (Ivie).
Peel,D. A. and Ioannidis, C. (2003) “Empirical evidence on the relationship between the term structure of interest rates and future real output changes when there are changes in policy regimes.” Economics Letters7:147–152.
Peel,D. A. and Taylor, M P. (1998) “The slope of the yield curve and real economic activity: tracing the transmission mechanism.”Economic. Letters59:353–360.
Plosser, C.I. and Rouwenhorst, K.G. (1994) “International term structures and real economic growth.” Journal of Monetary Economics33:133–155.
Saltoğlu, B. Z. Senyuzve E. Yoldas (2003) “Modeling Business Cycles with Markov Switching VAR Model: An Application on Turkish Business Cycles.” METU Conference in Economics VII September 6-9, 2003, Ankara, Turkey.
Stock, H.J.and Watson, M.W. (2010) “Estimating turning points using large data sets.”NBER Working Paper, No. 16532.
Tastan, H. and Yıldırım, N. (2008)“Business cycle asymmetries in Turkey: an application of markov-switching autoregressions.” International Economic Journal 22: 315-333.
Taylor, J.B., (1993)“Discretion versus policy rules in practice.” Carnegie-Rochester Conference Series on Public Policy 39: 195–214.
Telatar, E., Telatar, F. and Ratti, R. A. (2003) “On the predictive power of the term structure of interest rates for future inflation changes in the presence of political instability: the Turkish economy.”Journal of Policy Modeling 25: 931--946.
Uygur, E. (2010) The global crises and the Turkish economy, Turkish Economic Association Discussion Paper, No: 2010/3.
Wright, Jonathan. (2006) “The Yield Curve and Predicting Recessions.” Finance and Economic Discussion Series No. 2006‐07, Federal Reserve Board.