ONE OF EVERY THREE RETIREES IS WORKING
Seyfettin Gürsel*, Gökçe Uysal ve Ayşenur AcarExecutive Summary
34.6 percent of men and 7.5 percent of women who have retirement income continue working in Turkey. In other words, 2 out of 7 million people entitled to pension payments are still working. Also, informal employment is substantially more prevalent among working retirees. Most of male working retirees are either self-employed or working in family businesses. A large share of female working retirees are wage and salary earners. On the other hand, employment rate for retired men younger than 55 years old is almost 50 percent.
Retirement does not mean the end of working
In this research brief, we analyze the status of retirees who have remained in active employment in post-retirement period using data from 2010 Income and Living Conditions Survey (SILC) published by TurkStat. According to SILC 2010 data nearly 7.1 million people declare that they are receiving pension income (Table 1). On the other hand, a remarkable group of retired people are still working. 2 million of 7.1 million retired individuals (28.2 percent) still continue working.
Conditional on receiving pension income, gender significantly affects the decision of re-entering to labor force. The ratio of working women is quite low compared to the ratio of working men after being entitled to pension payments. Although 1.9 million of 5.5 million (34.6 percent) men who receive retirement income indicate that they are still working, only 128 thousands of 1.7 million female retirees (7.5 percent) continue working. This data analysis implies that retirement and exit from labor force do not occur simultaneously, especially for men.
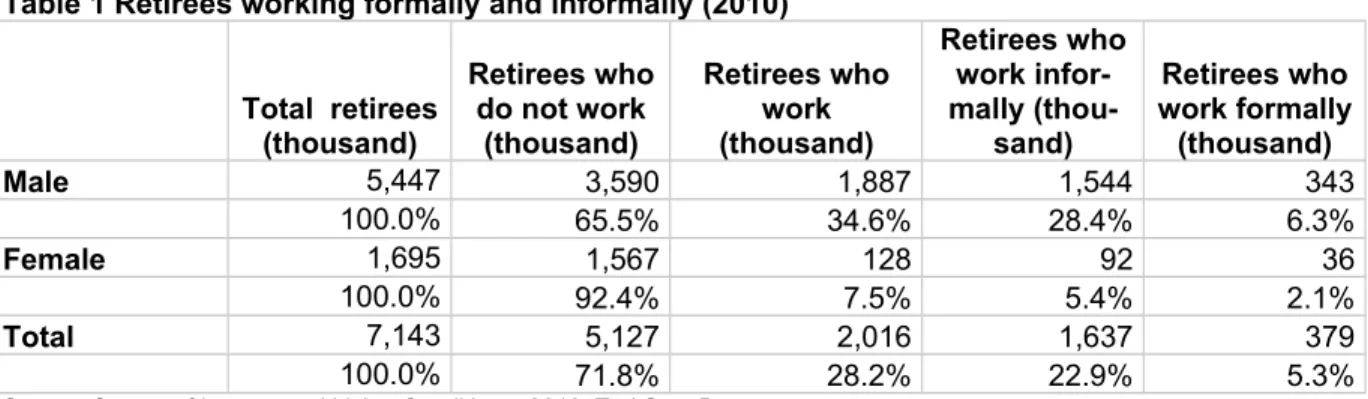
Table 1 Retirees working formally and informally (2010) Total retirees (thousand) Retirees who do not work (thousand) Retirees who work (thousand) Retirees who work infor-mally (thou-sand) Retirees who work formally (thousand) Male 5,447 3,590 1,887 1,544 343 100.0% 65.5% 34.6% 28.4% 6.3% Female 1,695 1,567 128 92 36 100.0% 92.4% 7.5% 5.4% 2.1% Total 7,143 5,127 2,016 1,637 379 100.0% 71.8% 28.2% 22.9% 5.3%
Source: Survey of Income and Living Conditions, 2010, TurkStat; Betam
Retirees who continue to work increase informality
** Prof. Dr. Seyfettin Gürsel, Betam, Director, [email protected]
Yrd. Doç. Dr. Gökçe Uysal, Betam,Assistant Director [email protected]
Ayşenur Acar, Betam, Research Assistant, [email protected]
November 8th 2013
Research Brief 13/157
Note that individuals who continue to work after being entitled to receive pension payments are generally employed informally. A large proportion of male retirees who work (1.5 million) are informal workers. The share of informally working retirees to total informal employment in nonagricultural sectors is 17.9 percent. 92 thousands women who receive pension payments are working informally and 36 thousands of them are working formally. Given that retirement entitles workers to health insurance and pension payments, individuals do not seem to be concerned with working formally. Likewise, firms might prefer to employ retired people informally in order to reduce labor costs.
Half of the young retirees are working
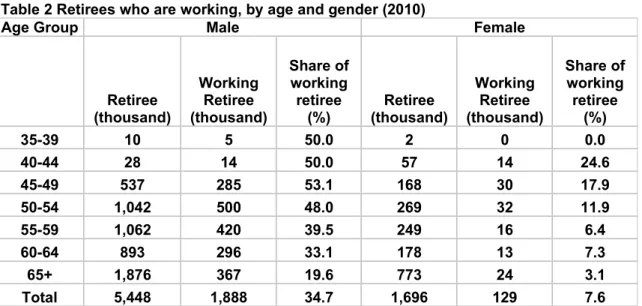
Table 2 gives the distribution of retirees who are working by age. The ratio of male working retirees to total retirees in age groups has remained around 50 percent below 54 years of age. However starting from 55 years of age it is gradually diminishing. In other words, half of the young retirees continue working in spite of receiving pension income. The ratio of working for male retirees in age group over 65 has declined to 20 percent. Compared to males the ratio of working among female retirees is quite low. Even then, working among the retired females is common.
Table 2 Retirees who are working, by age and gender (2010)
Age Group Male Female
Retiree (thousand) Working Retiree (thousand) Share of working retiree (%) (thousand)Retiree Working Retiree (thousand) Share of working retiree (%) 35-39 10 5 50.0 2 0 0.0 40-44 28 14 50.0 57 14 24.6 45-49 537 285 53.1 168 30 17.9 50-54 1,042 500 48.0 269 32 11.9 55-59 1,062 420 39.5 249 16 6.4 60-64 893 296 33.1 178 13 7.3 65+ 1,876 367 19.6 773 24 3.1 Total 5,448 1,888 34.7 1,696 129 7.6
Source: Survey of Income and Living Conditions, 2010, TurkStat; Betam
Data in Table 1 and Table 2 taken together imply that, in Turkey, receiving pension income does not mean leaving the labor market, which is contradicting with the definition of retirement and this is more commonly observed for men. However, pension income should be considered as savings for individuals in the post-retirement period. In this regard, existence of retired but still working individuals indicates that in Turkey there is no correspondence between the age of retirement and the age of exit from labor force. These results should be taken into account to evaluate the age of retirement and pension payments. Otherwise, early payment of pension incomes may weaken labor market attachment of individuals.
Men are self-employed, women are wage workers
Table 3 displays the employment status of retirees who are still working. Observe that working male retirees consist mainly of employed individuals. Half of retirees who are still working are self-employed, 12.1 percent of them are employees and 4.2 percent of them are unpaid family workers. In other words, two-thirds of working male retirees is self-employed and one-thirds is working as regular or causal employers. For women, the situation is quite different. The ratio of female retirees working as regular employers to total female working retirees is 40 percent; one-thirds of them are self-employed and one-fourths are unpaid family workers. Since the number of male working retirees is more than that of woman, the employment distribution of total working retirees is parallel to that of male working retirees.
Table 3 The labor force status of working retirees (2010) Working re-tirees (thousand) Regular Employee (thousand) Casual Em-ployee
(thousand) (thousand)Employer
Self-em-ployed (thousand) Unpaid Family (thousand) Male 1888 439 131 227 1009 79 100 23,3 7,0 12,1 53,5 4,2 Female 128 44 4 7 38 33 100 34,9 3,6 5,9 30,0 25,7 Total 2016 484 136 235 1048 112 100 24,0 6,8 11,7 52,0 5,6
Source: Survey of Income and Living Conditions, 2010, TurkStat; Betam
Retirees in the Black Sea region continue to work
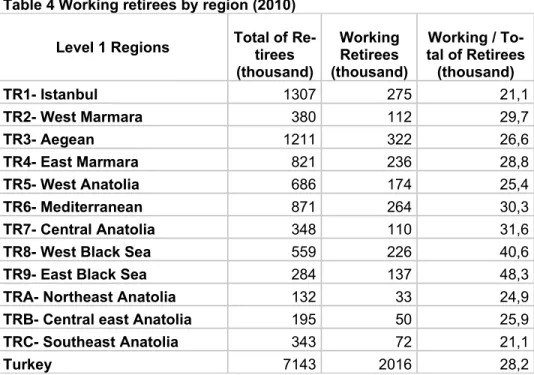
The ratio of retirees who are working to total retired individuals by regions is provided in Table 4.
According to data, the ratio of retirees who are working to total retired people is 48.3 percent in Black Sea. However, the same ratio for Turkey in general is 28.4 percent (Table 4). West Black Sea with 40.6 percent is the region with the second highest working retiree ratio. Regions above the average in Turkey are West Marmara, East Marmara, Mediterranean and Central Anatolia. Southeast Anatolia and Istanbul have the lowest ratio (2.1 percent).
Table 4 Working retirees by region (2010) Level 1 Regions Total of Re-tirees
(thousand) Working Retirees (thousand) Working / To-tal of Retirees (thousand) TR1- Istanbul 1307 275 21,1 TR2- West Marmara 380 112 29,7 TR3- Aegean 1211 322 26,6 TR4- East Marmara 821 236 28,8 TR5- West Anatolia 686 174 25,4 TR6- Mediterranean 871 264 30,3 TR7- Central Anatolia 348 110 31,6
TR8- West Black Sea 559 226 40,6
TR9- East Black Sea 284 137 48,3
TRA- Northeast Anatolia 132 33 24,9
TRB- Central east Anatolia 195 50 25,9
TRC- Southeast Anatolia 343 72 21,1
Turkey 7143 2016 28,2